
 Facebook
 X
X
 Pinterest
 Copy Link
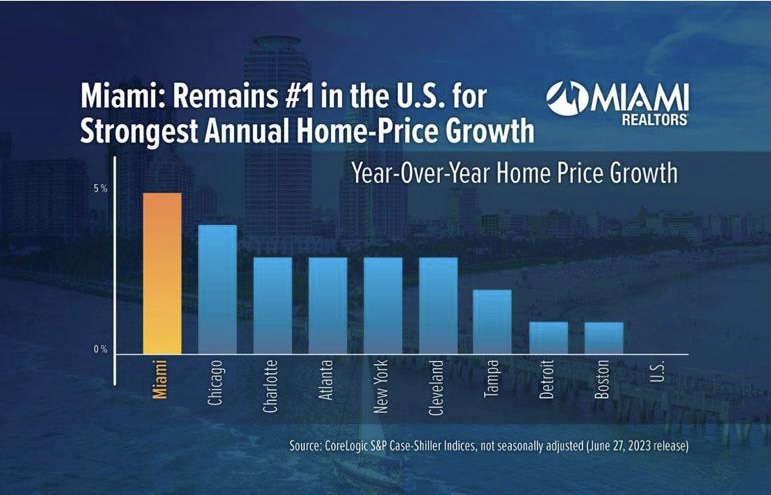
Strong monthly gains reflect that homebuying activity is heating up in many markets
While monthly home price gains continued to outpace seasonal trends for the second consecutive month, mortgage rate volatility, along with a number of other consumers’ concerns this spring (including the debt ceiling, recession risks, layoffs, banking turmoil, and a lack of homes for sale) slowed home buying activity.
April home sales declined about 10% from the previous month, which contrasts with the typical 10% gain that has historically been recorded between March and April. Nevertheless, housing trends still continue to tell a tale of two markets: one of the West, which is constrained by a lack of existing inventory and less price growth, and the other of the Southeast and South, where the availability of new homes for sale, relative affordability and continued in-migration continue to put pressure on home prices.
In April, the CoreLogic S&P Case-Shiller Index fell by 0.24% year over year, the first annual loss since April of 2012. However, the annual decline reflects price drops that occurred in 2022 (Figure 1). The non-seasonally adjusted month-over-month index, on the other hand, posted its third month of strong gains, up by 1.3% in April, the same increase recorded in March. Between 2015 and 2019, the monthly index changes from March and April have generally averaged 1% (Figure 2). The recent gains in home prices suggest that they have bottomed out and are on the upward trend again.
Home prices in the national index recorded a 5% cumulative decline in February, but with recent monthly gains, prices are now 2% lower than the 2022 peak. Strong price gains this spring also suggest that overall home price appreciation for 2023 is exceeding many initial expectations. The latest CoreLogic Home Price Index projects that home prices nationally will average a 4% increase in 2023 compared with the previous year.
The 10- and 20-city composite indexes annual increase posted declines in April, down by 1.2% and 1.7%, respectively. The 20-city index had relatively larger declines in home prices over the last year, as smaller metro areas are more sensitive to affordability challenges. But again, over the previous month, the 10-city index was up by 1.73%, while the 20-city index increased by 1.68%. The 10-city index includes currently better-performing metros, such as New York and Chicago, which have seen relatively stronger housing market performance since mid-2022, as the return to cities and offices has gotten underway.
Compared with the 2006 peak, the 10-city composite index is now 42% higher, while the 20-city composite is up by 49%. Adjusted for inflation, which continues to remain concerningly elevated, the 10-city index is now down by 2%, while the 20-city index showed a 3% increase compared with its 2006 high point.
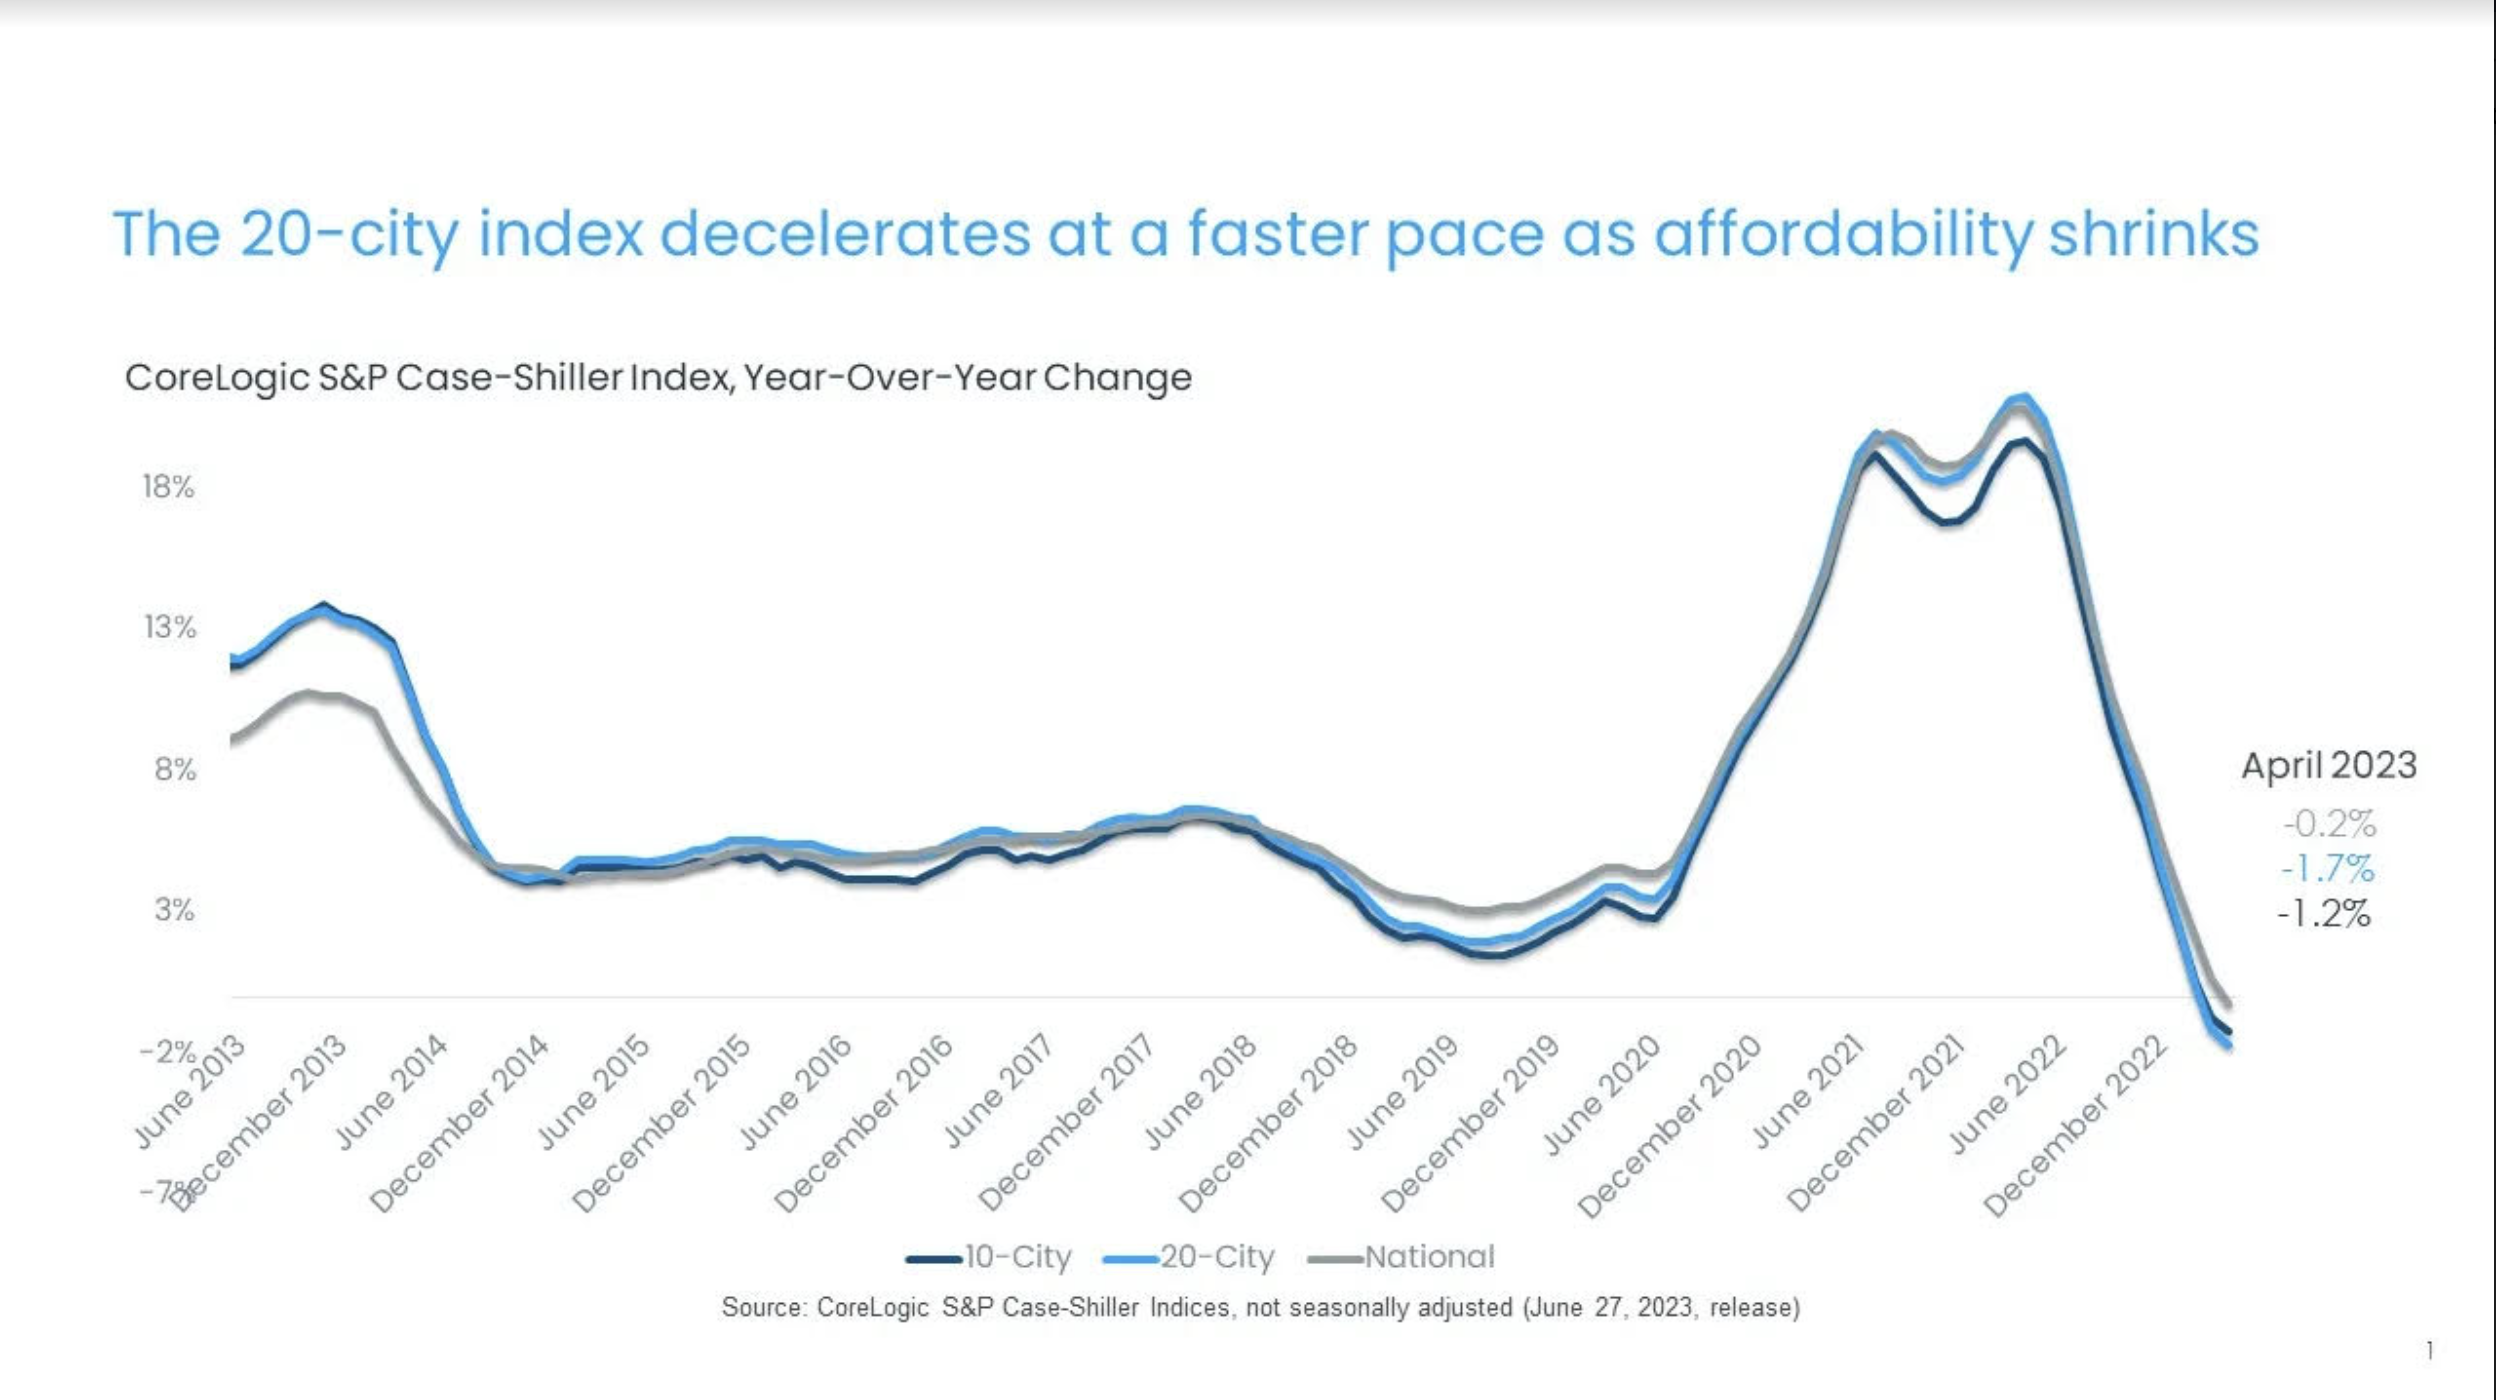 Figure 1: April Home Prices Decline for the First Time Since 2012
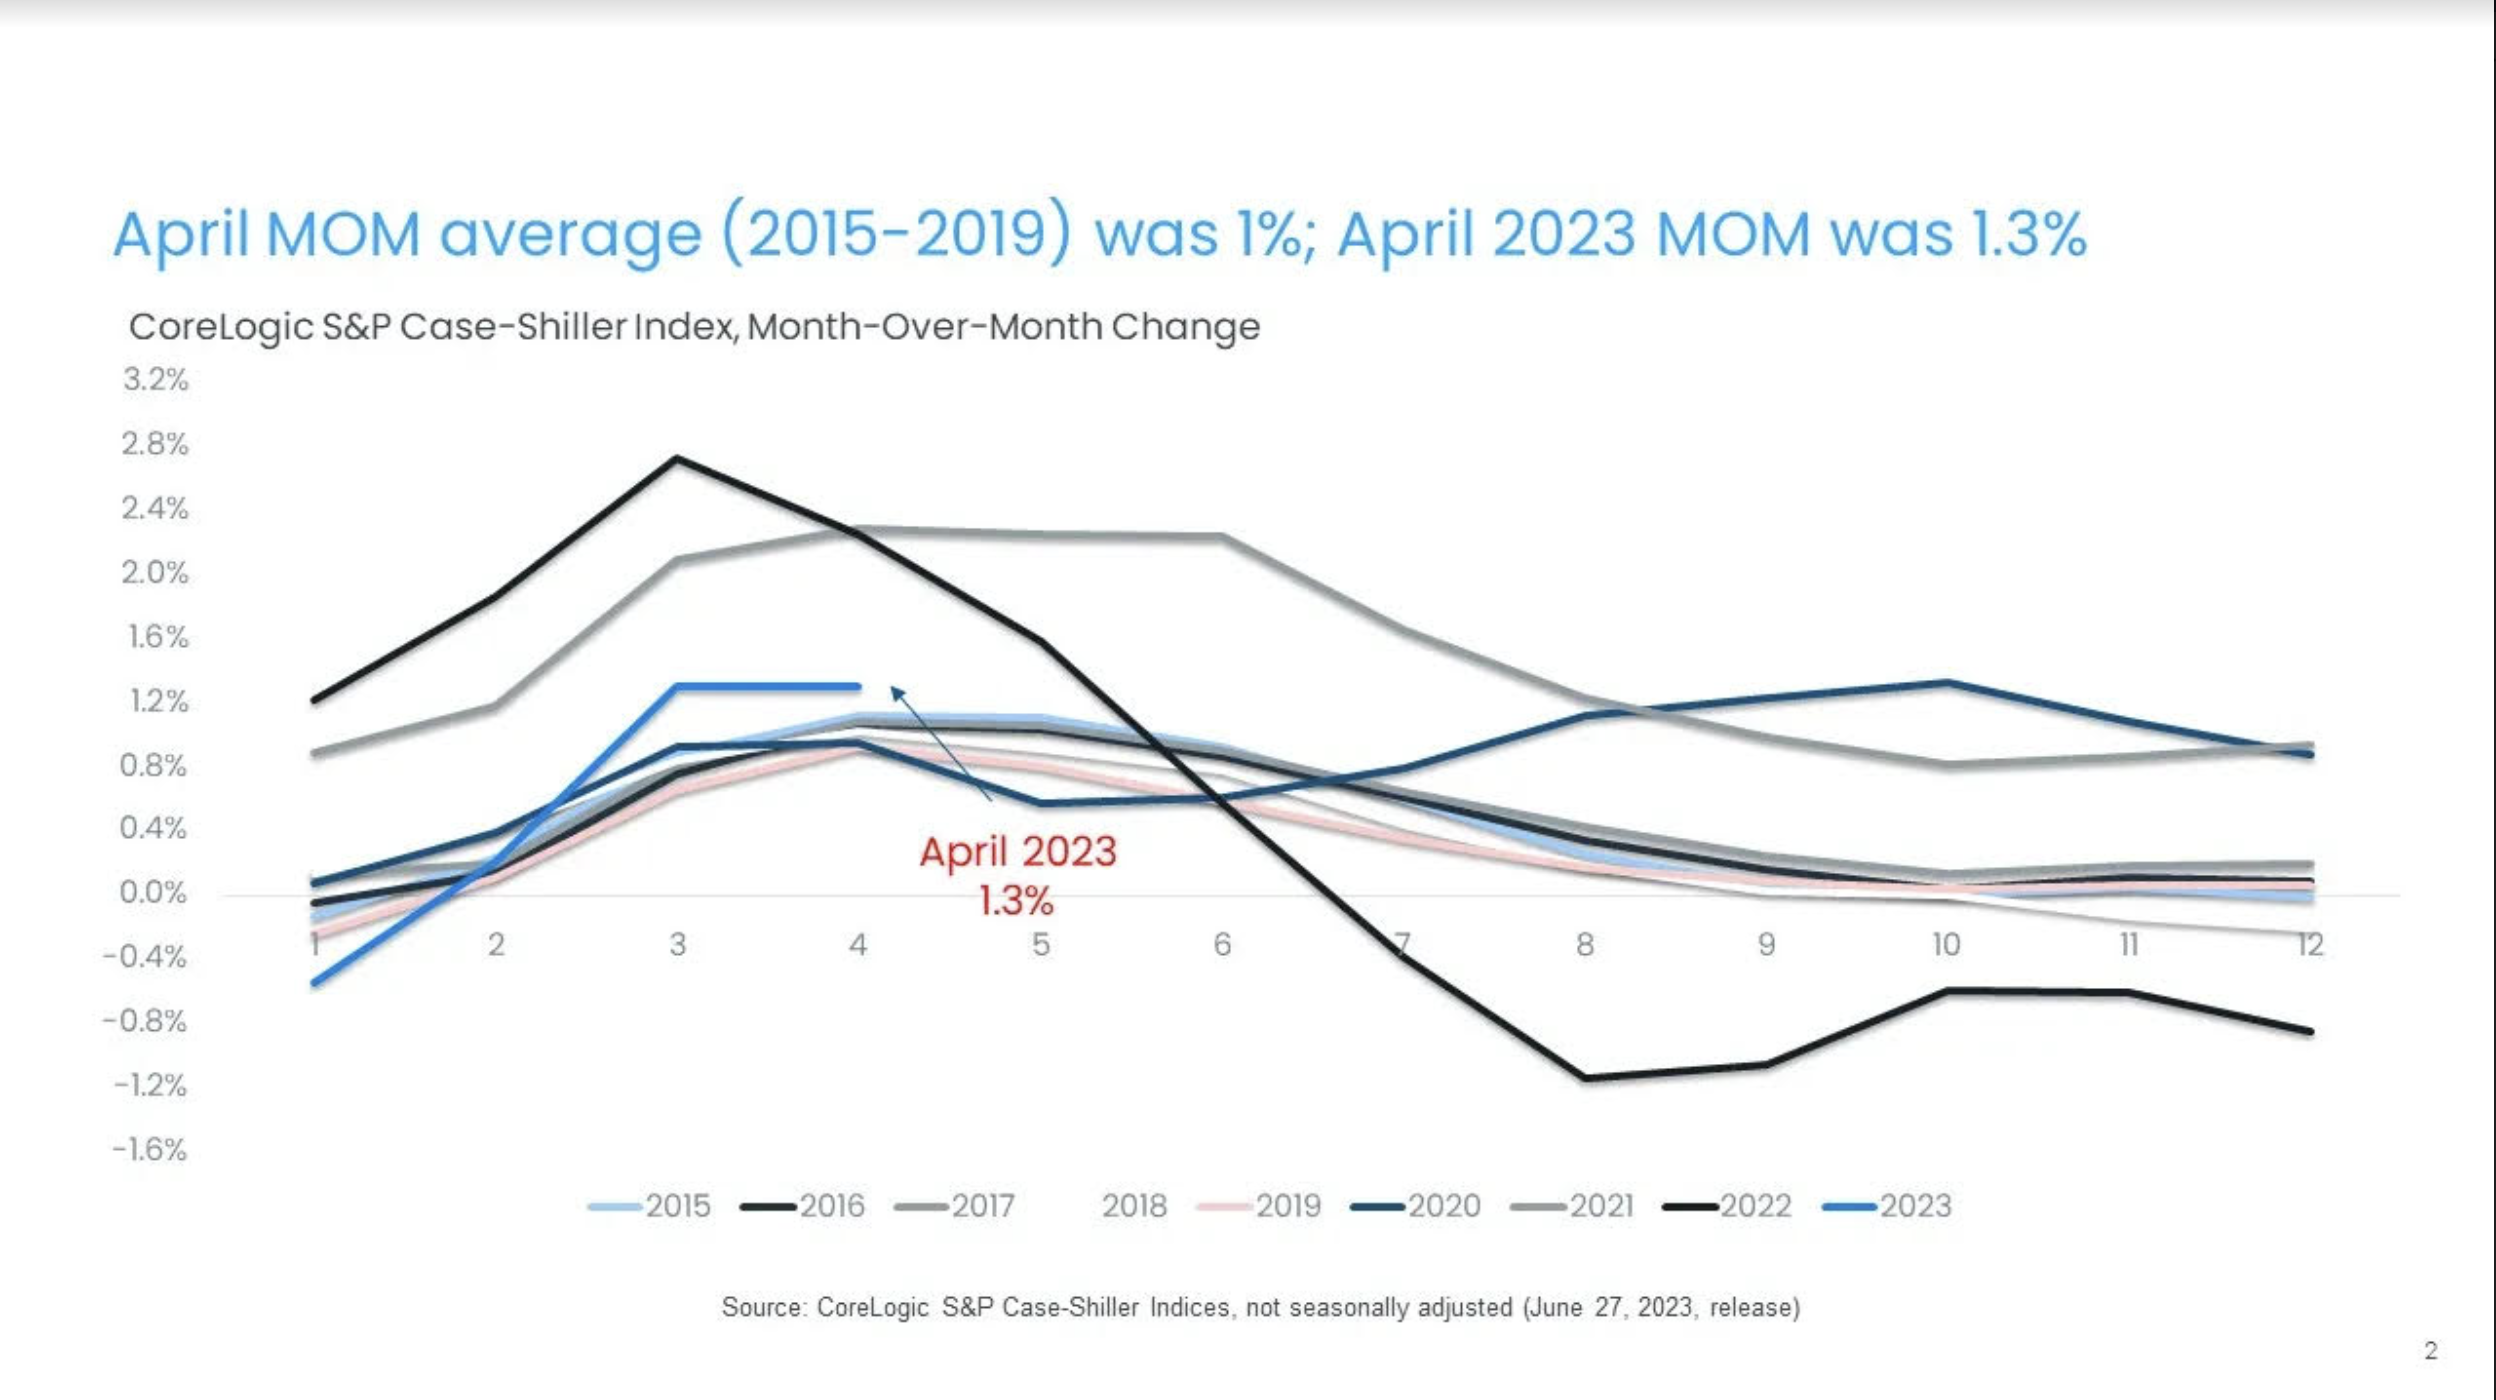 Figure 2: Month-Over-Month Prices Increases Exceed Average in April
In April, all metros continued to experience decelerating annual gains (Figure 3). Miami still ranked No. 1, with a 5.2% annual increase in April, but that is down from March’s non-seasonally adjusted rate of 7.7%. Chicago now ranks second, recording a 4.1% year-over-year gain in April, down from 4.2% in March, when it was the only metro that didn’t record decelerating annual gains. During the pandemic, Chicago posted some of the lowest rates of home price appreciation, and the recent strength reflects the region’s relative affordability.
Atlanta posted the third-highest increase, at 3.5%, while Charlotte, North Carolina saw a 3.4% gain. San Francisco and Seattle both continued to post annual declines, down by a respective 11.1% and 12.4% in April.
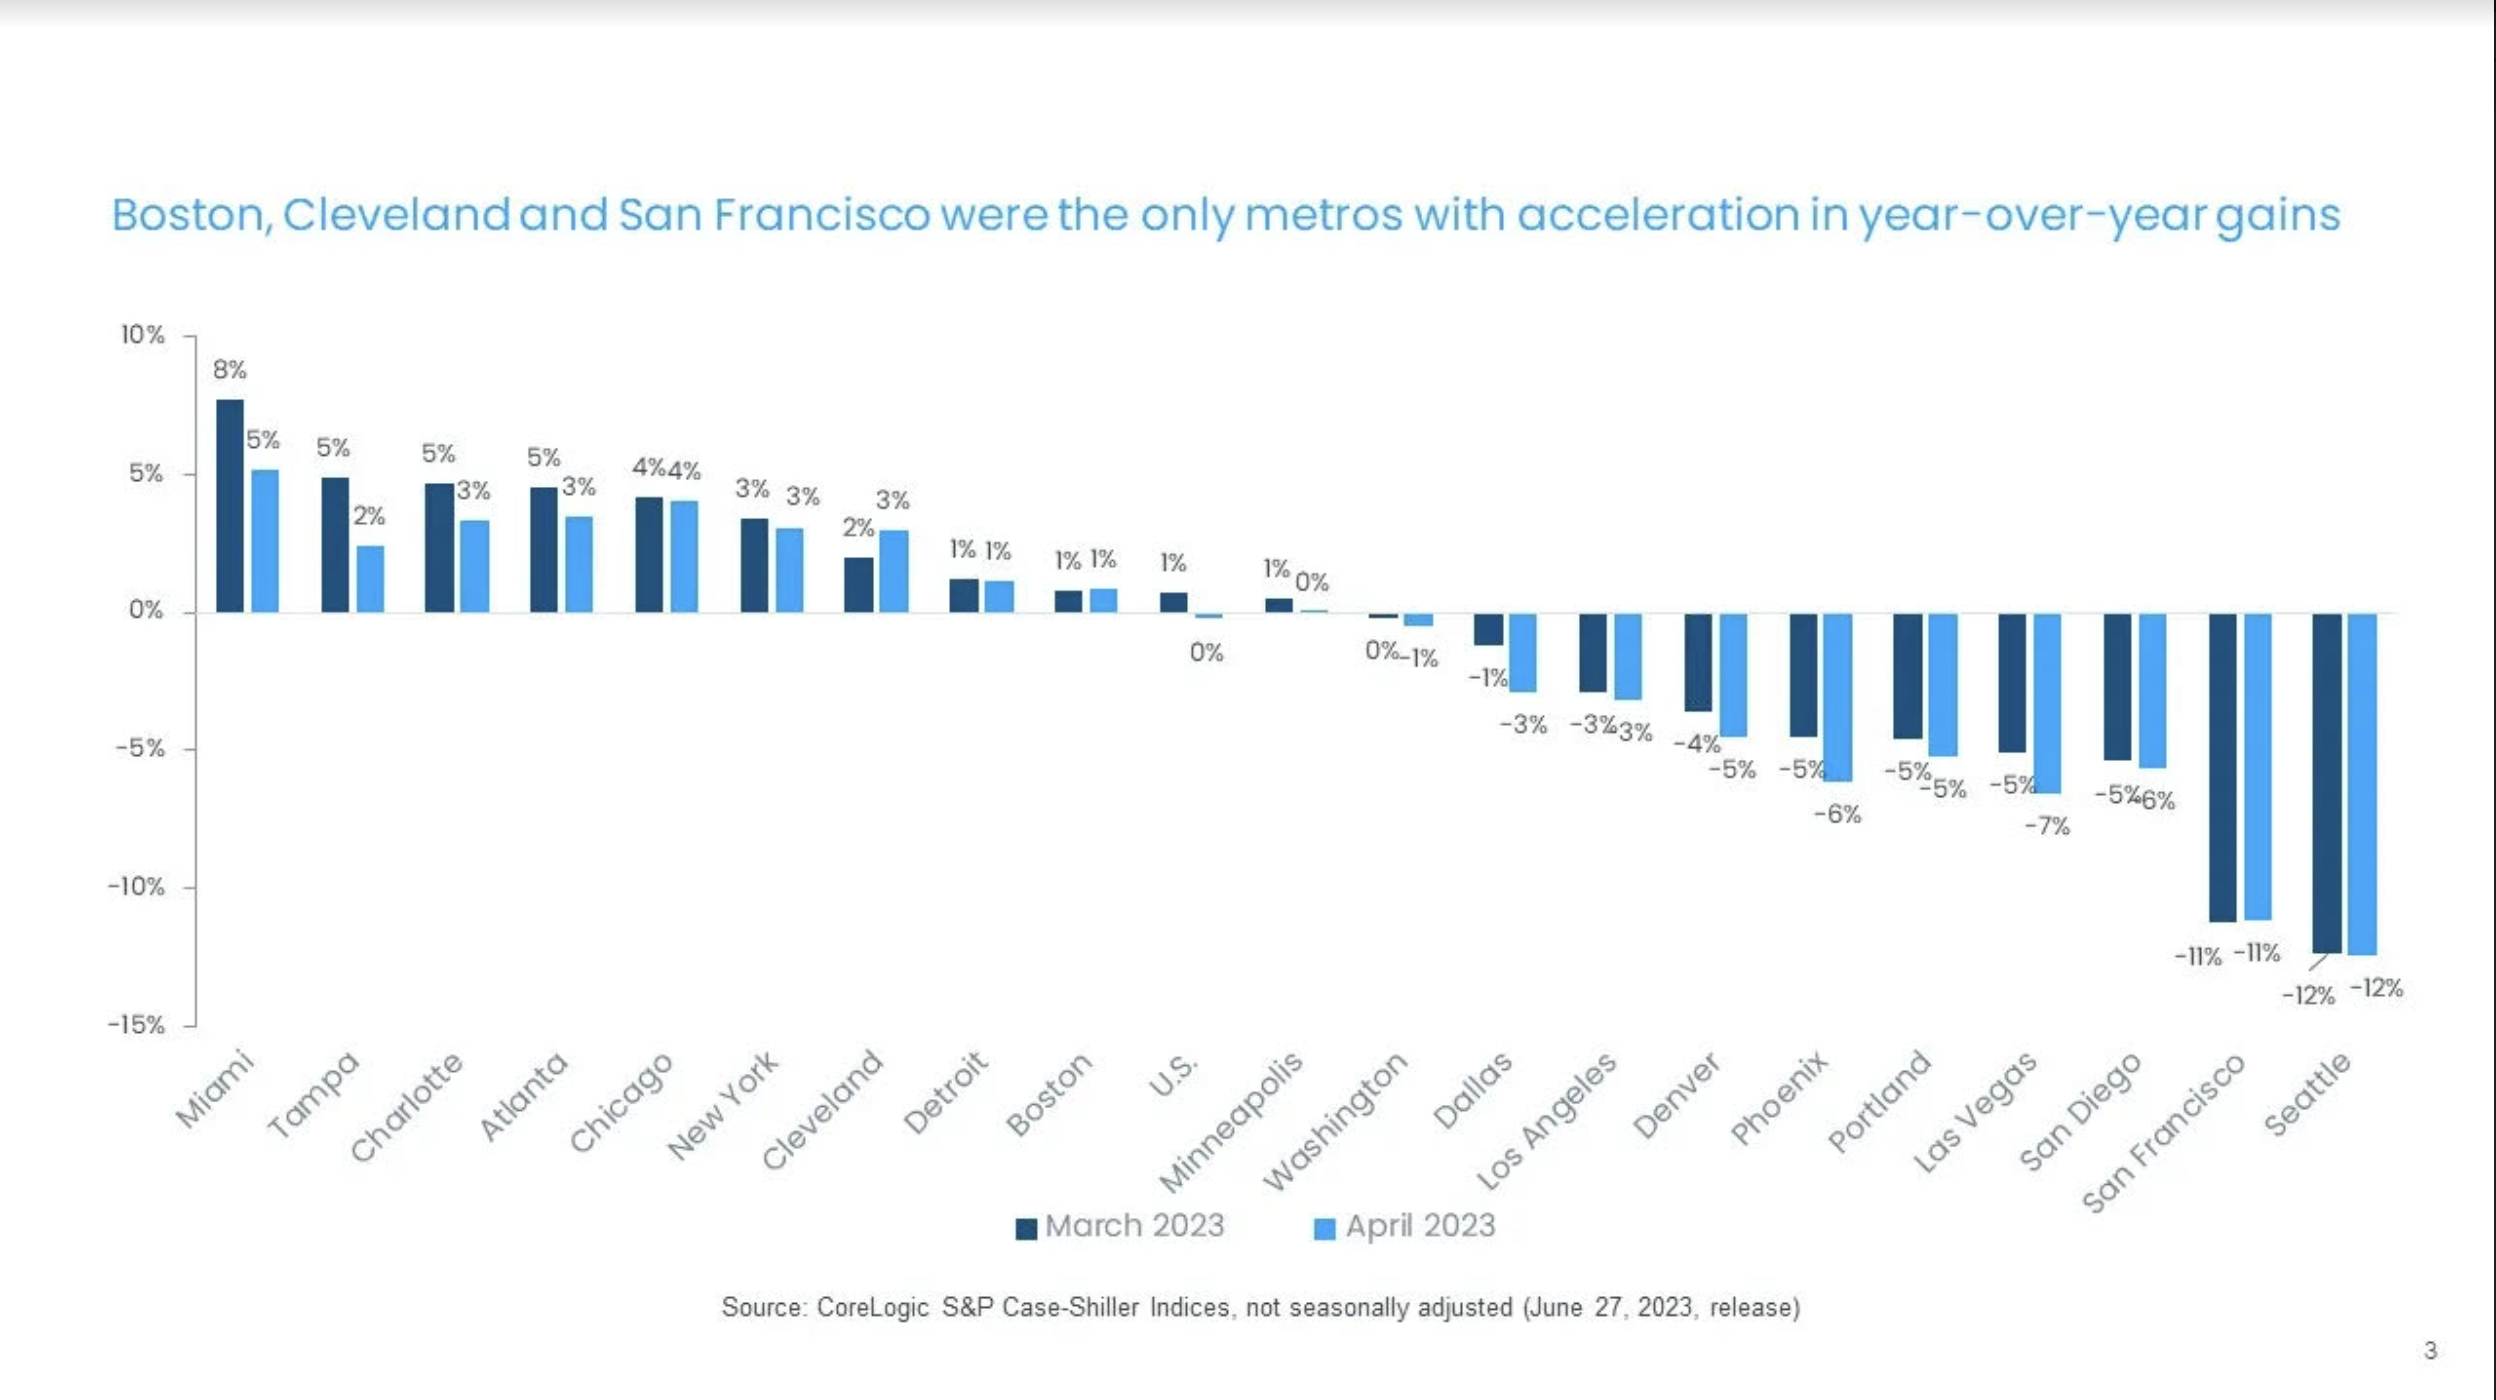 Figure 3: Annual Slowdown in Home Prices Continues Across Metros
While Figure 2 illustrates national monthly gains, all metros saw home price boosts in April, albeit with some variation. Figure 4 summarizes the current year’s monthly gains in April compared with averages recorded between 2015 and 2019.
Boston and Cleveland posted the nation’s largest monthly gains, 2.9% and 2.3% respectively, while Miami; Tampa, Florida; Phoenix and Las Vegas showed the smallest gains of less than 1%. And while Boston and Cleveland saw outsized increases this April, the gains in slower-growing metros are in line with seasonal increases that are historically recorded between March and April (Figure 4)
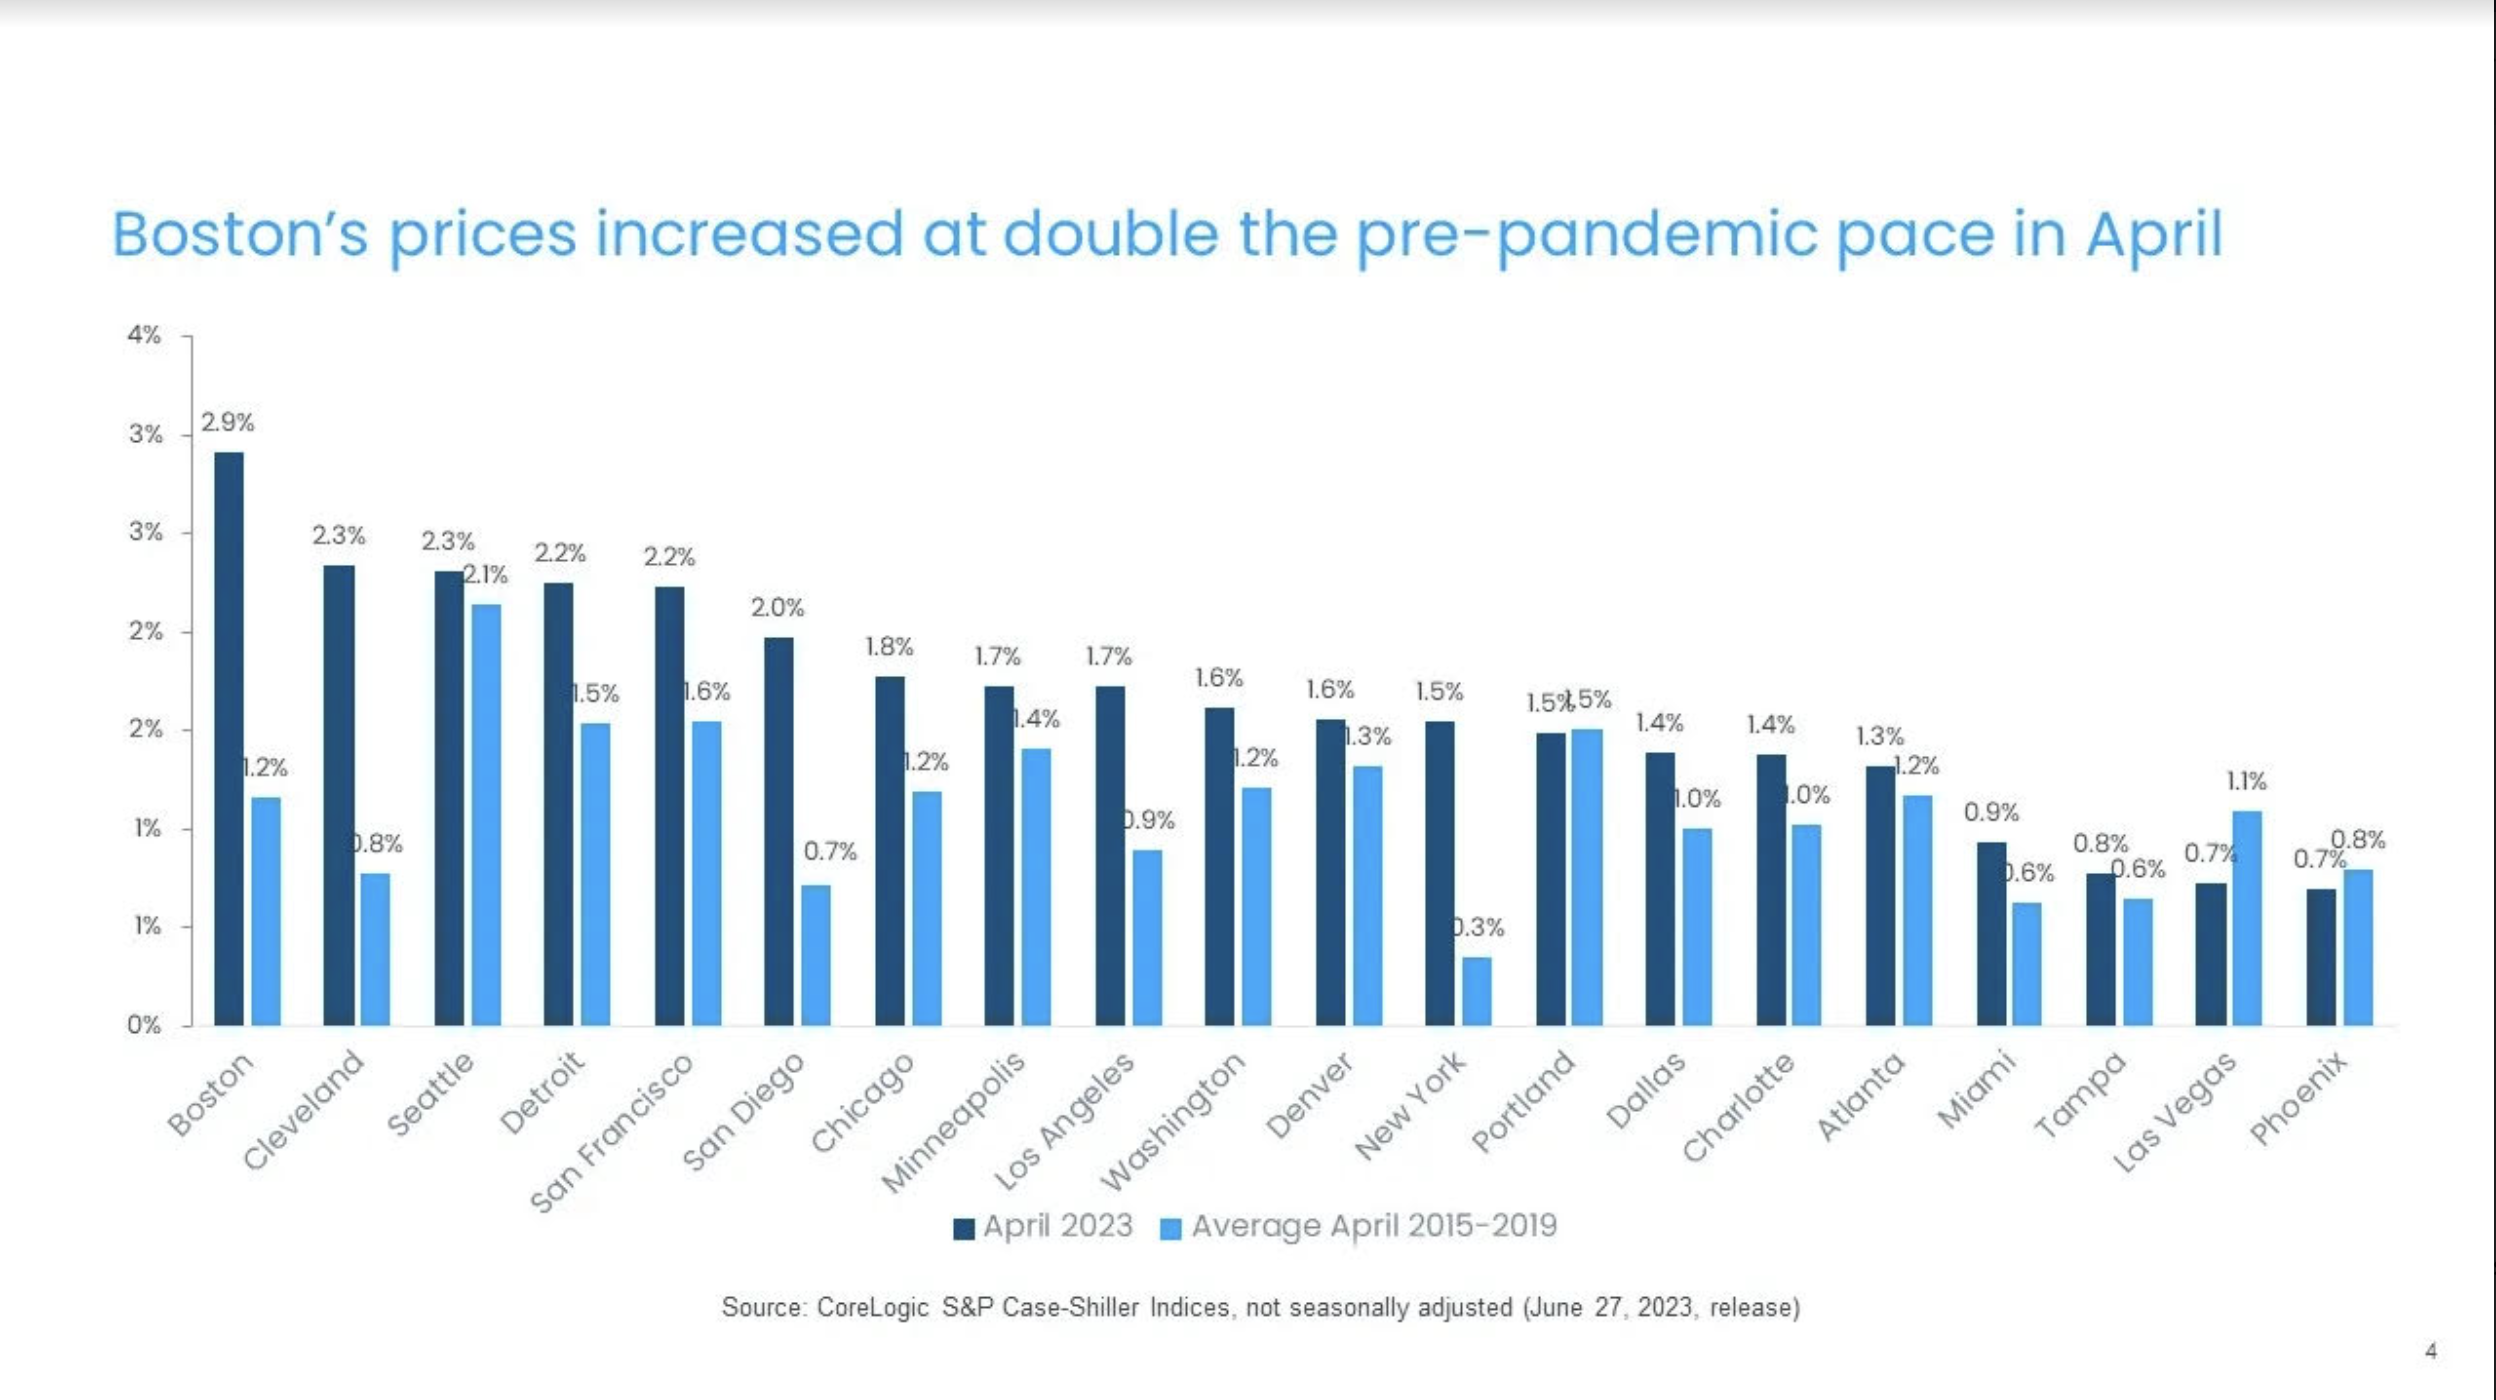 Figure 4: Monthly Gains Exceed Pre-Pandemic Averages in Many Markets
CoreLogic’s Single-Family Rent Index and may reflect the relative greater mobility of higher-income households during the pandemic, which has since waned. In addition, the surge in demand for luxury and second homes seen in 2021 and 2022 also contracted relatively more since the increase in mortgage rates and the stalling of home sales activity.
Nevertheless, while year-over-year gains reflect past declines, it’s interesting to note the recent strength in the high-tier price segment across many markets. The average monthly price gain for low-tier homes was 1.7%, while medium-tier homes were up by 1.6% (though those numbers are not seasonally adjusted). High-tier prices were up by 1.8% month over month on average for the second consecutive month (Figure 5).
The month-over-month comparison of appreciation by price tier and location also reveals relative changes in demand across the country. In April, all metros posted increases across price tiers. While Boston led with the largest increases across price tiers, West Coast markets where price declines have been the largest to date followed the lead, including San Francisco and Seattle. By contrast, Las Vegas and Phoenix continued to post the smallest monthly gains across all price tiers. Interestingly, many high-cost metros, such as Seattle and Washington, D.C., but also Chicago, saw the largest gains in high-priced segments of their respective housing markets.
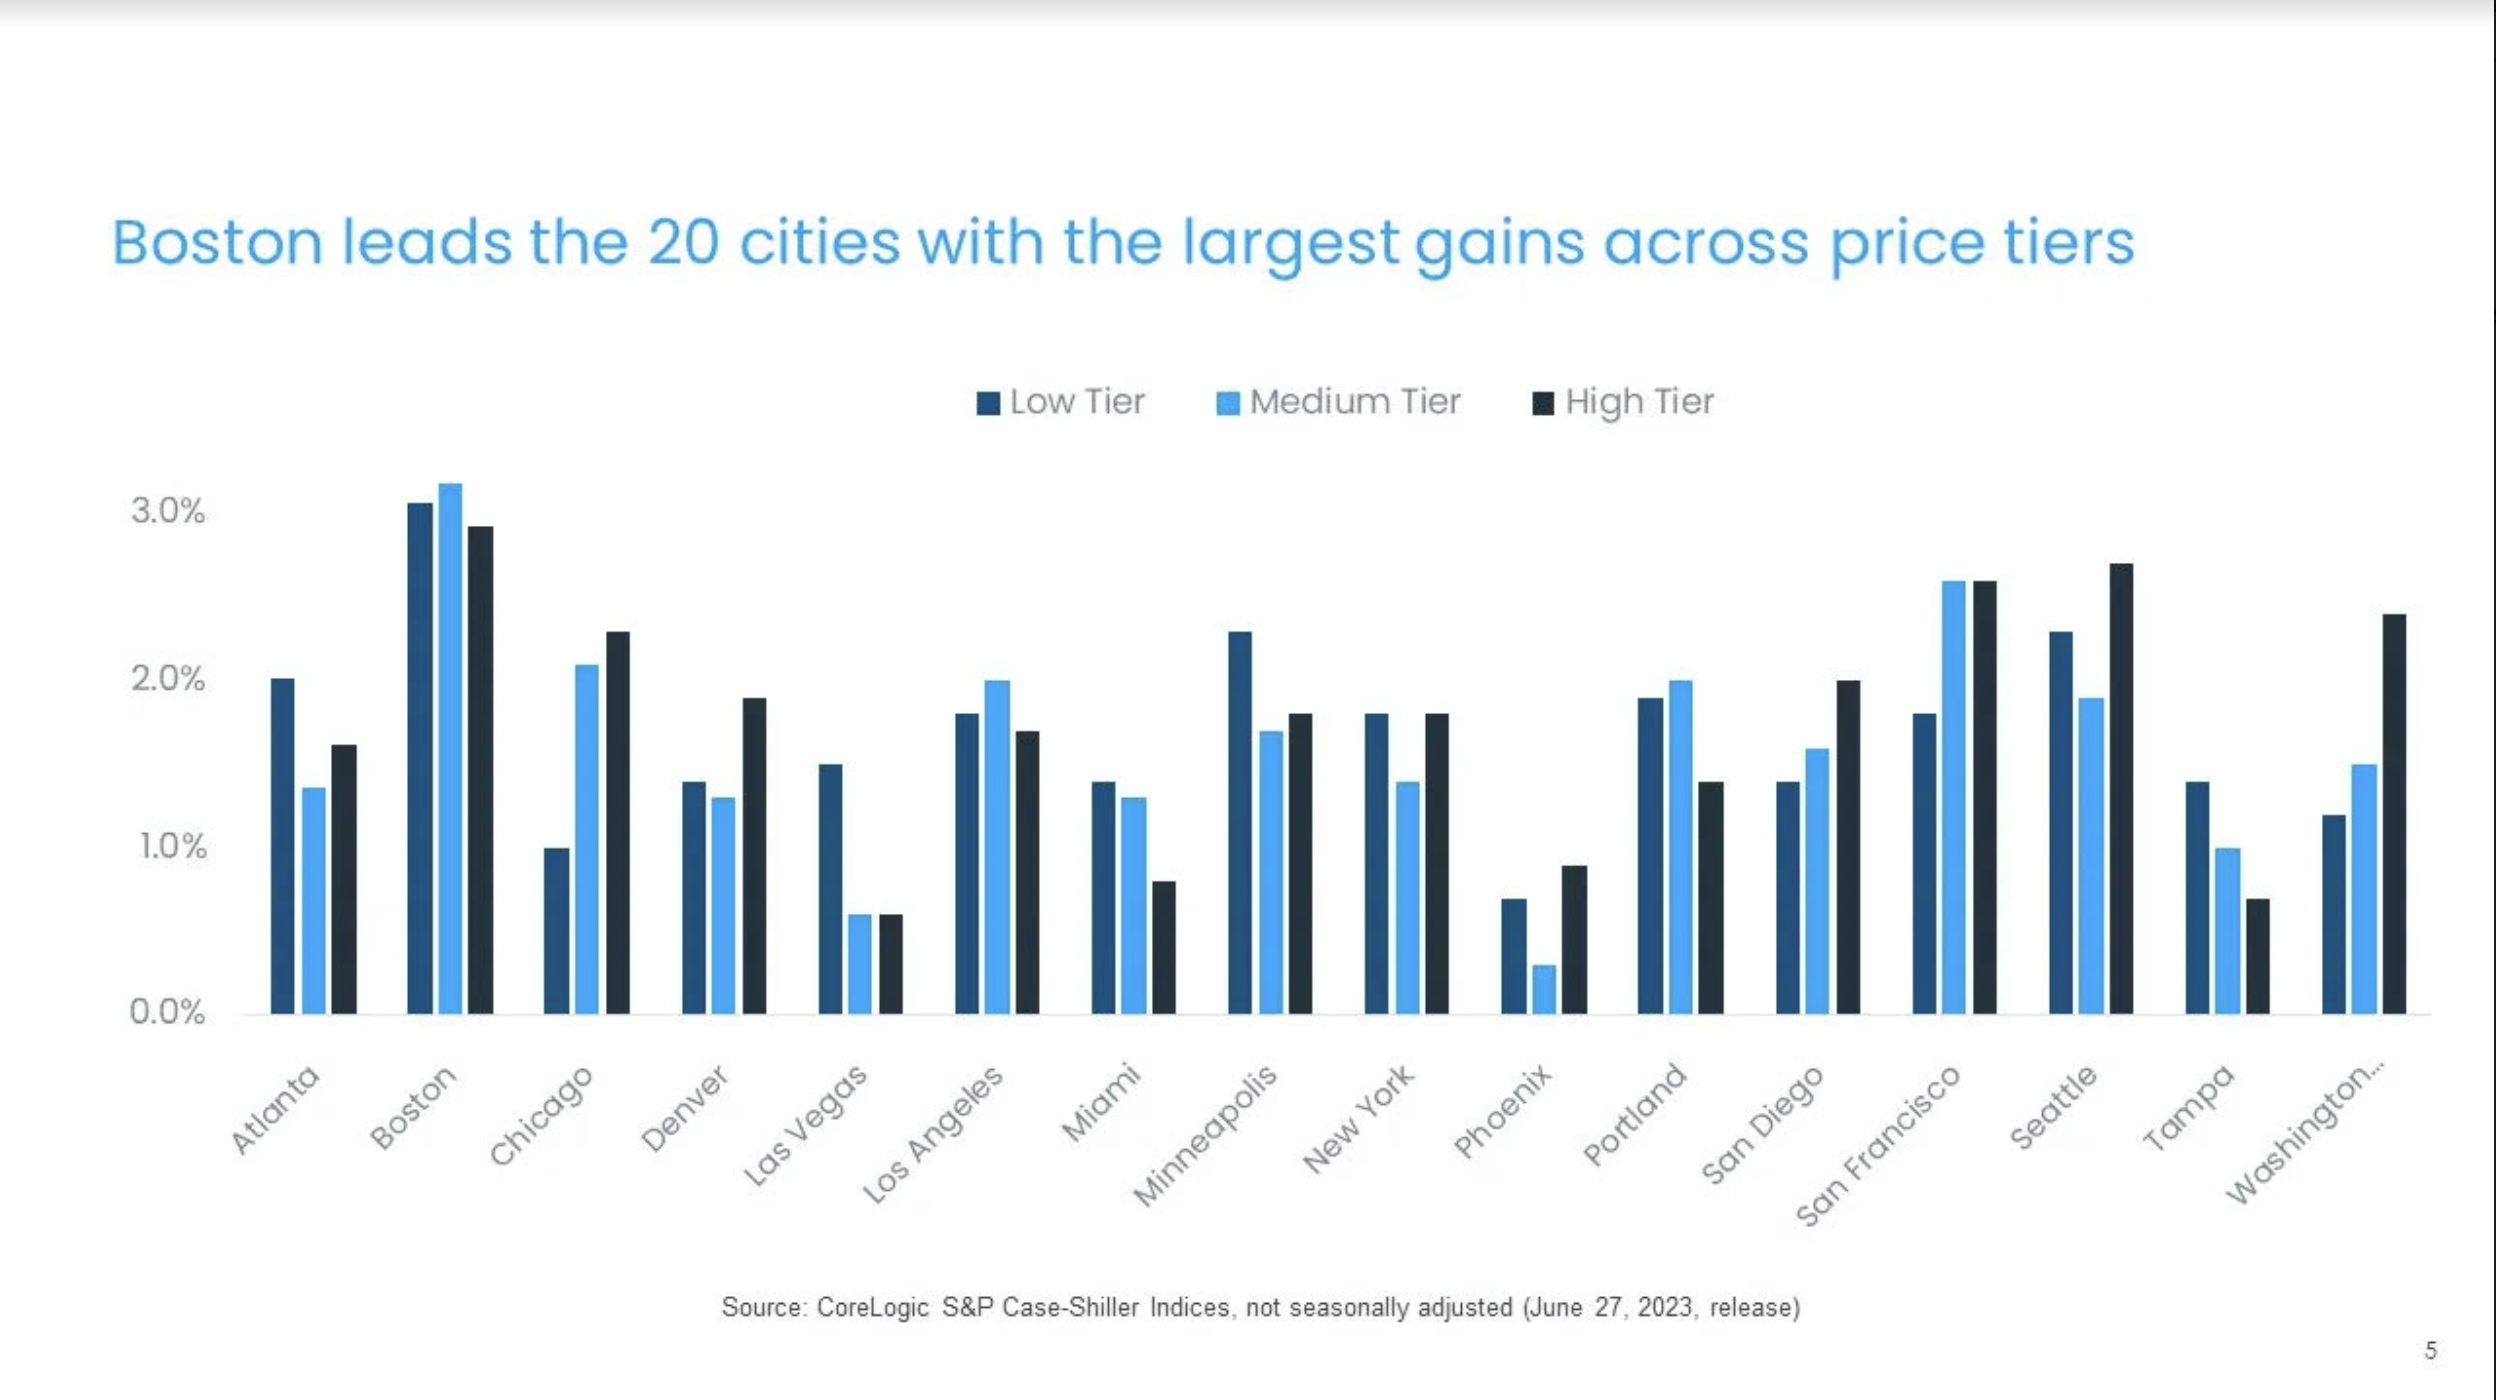
Figure 5: Monthly Price Increases Average 1.7% for Low Tier, 1.6% for Medium Tier and 1.8% for High Tier
Volatile mortgage rates and a lack of homes for sale continue to influence housing market dynamics. While elevated mortgage rates have dampened home price growth and even led to declines in some areas, a lack of inventory continues to keep a floor under prices.
The remainder of the year is likely to continue to reflect these trends, suggesting that 2023 homebuying activity may be the slowest in about a decade, though price growth may return to long-term trends in most markets across the country. In addition, the accumulation of home equity, which averages over $270,000 nationally and more than $1 million in some high-cost areas, supports price appreciation, particularly in in-migrating markets where baby boomers may retire.
#majiramosrealestateadvisorpa #miami_home_trends #majismarketminute #majisold #majipaceramos #miamirealtor #miamirealestate #miamirealestategent #majiramos #Miamirealetstatemarket #homesellinginmiami #miamilistingagent #miamihomesforsale #miamicondosforsale #priceyourhouseright #homevaluation #zillow #zestimate #homecalculator #whatsmyhomeworth #hasmyhomegonedowninvalue #miamihometrends #movingtomiami #miamineighborhoods #
