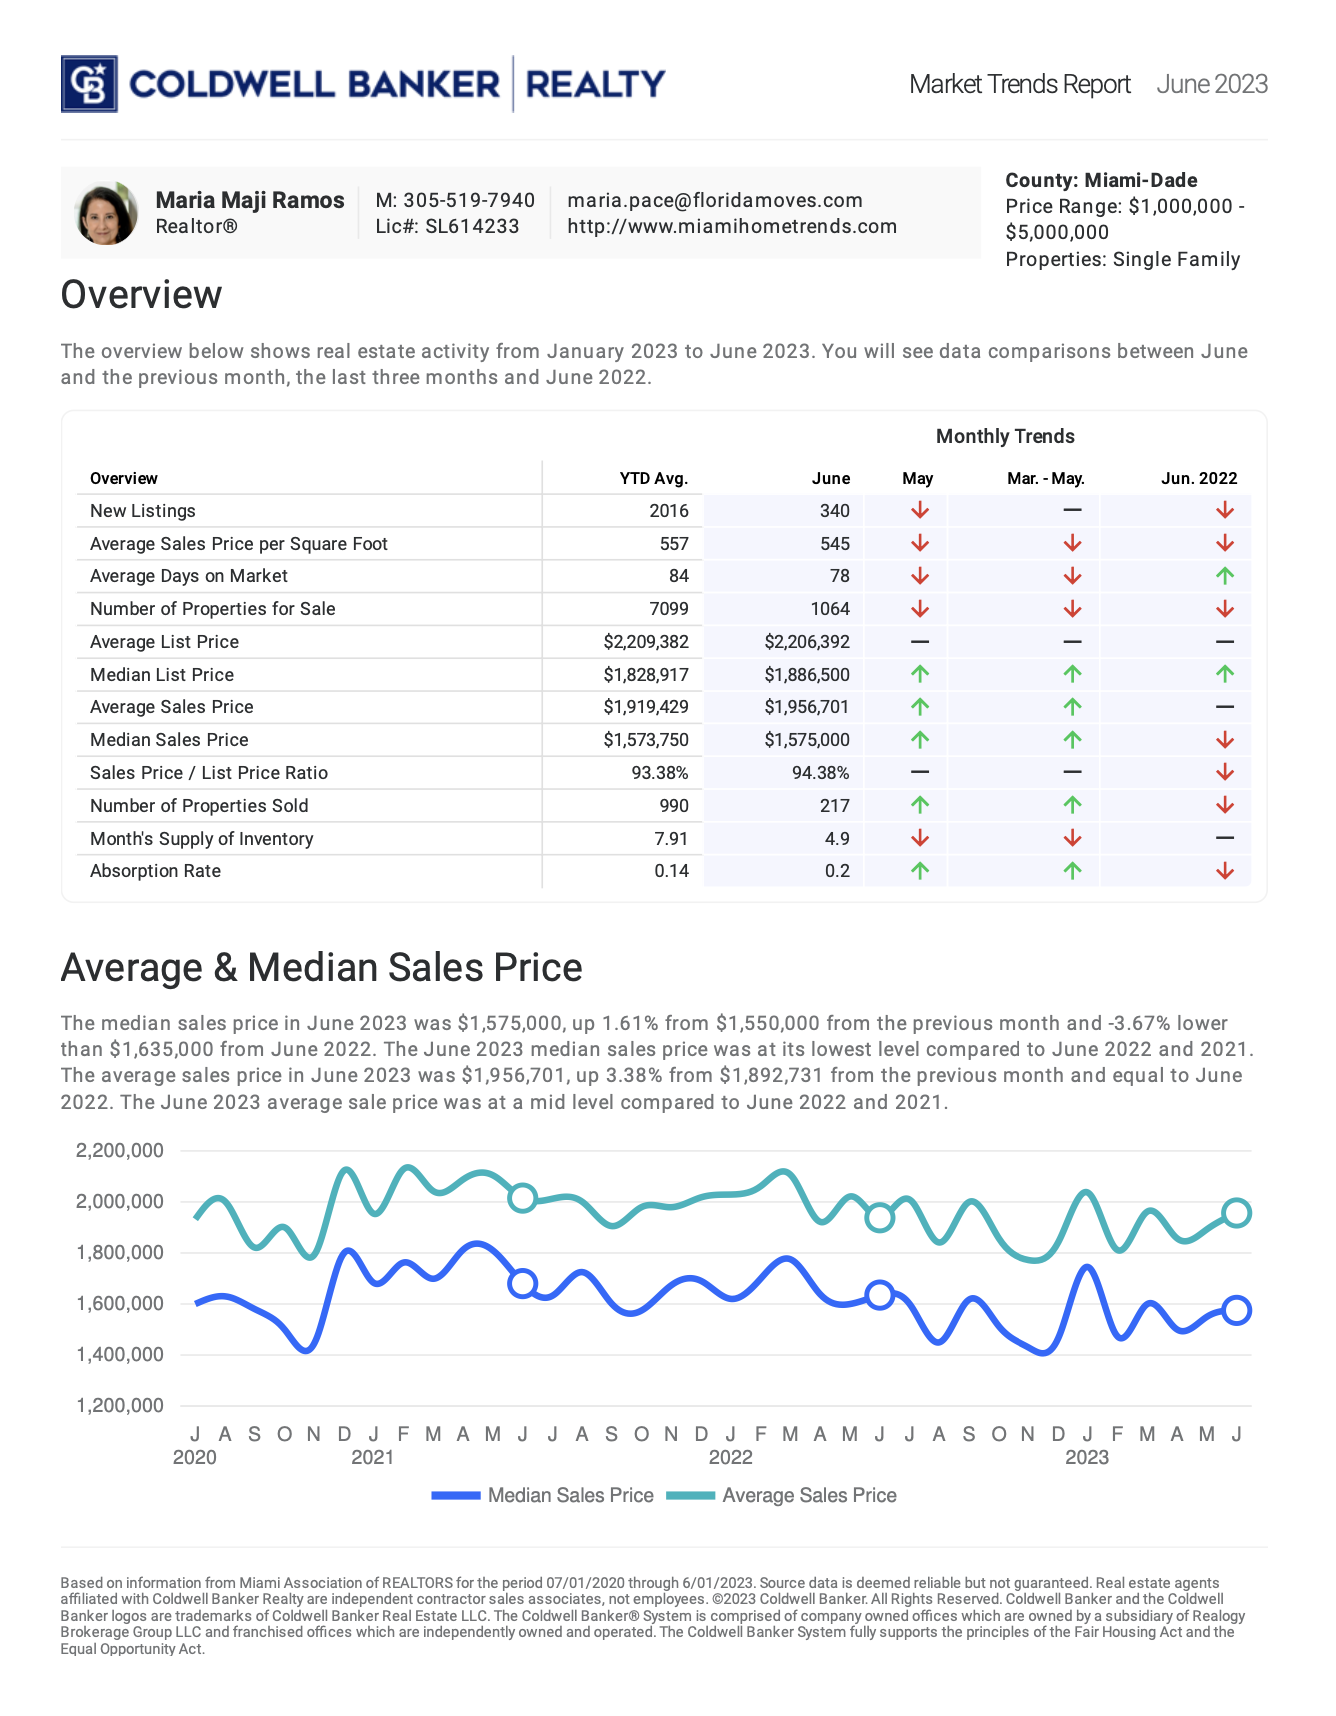
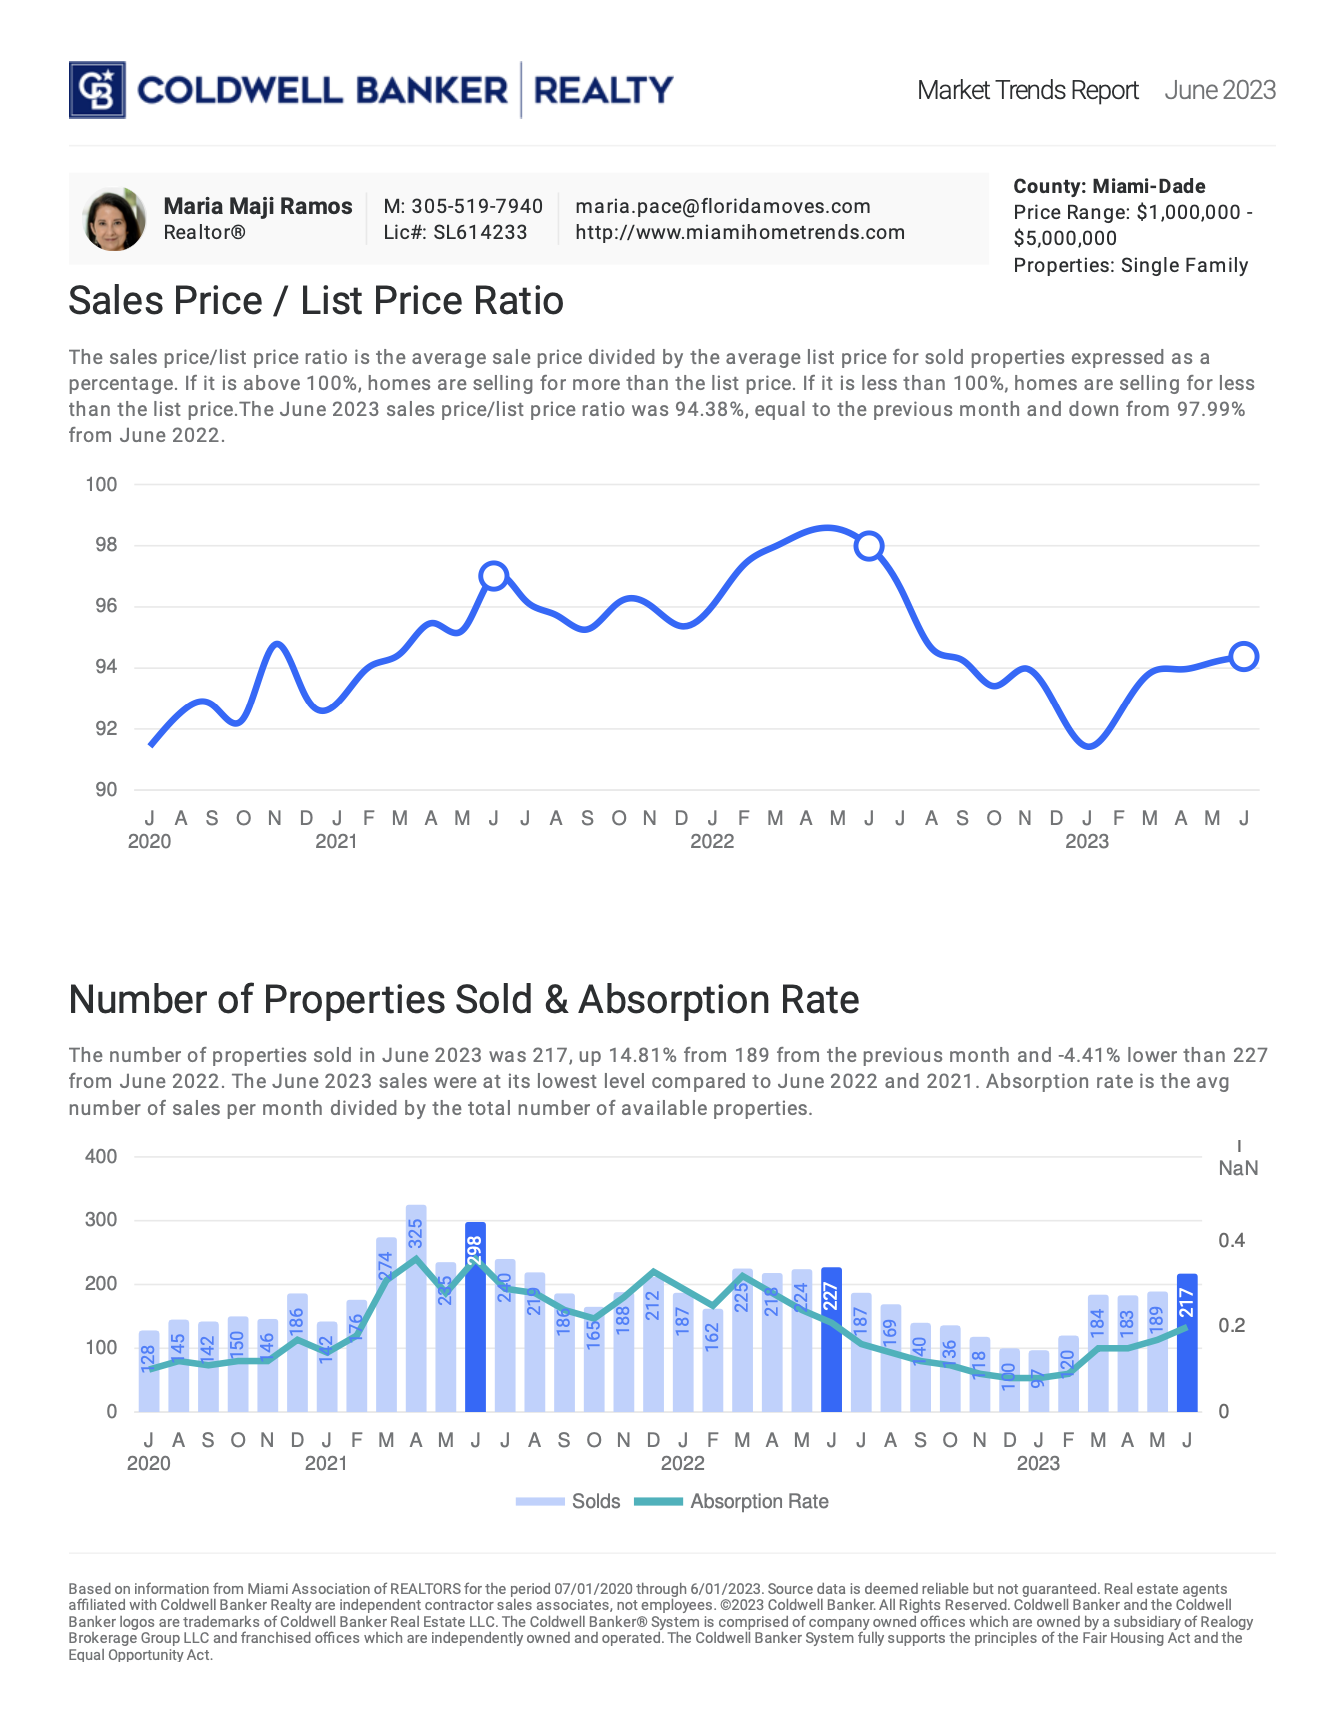
SINGLE FAMILY HOME ⏐ MIAMI-DADE ($1M to $5M)

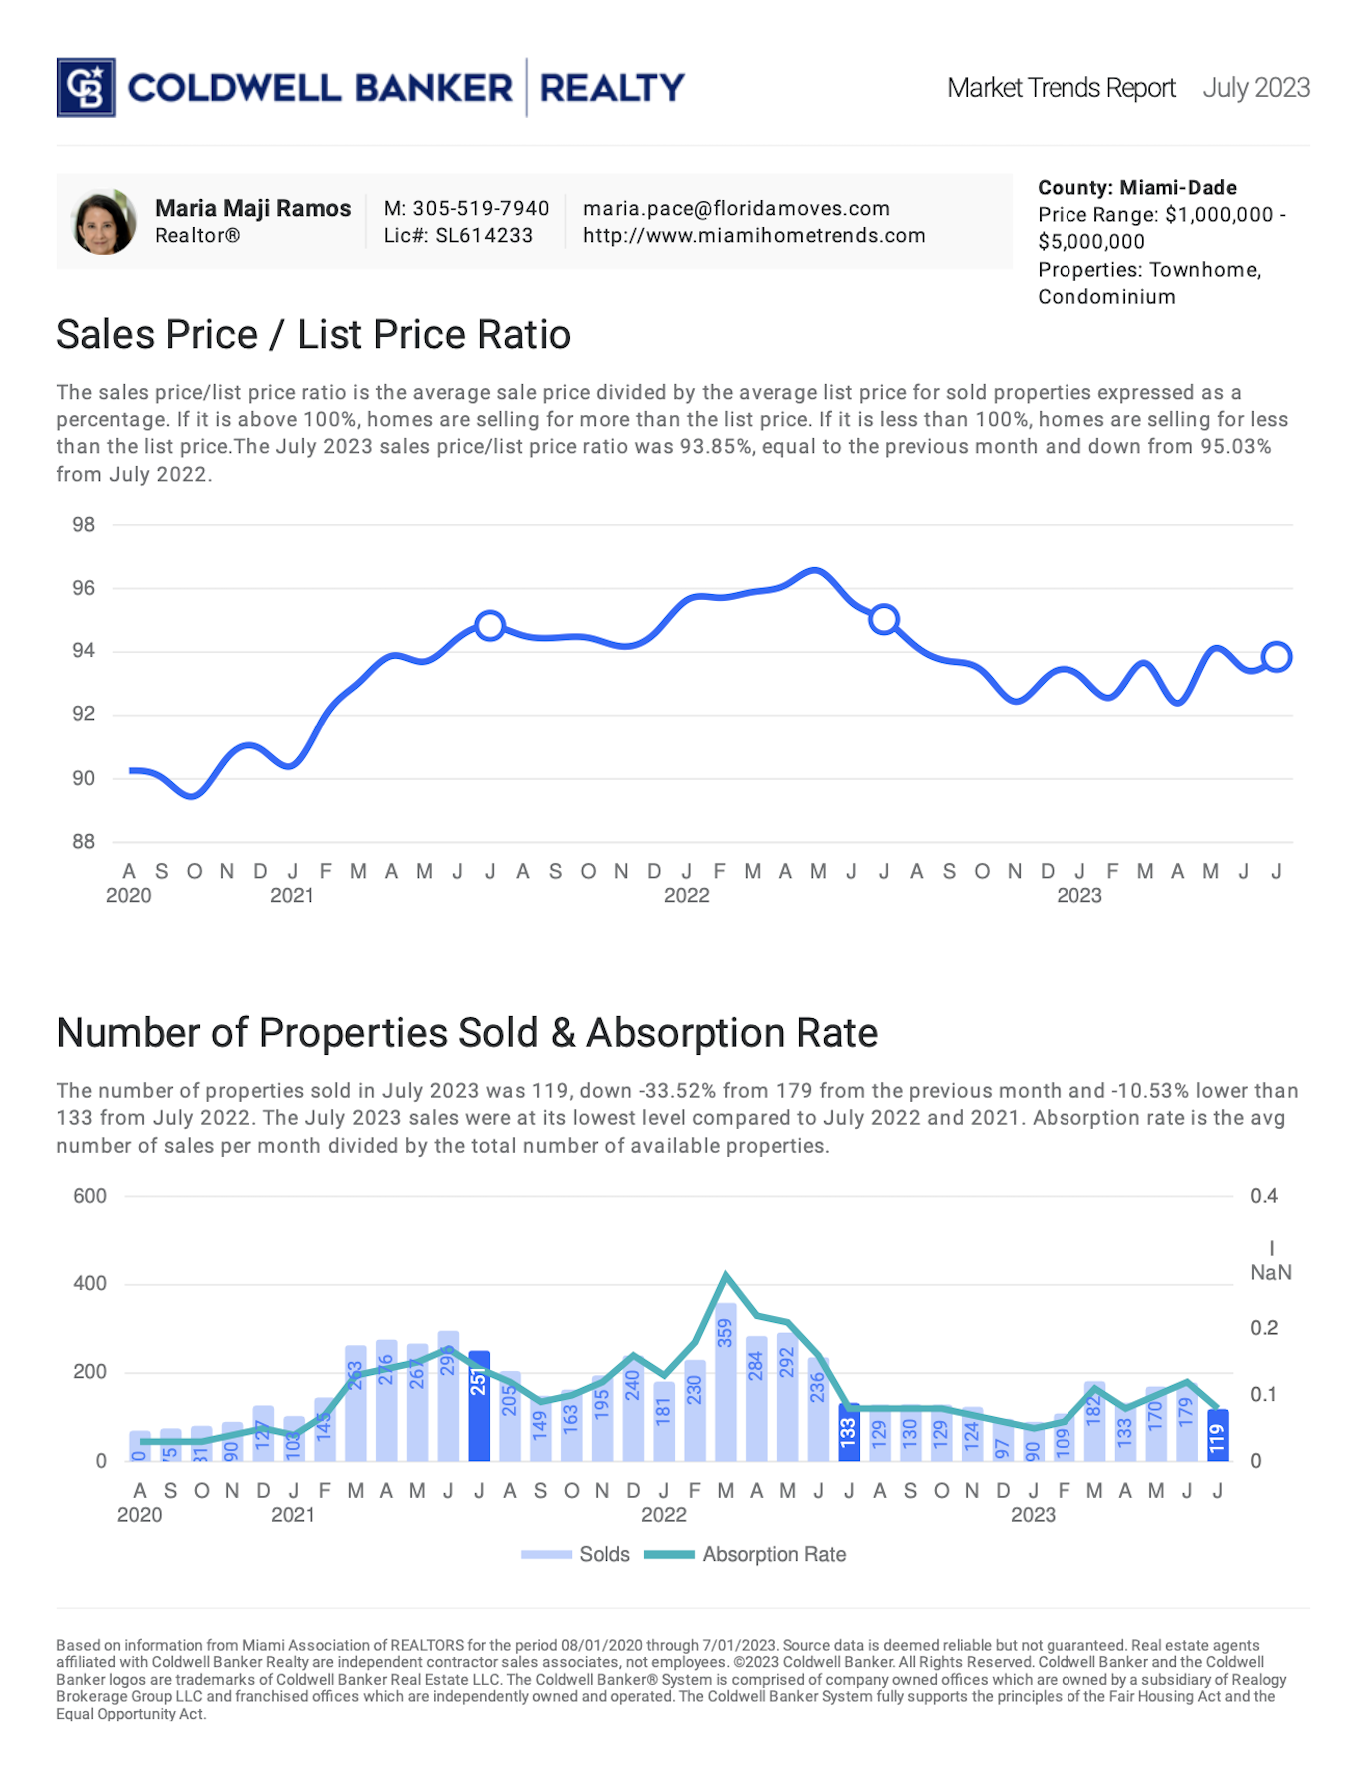
TOWNHOME & CONDO ⏐ MIAMI-DADE ($1M to $5M)

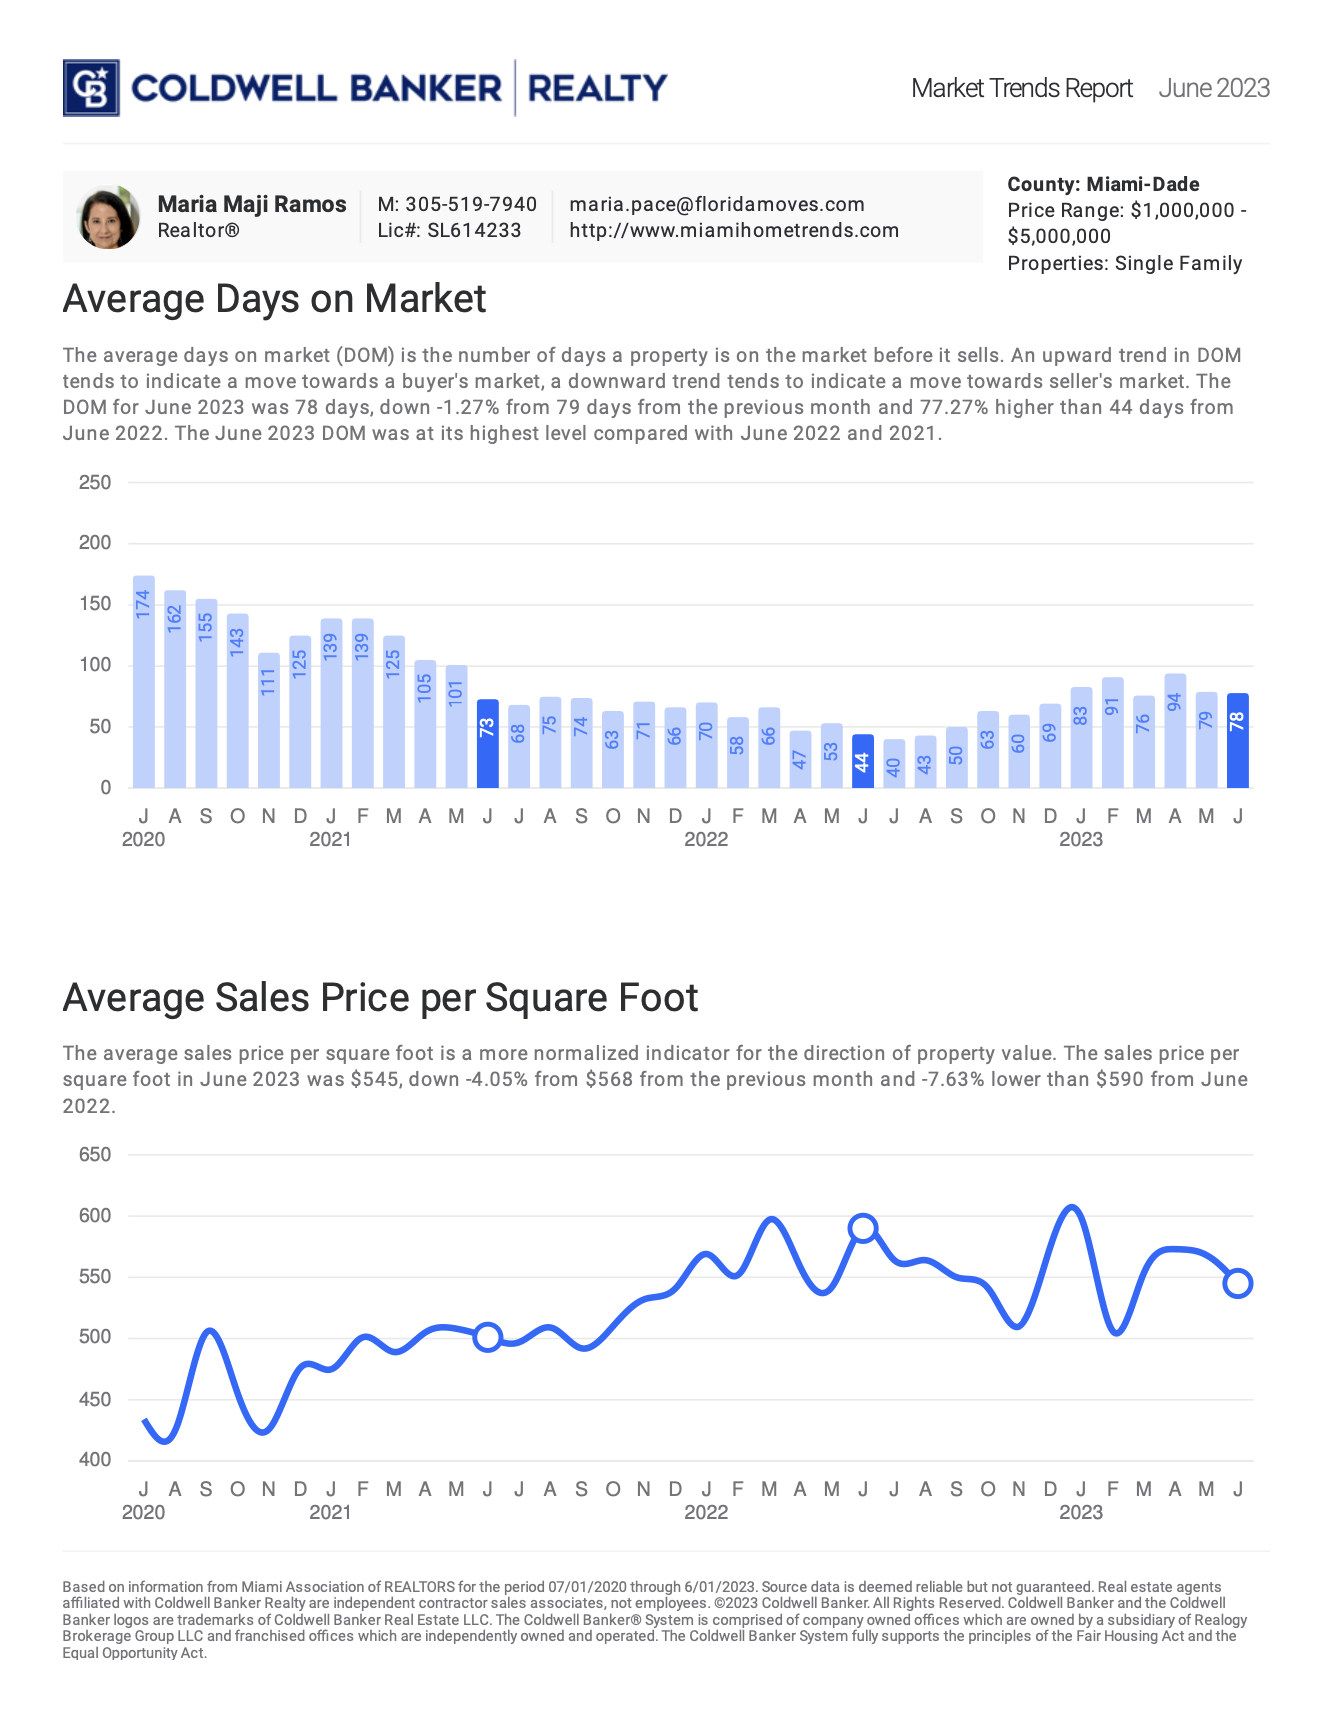
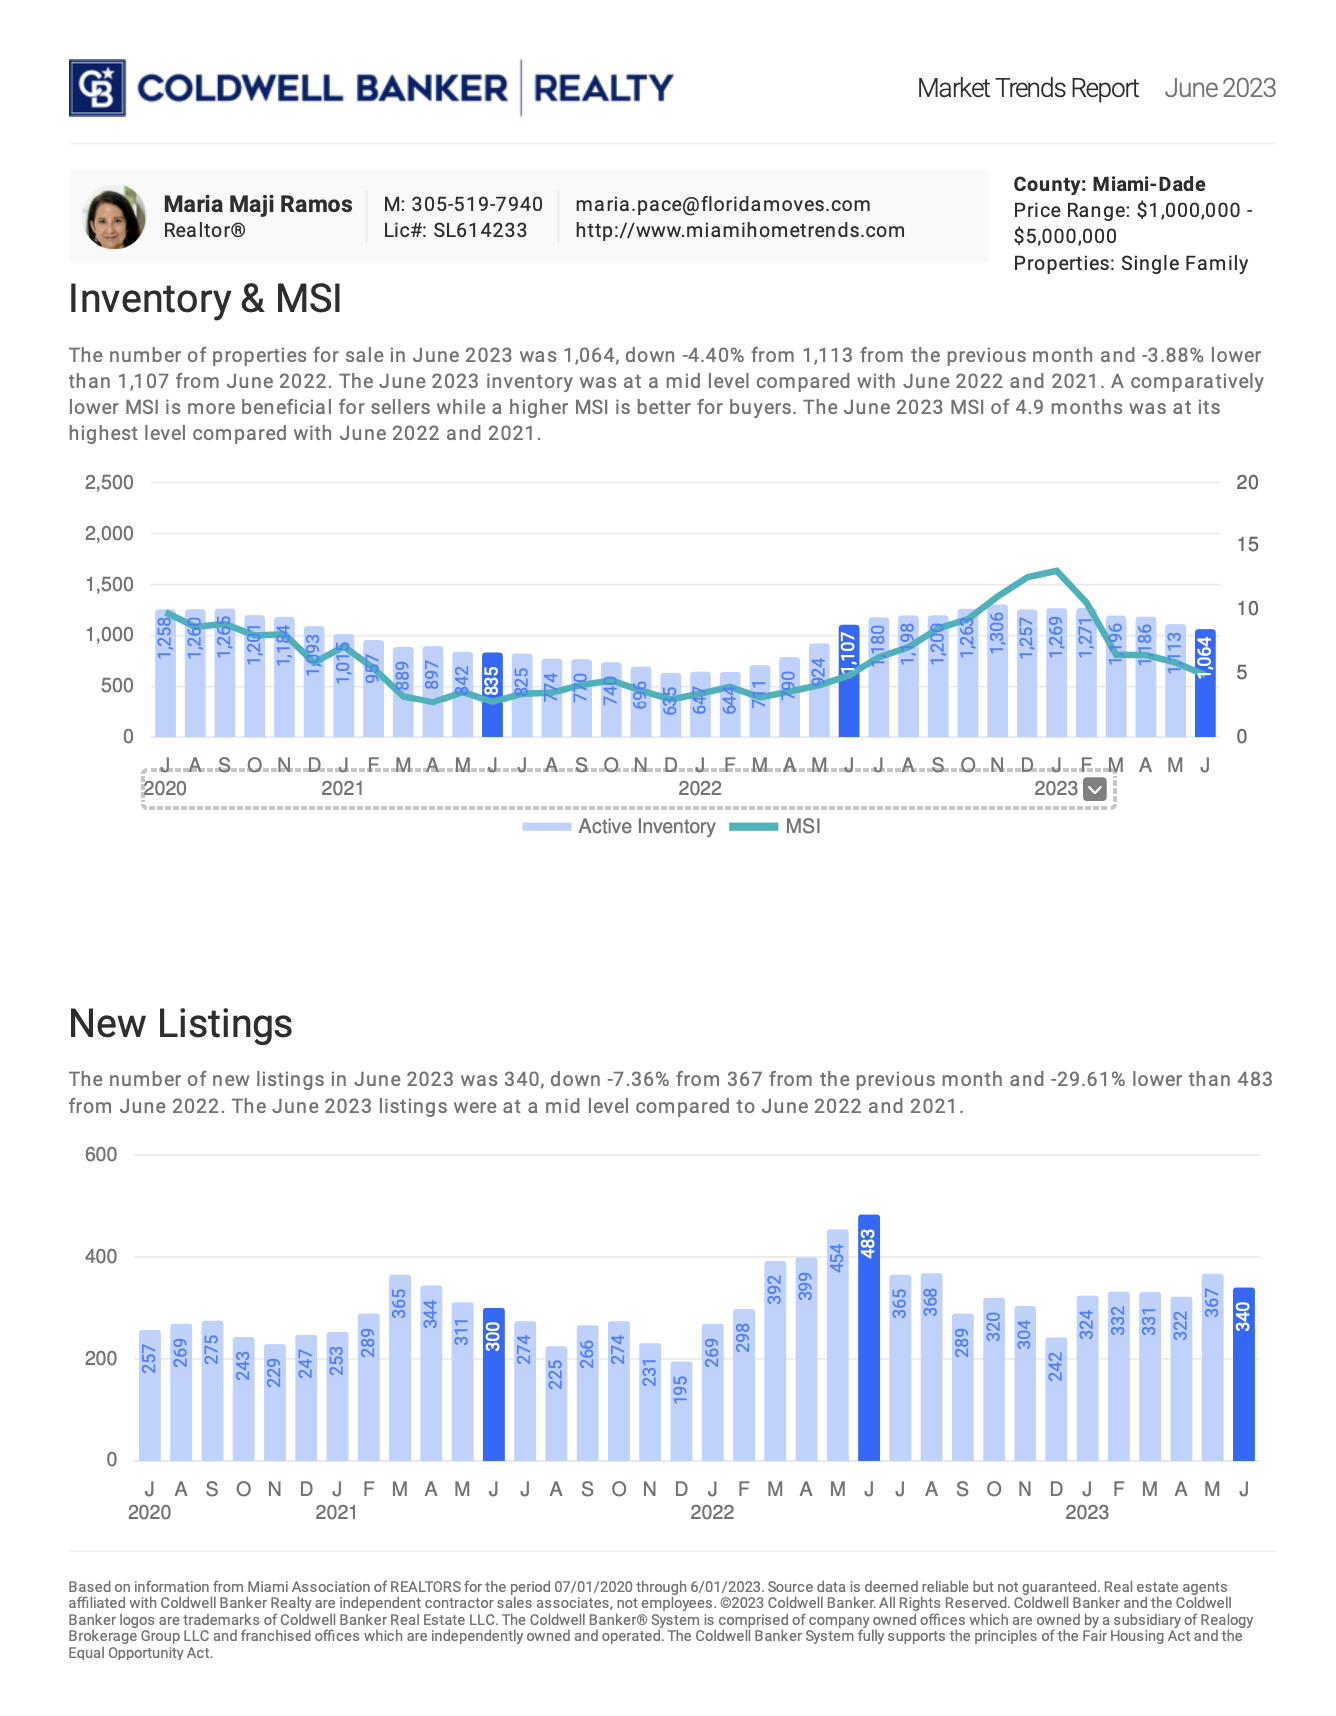
SINGLE FAMILY HOME ⏐ MIAMI-DADE ($1M to $5M)

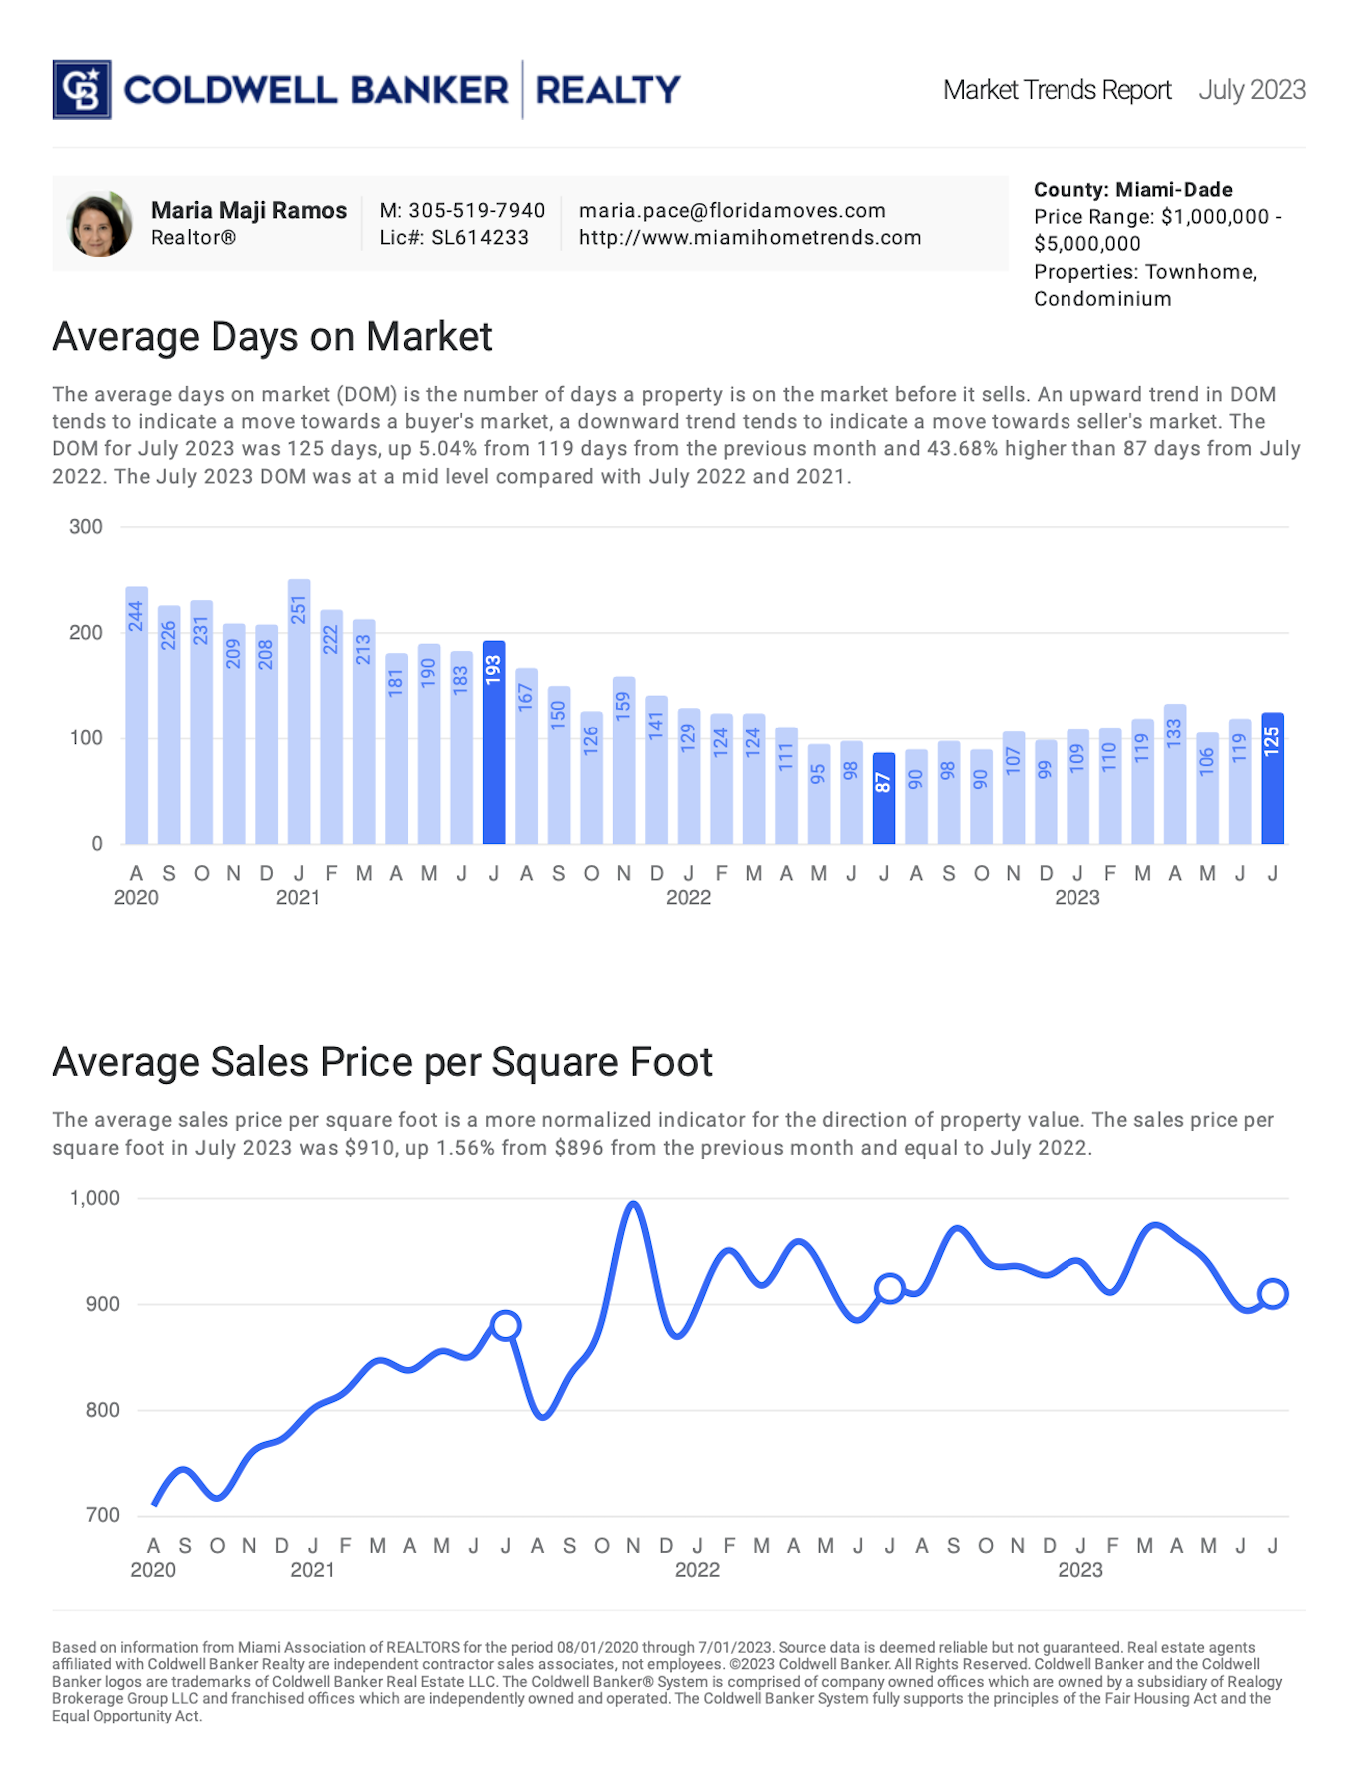
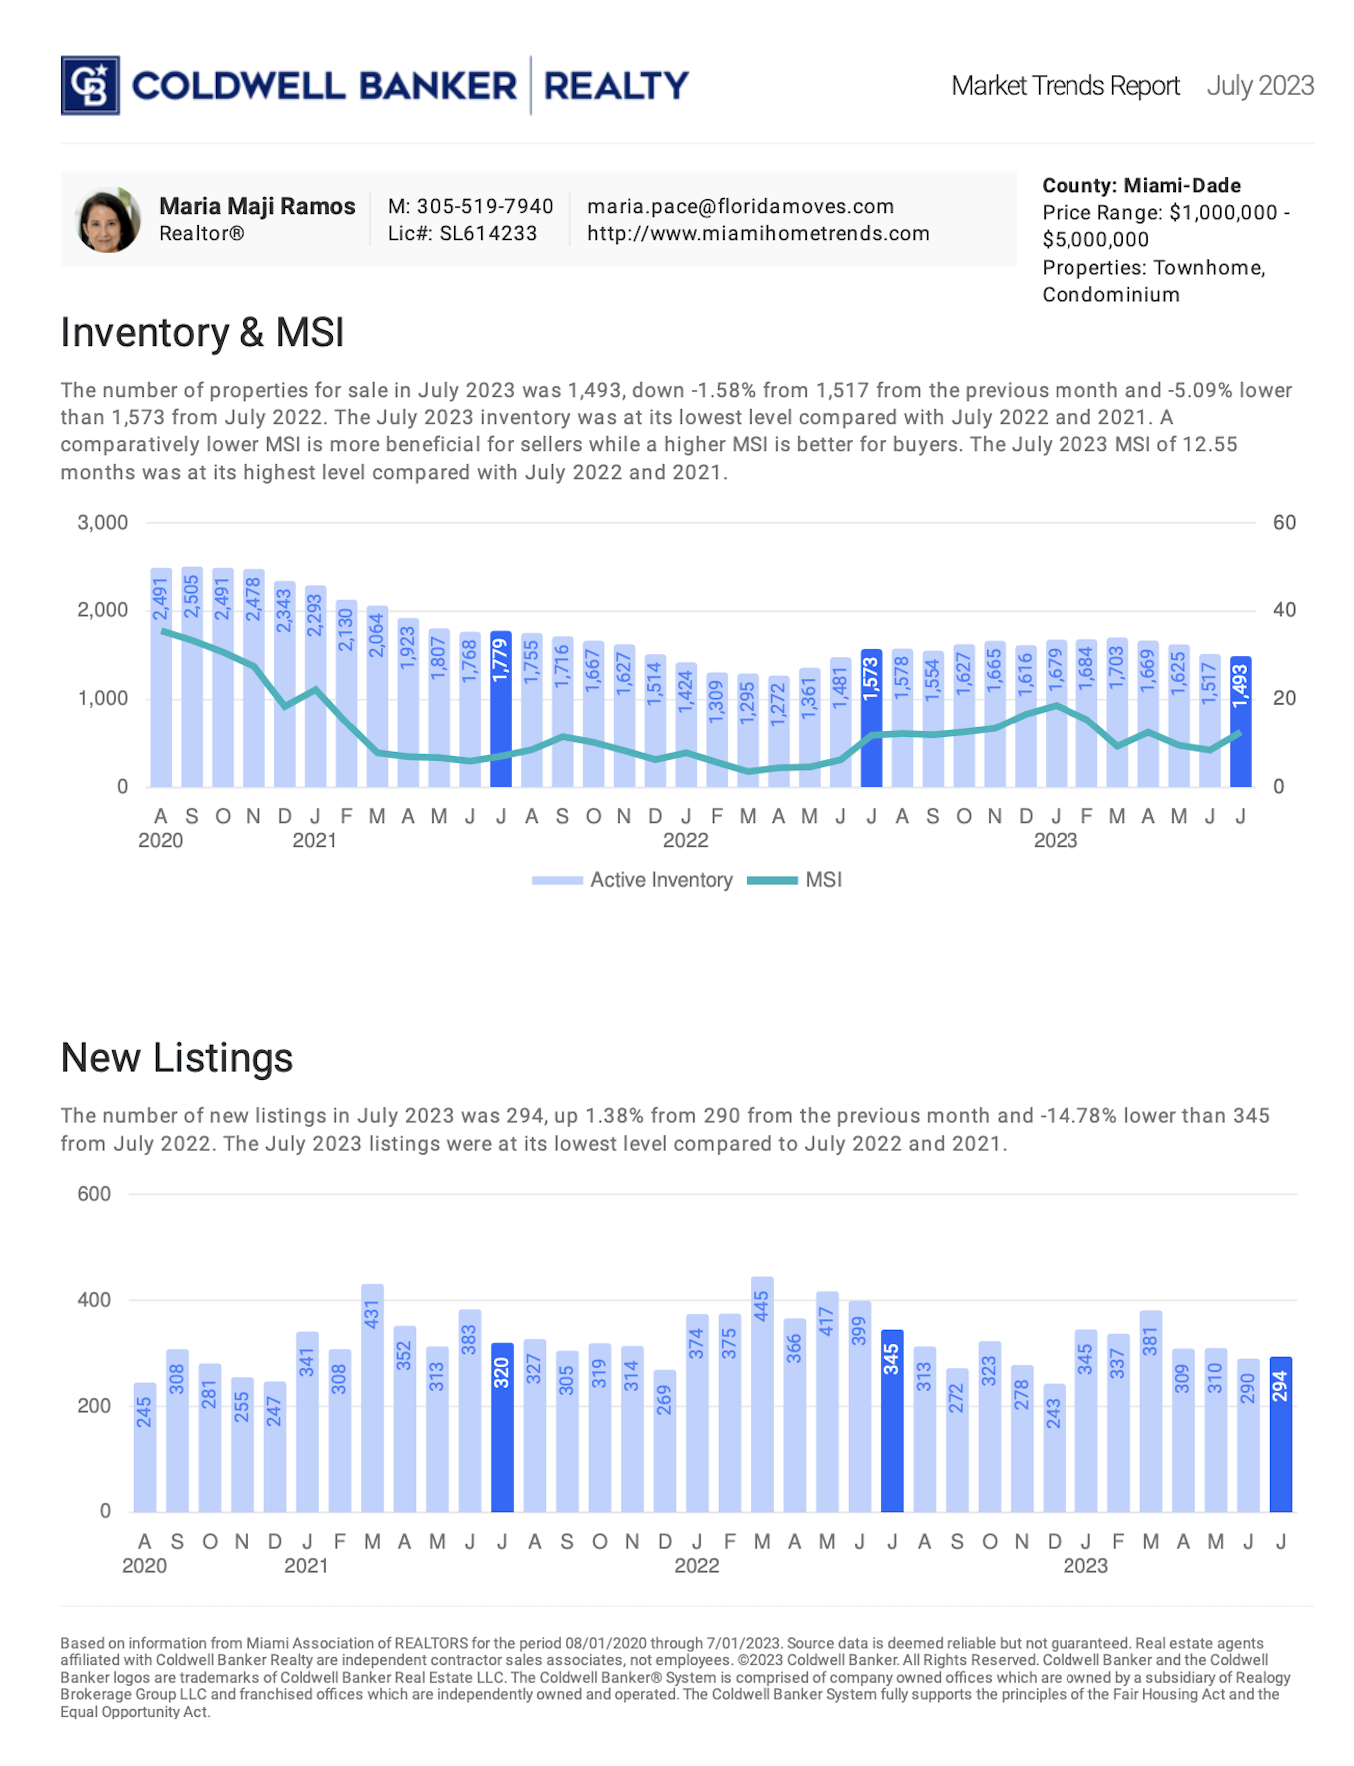
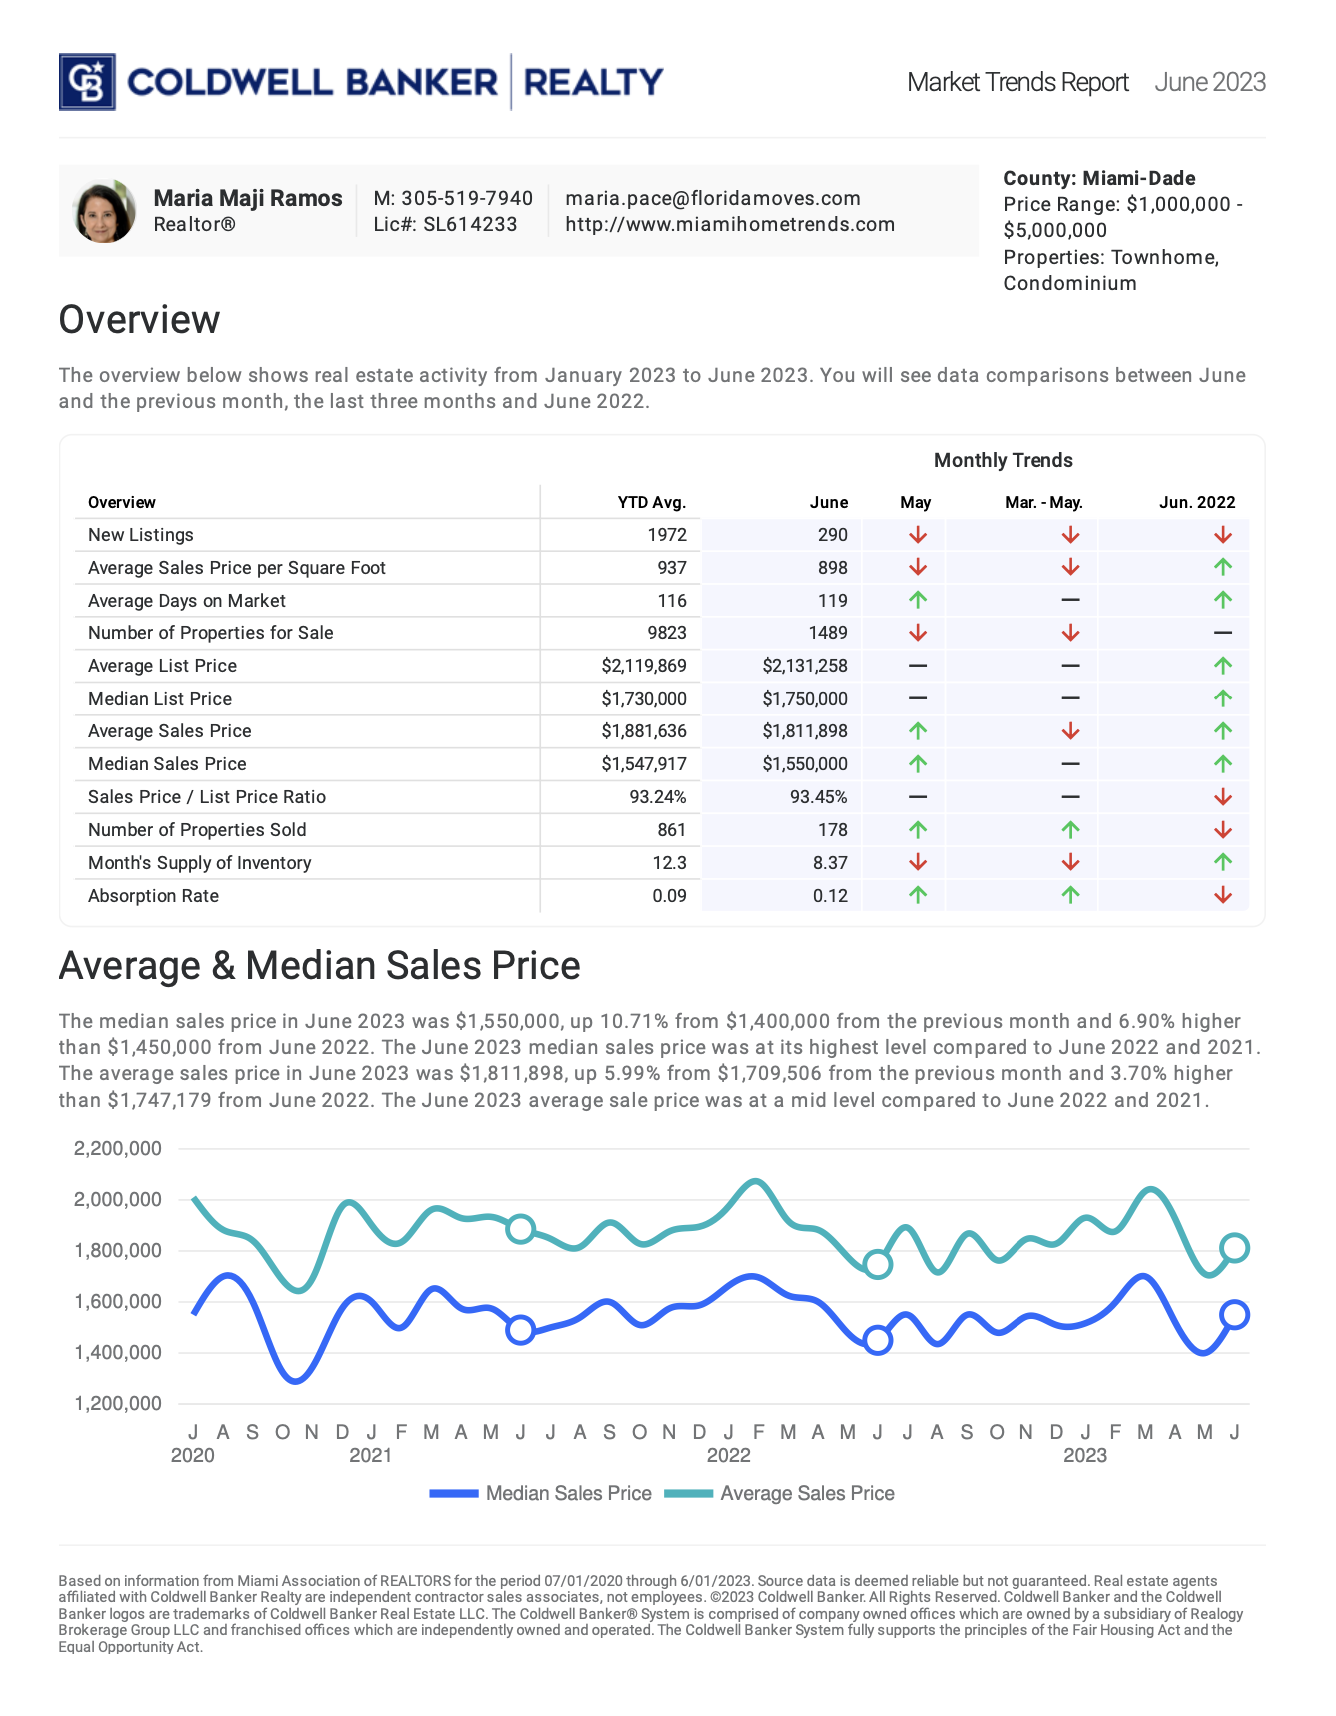
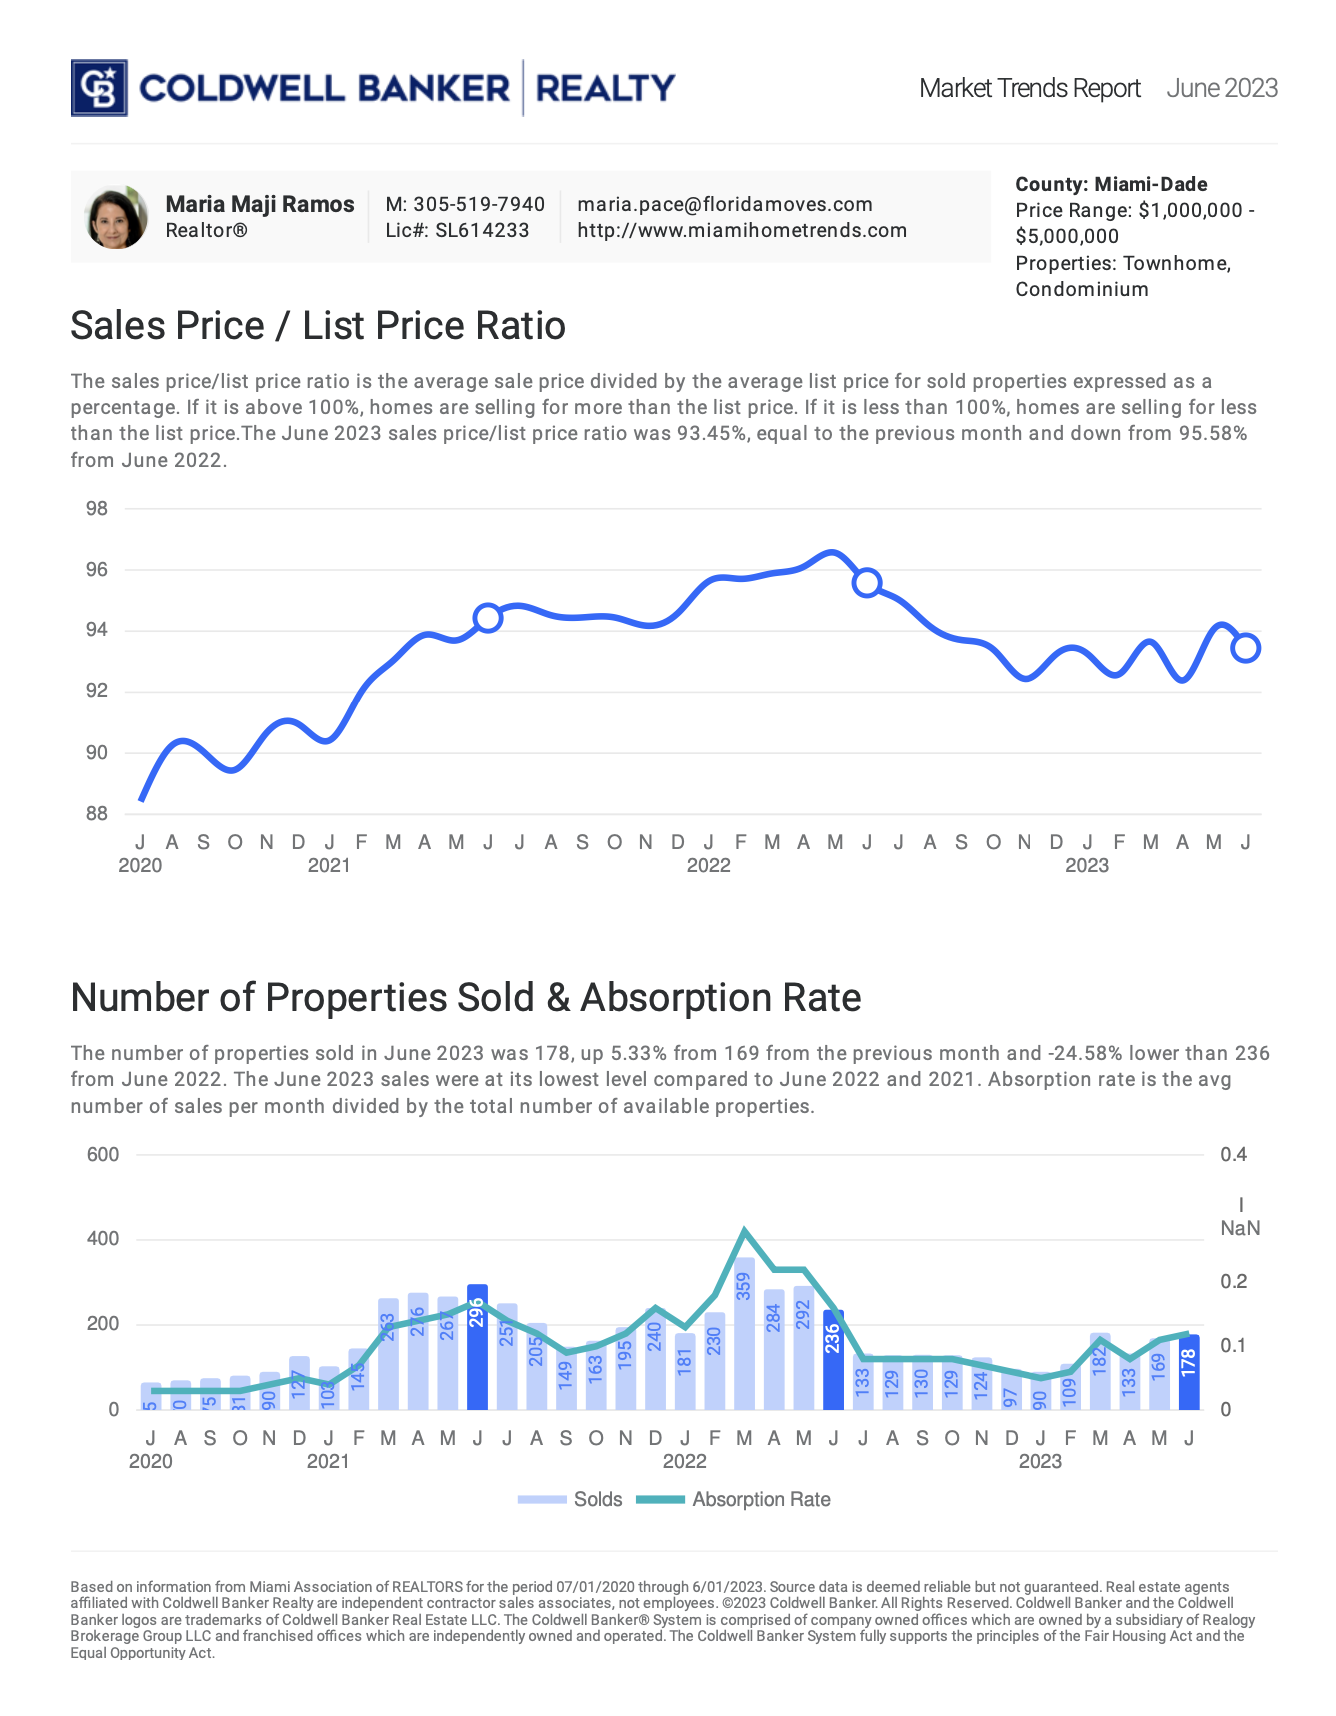
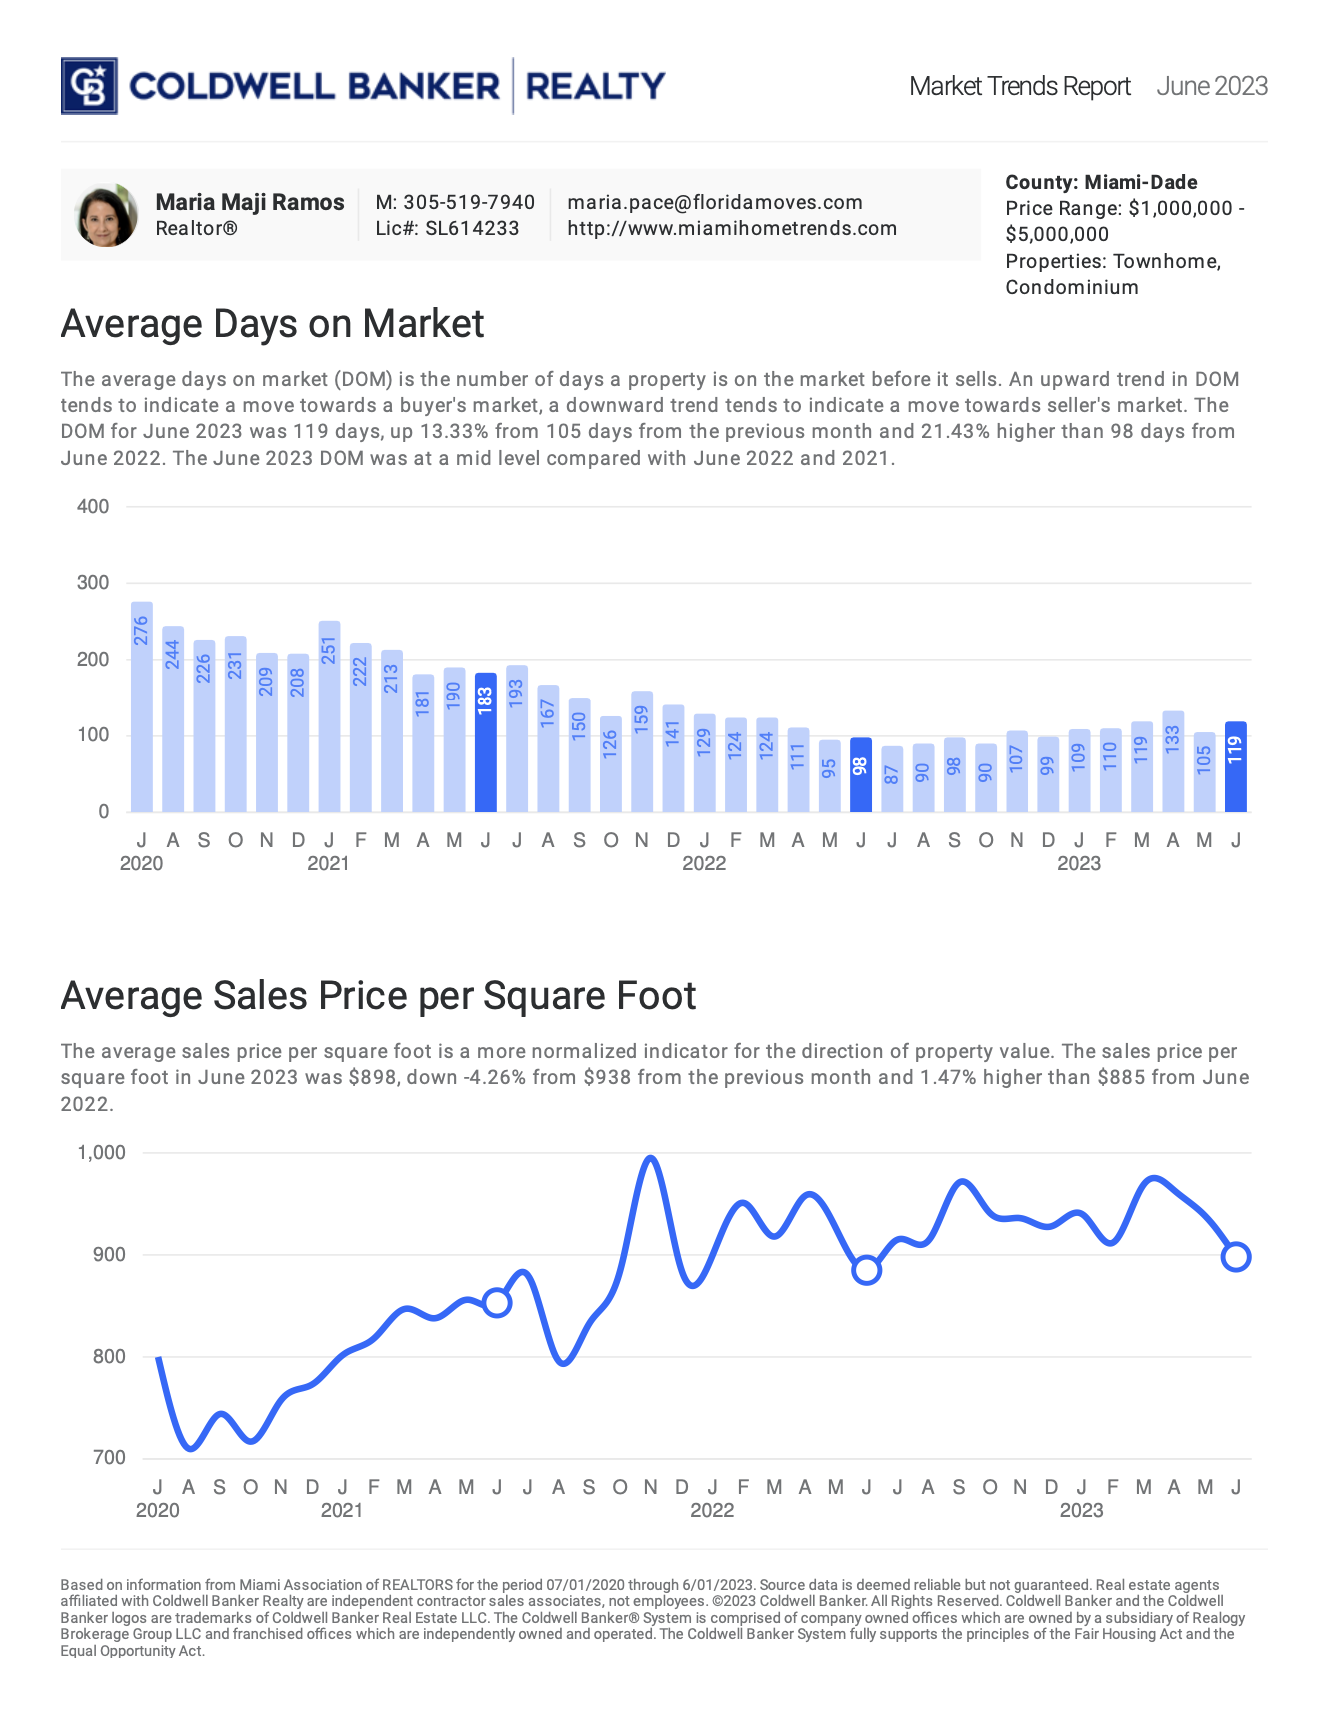
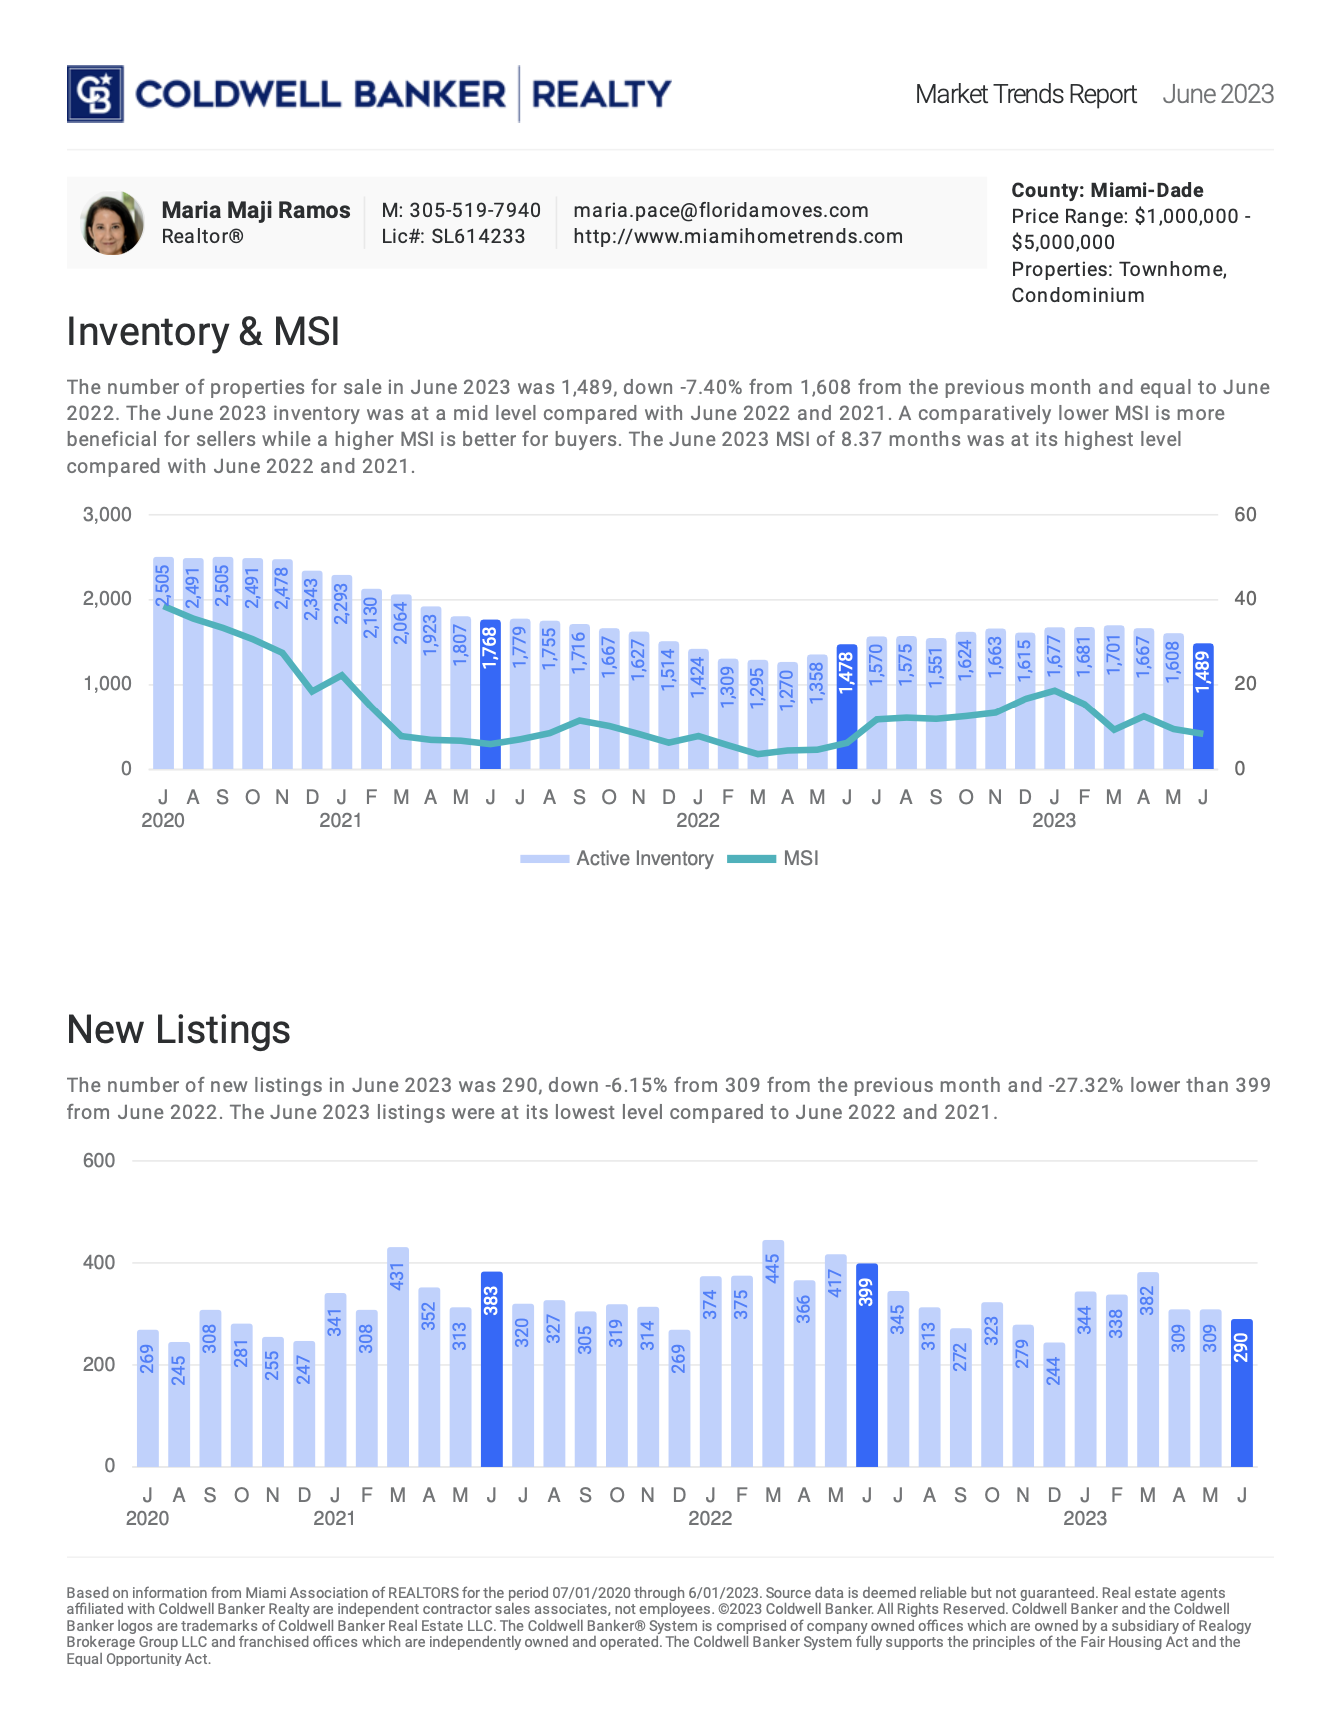
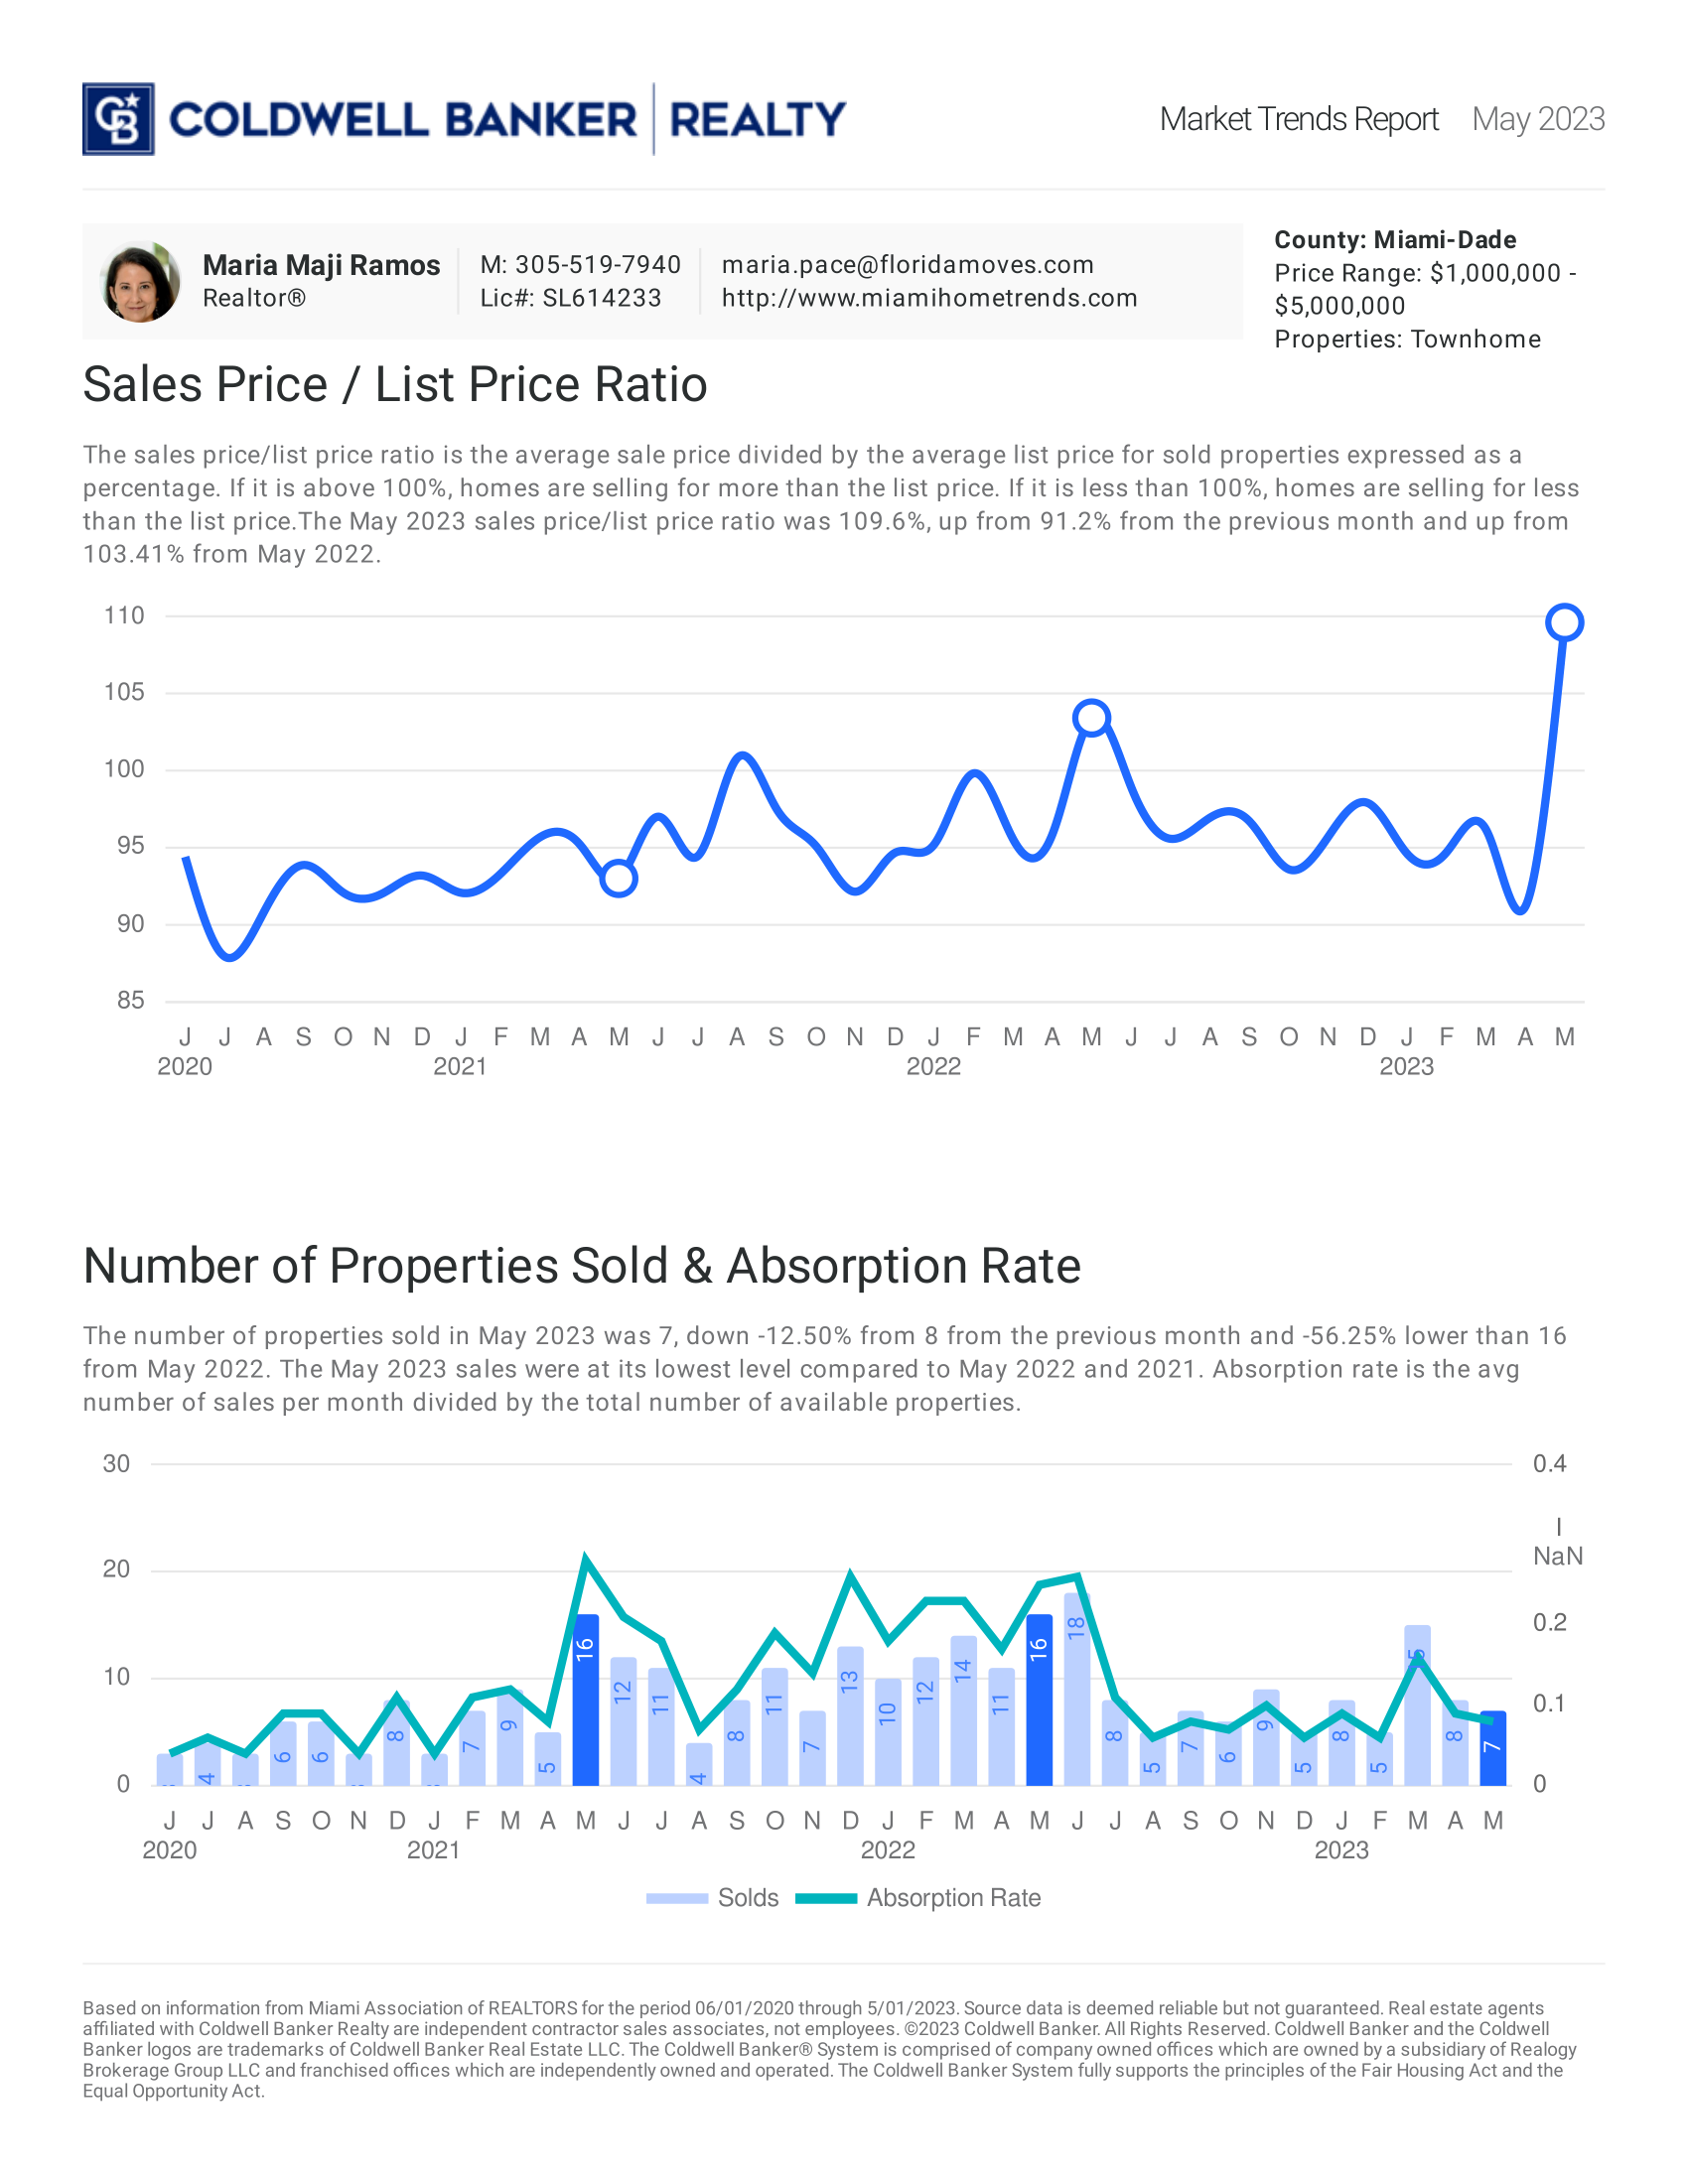
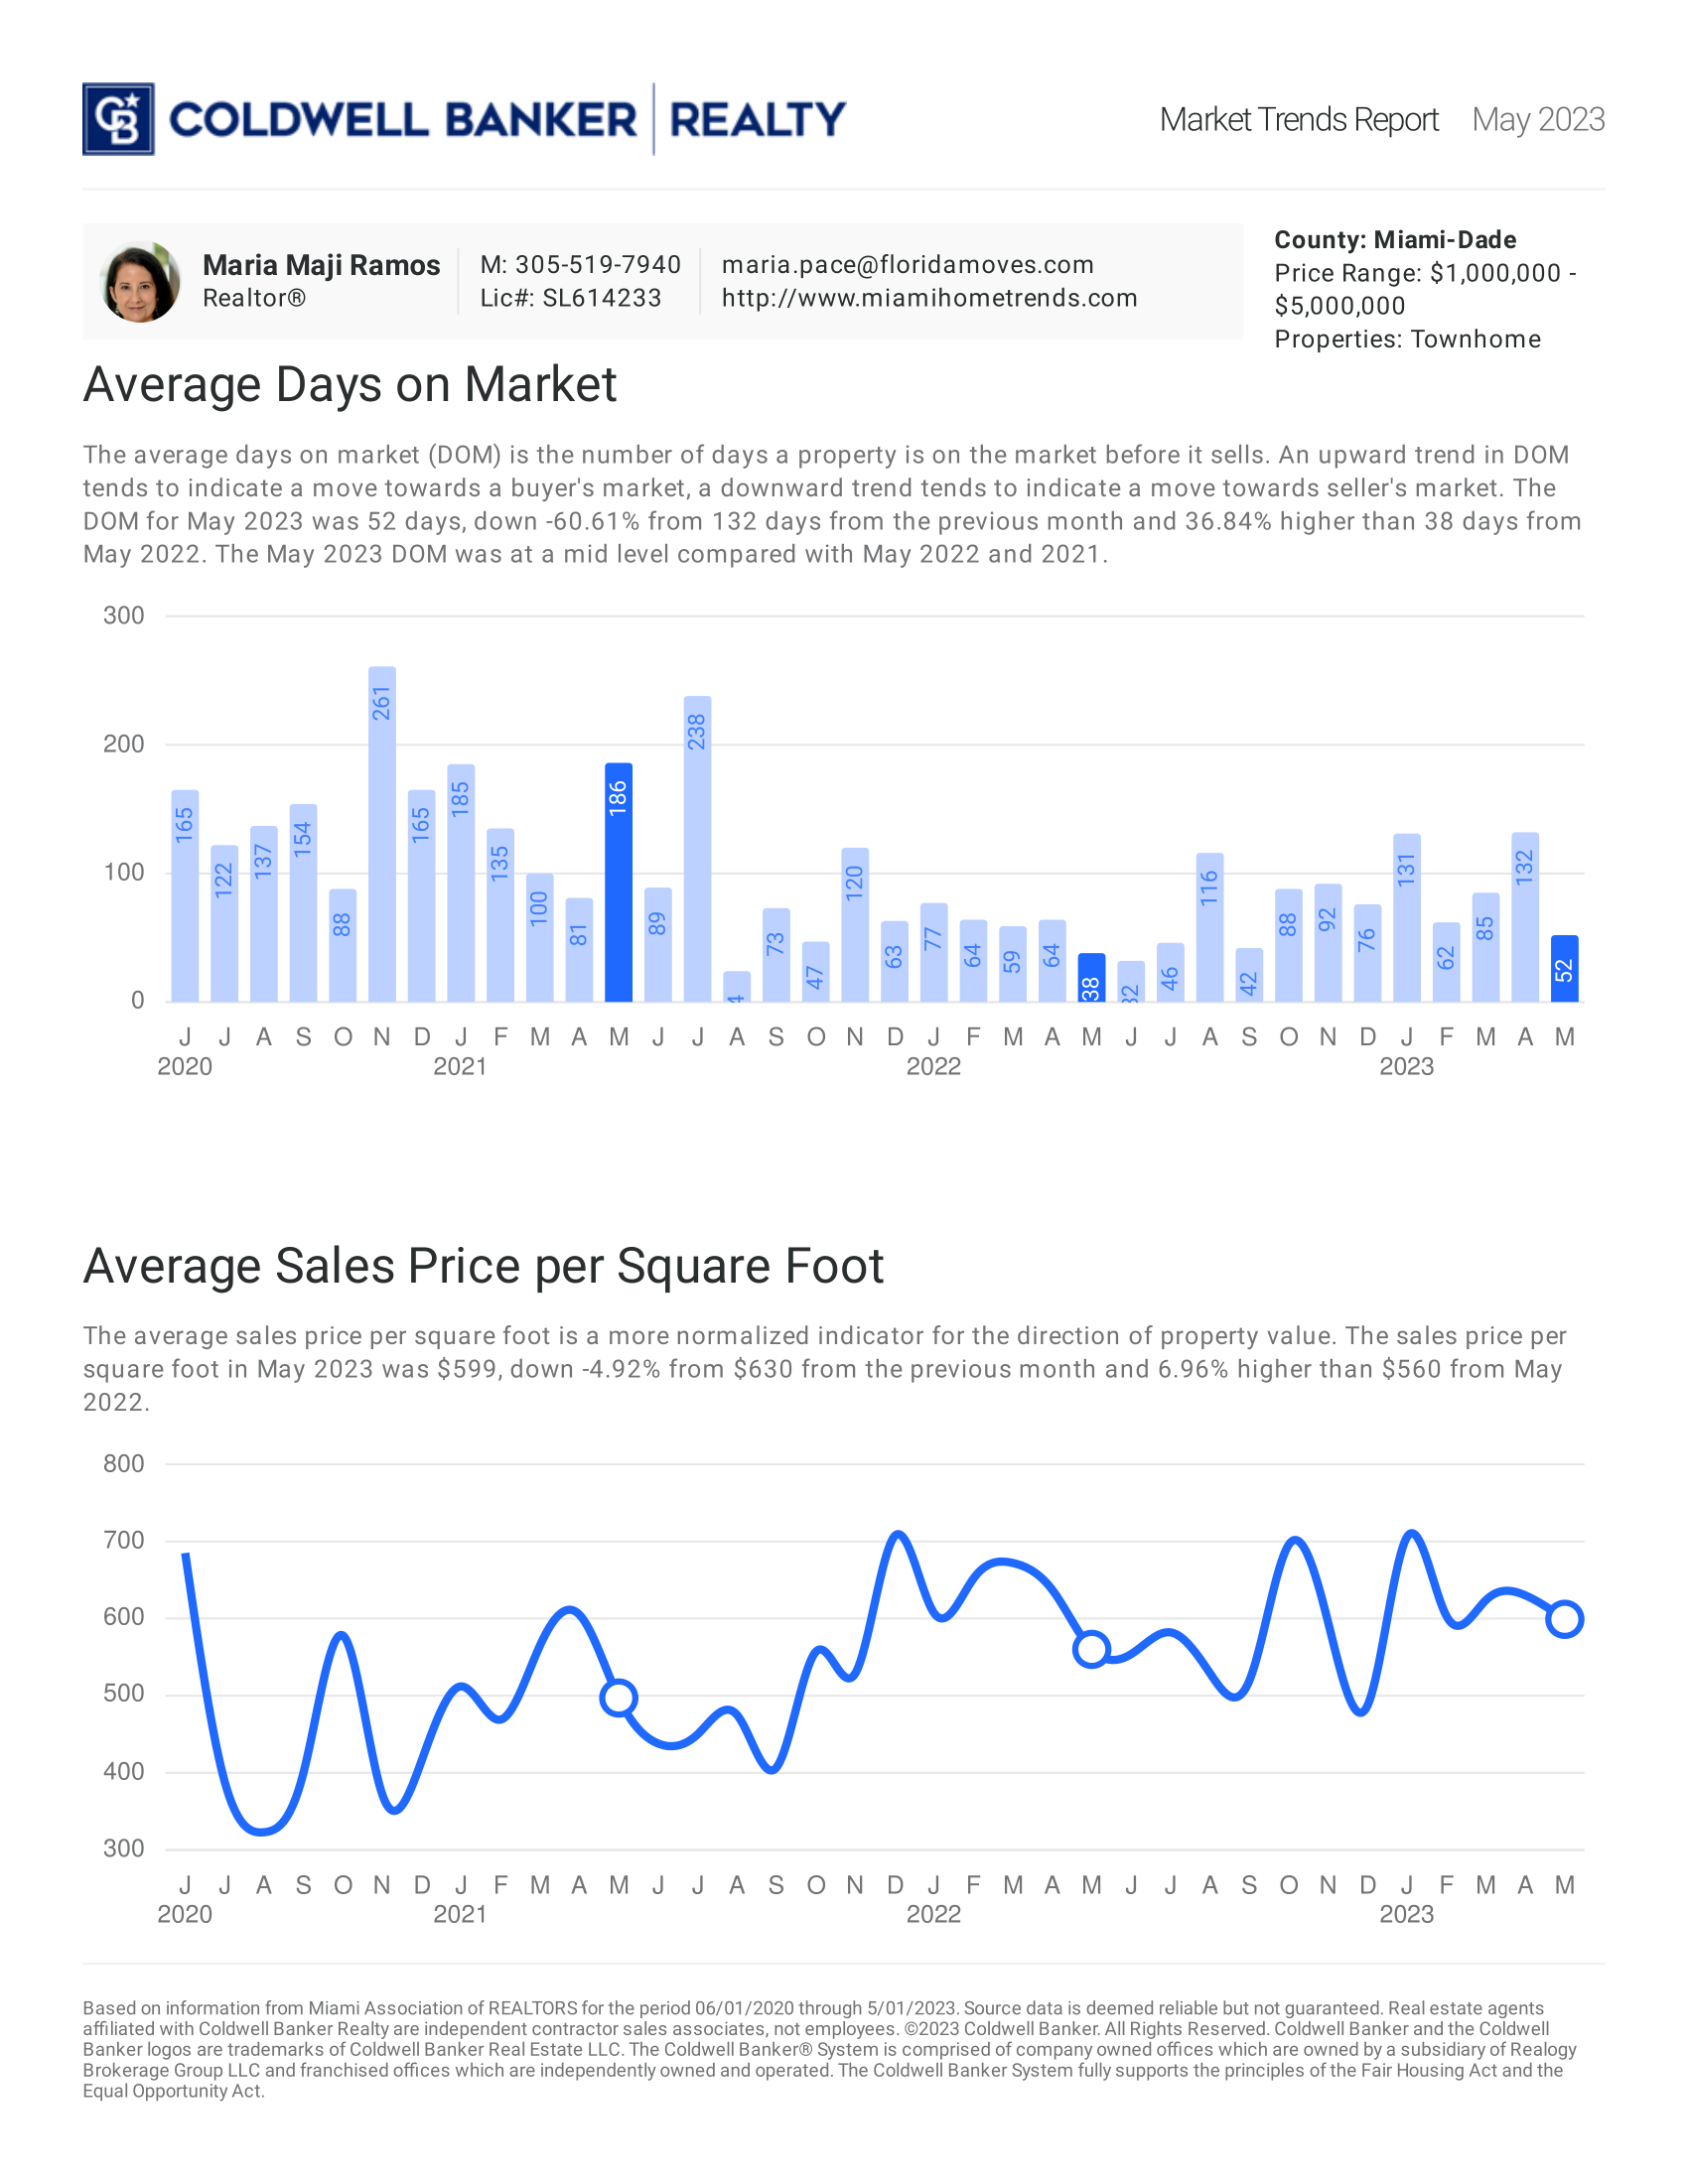
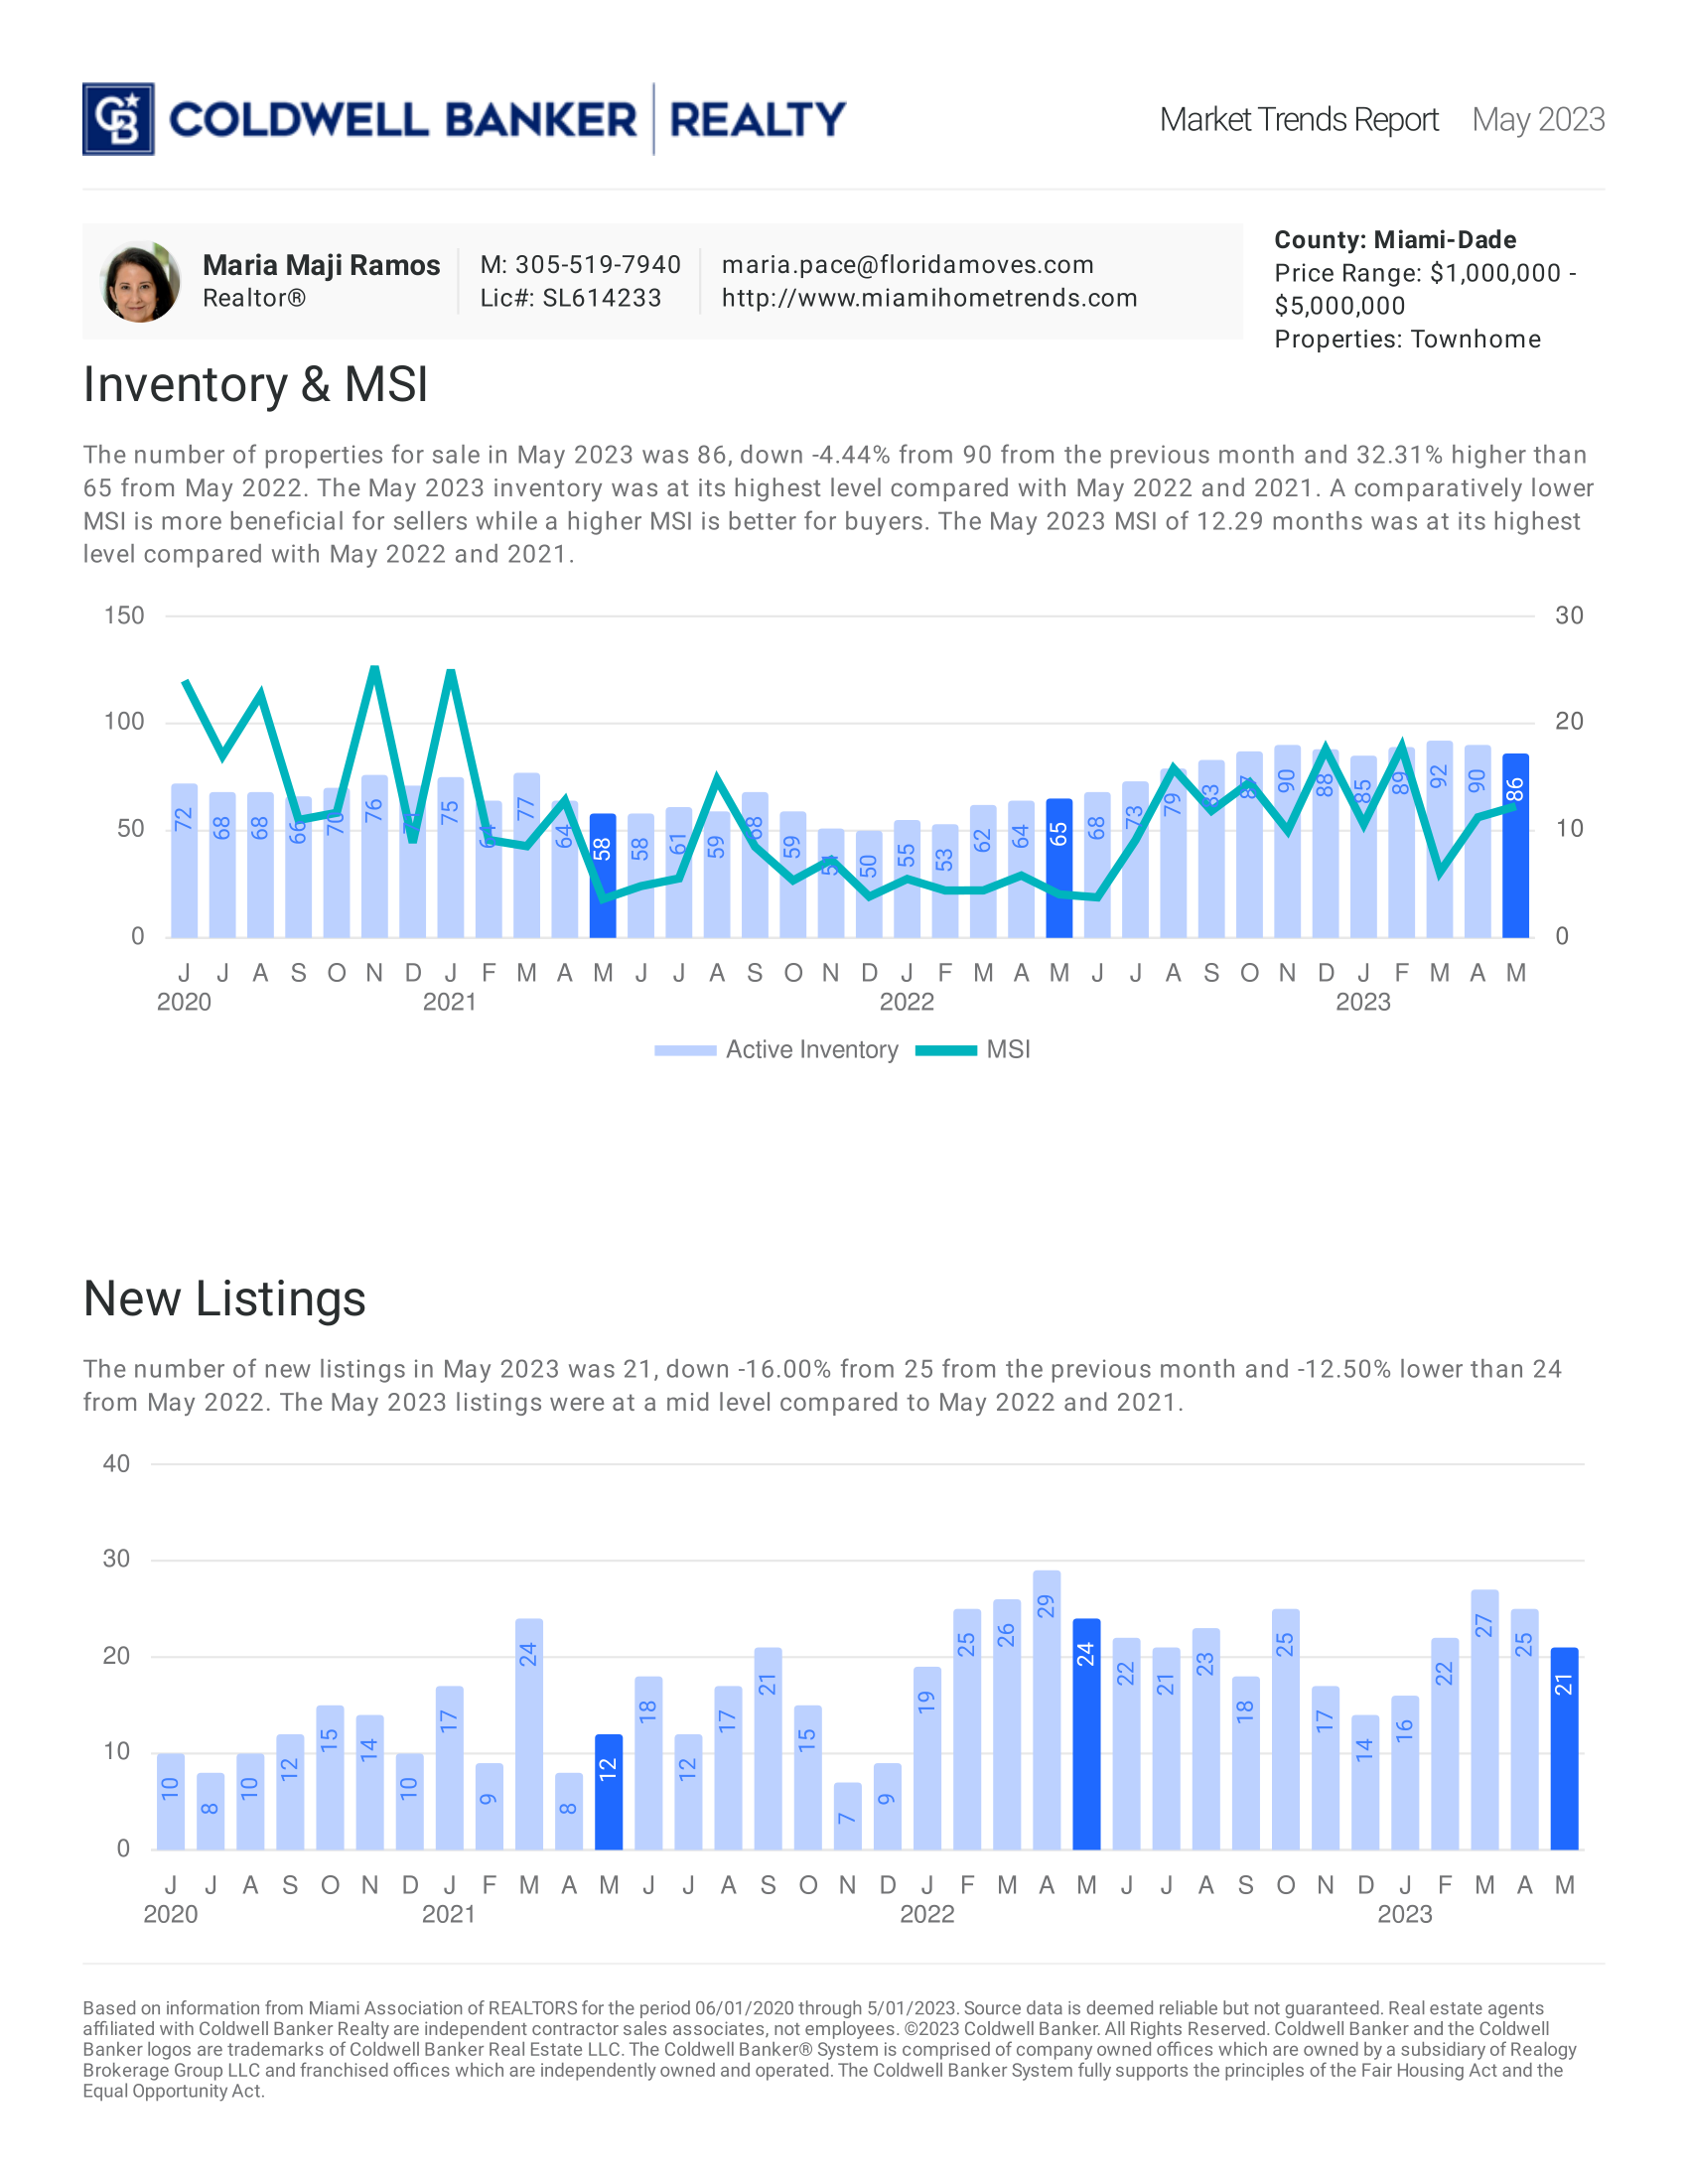
TOWNHOME & CONDO ⏐ MIAMI-DADE ($1M to $5M)

MiamiHomeTrends
Published by Maji Pace Ramos on June 15, 2023

Media coverage about what’s happening with home prices can be confusing. A large part of that is due to the type of data being used and what they’re choosing to draw attention to. For home prices, there are two different methods used to compare home ![]() prices over different time periods: year-over-year (Y-O-Y) and month-over-month (M-O-M). Here’s an explanation of each.
prices over different time periods: year-over-year (Y-O-Y) and month-over-month (M-O-M). Here’s an explanation of each.
Year-over-Year (Y-O-Y): ![]()
This comparison measures the change in home prices from the same month or quarter in the previous year. For example, if you’re comparing Y-O-Y home prices for April 2023, you would compare them to the home prices for April 2022.
This comparison measures the change in home prices from one month to the next. For instance, if you’re comparing M-O-M home prices for April 2023, you would compare them to the home prices for March 2023.
We’re about to enter a few months when home prices could possibly be lower than they were the same month last year. April, May, and June of 2022 were three of the best months for home prices in the history of the American housing market. Those same months this year might not measure up. That means the Y-O-Y comparison will probably show values are depreciating. The numbers for April seem to suggest that’s what we’ll see in the months ahead (see graph below):

However, on a closer look at M-O-M home prices, we can see prices have actually been appreciating for the last several months. Those M-O-M numbers more accurately reflect what’s truly happening with home values: after several months of depreciation, it appears we’ve hit bottom and is bouncing back.
Here’s an example of M-O-M home price movements for the last 16 months from the CoreLogic Home Price Insights report (see graph below):
So, if you’re hearing negative headlines about home prices, remember they may not be painting the full picture. For the next few months, we’ll be comparing prices to last year’s record peak, and that may make the Y-O-Y comparison feel more negative. But, if we look at the more immediate, M-O-M trends, we can see home prices are actually on the way back up.There’s an advantage to buying a home now. You’ll buy at a discount from last year’s price before prices start to pick up even more momentum. It’s called “buying at the bottom,” and that’s a good thing.Bottom Line
If you have questions about what’s happening with home prices, or if you’re ready to buy before prices climb higher, let’s connect.


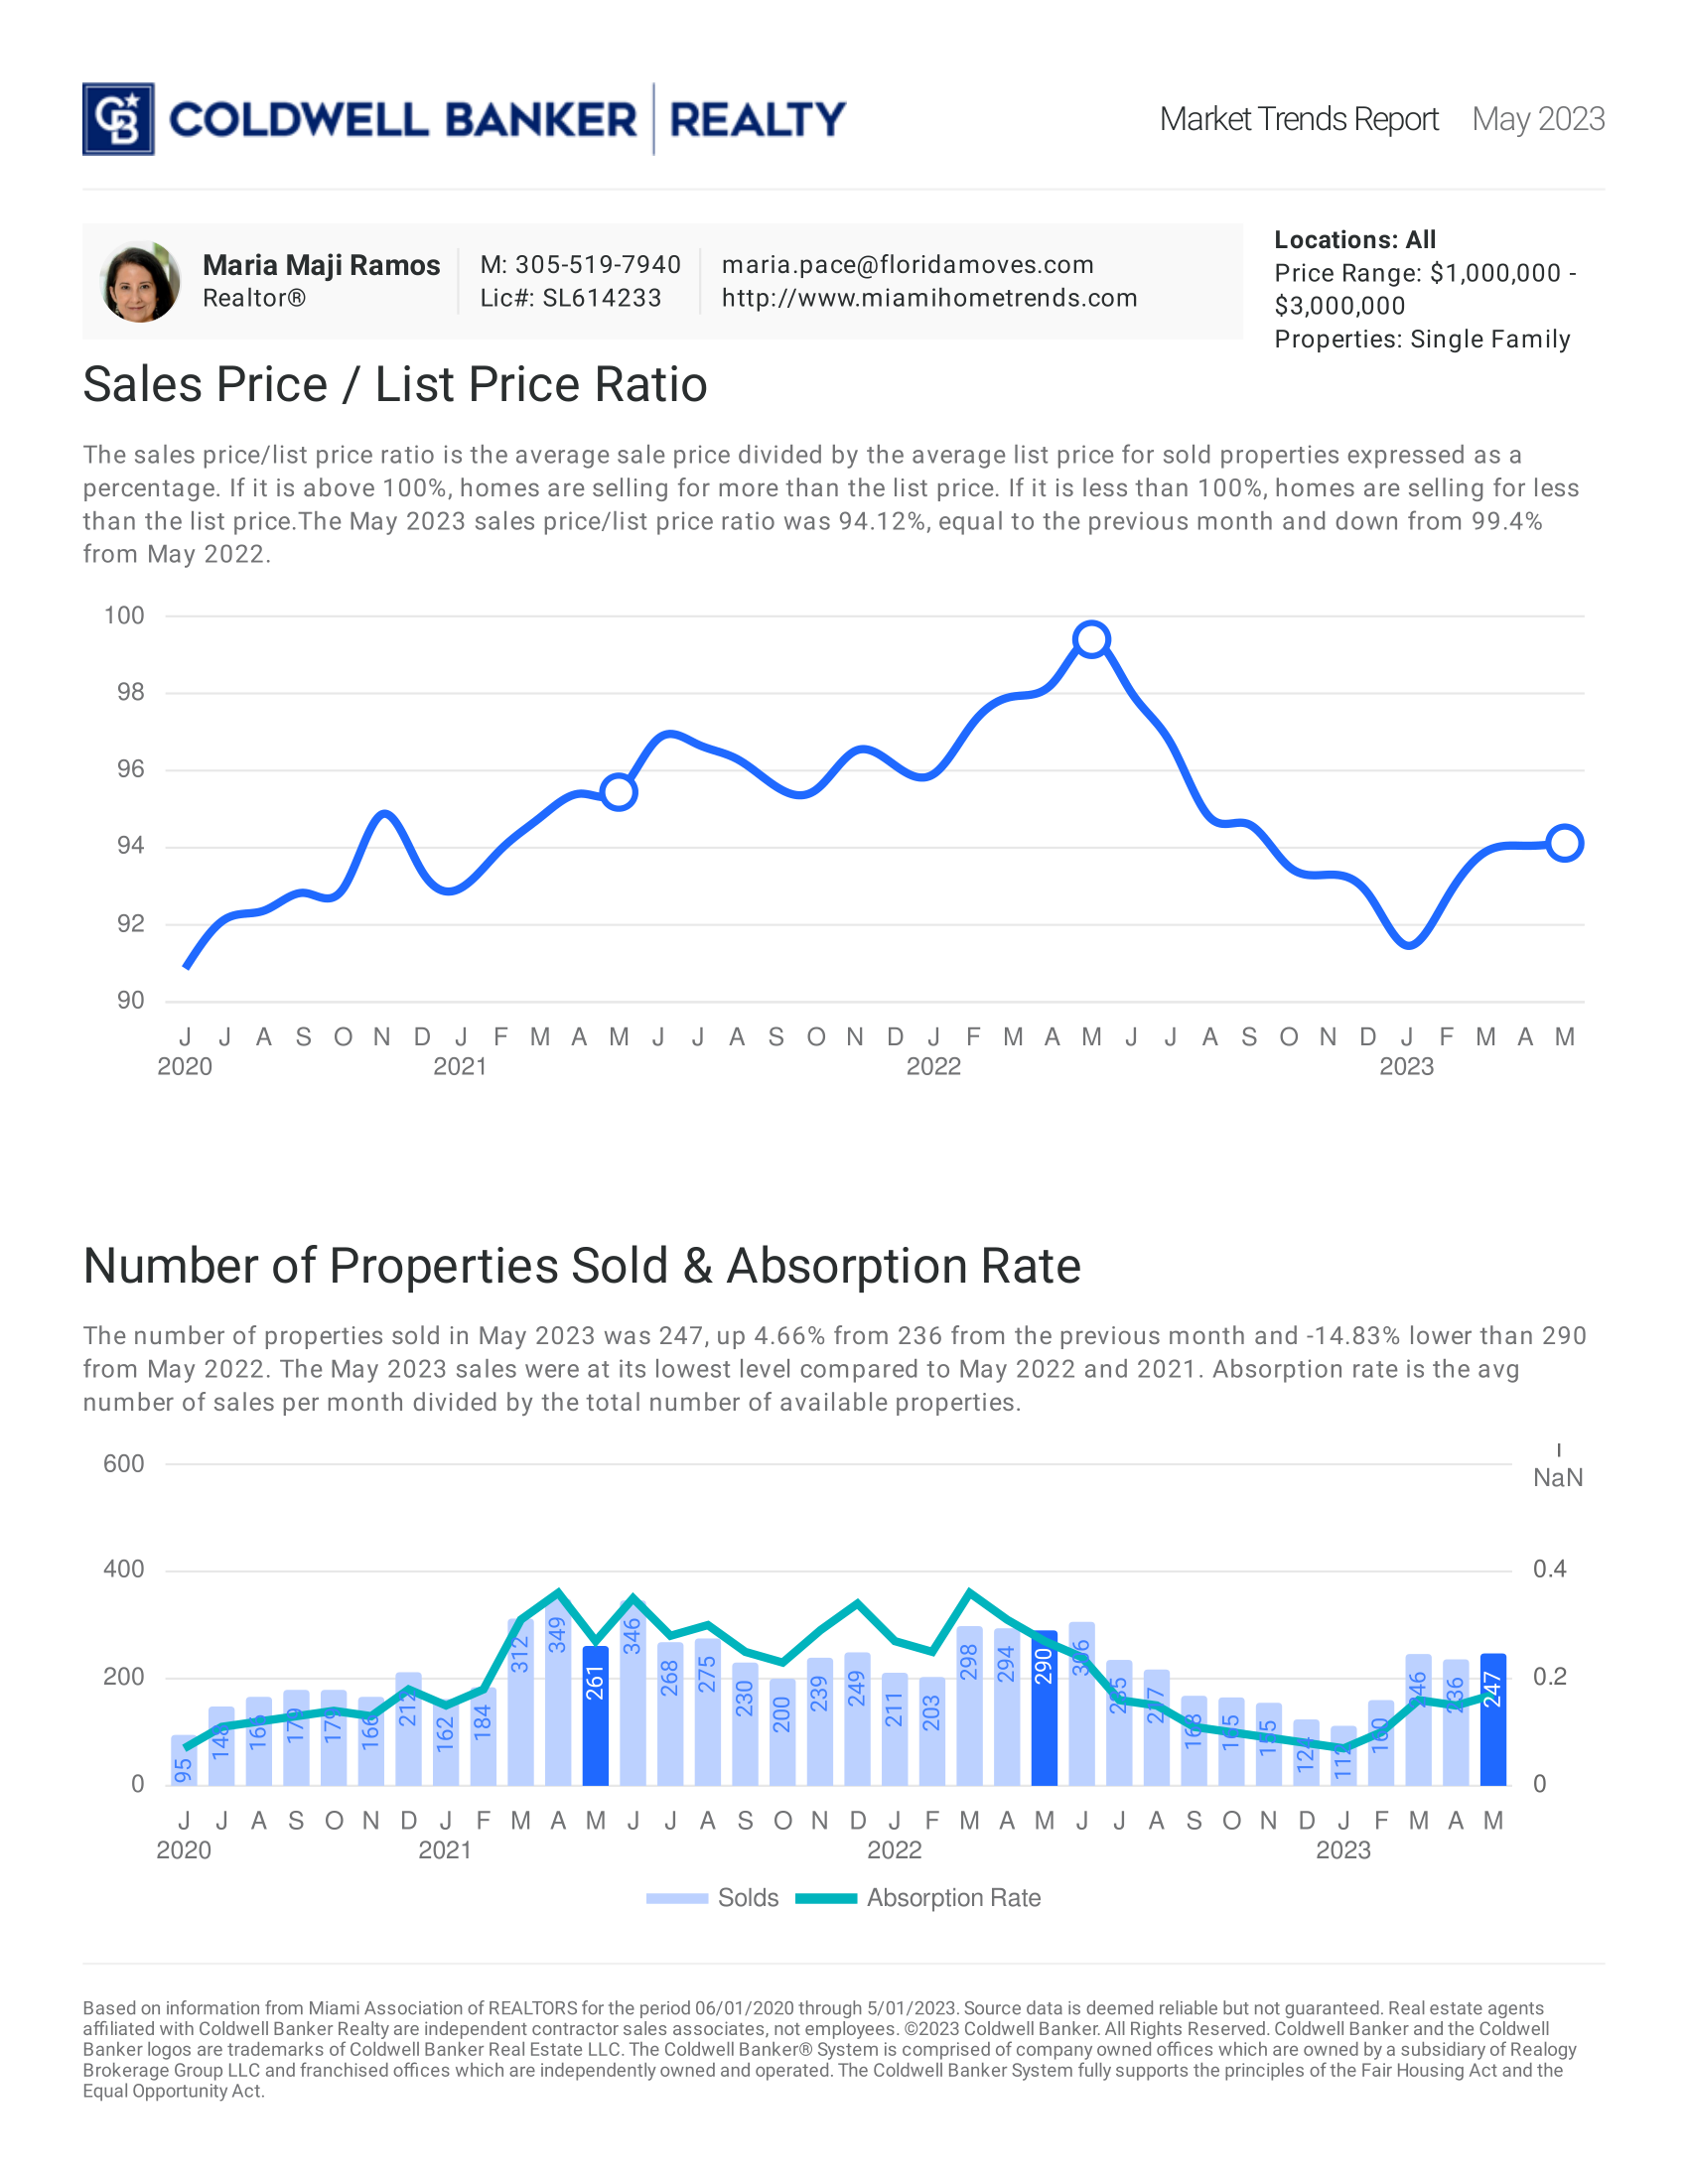
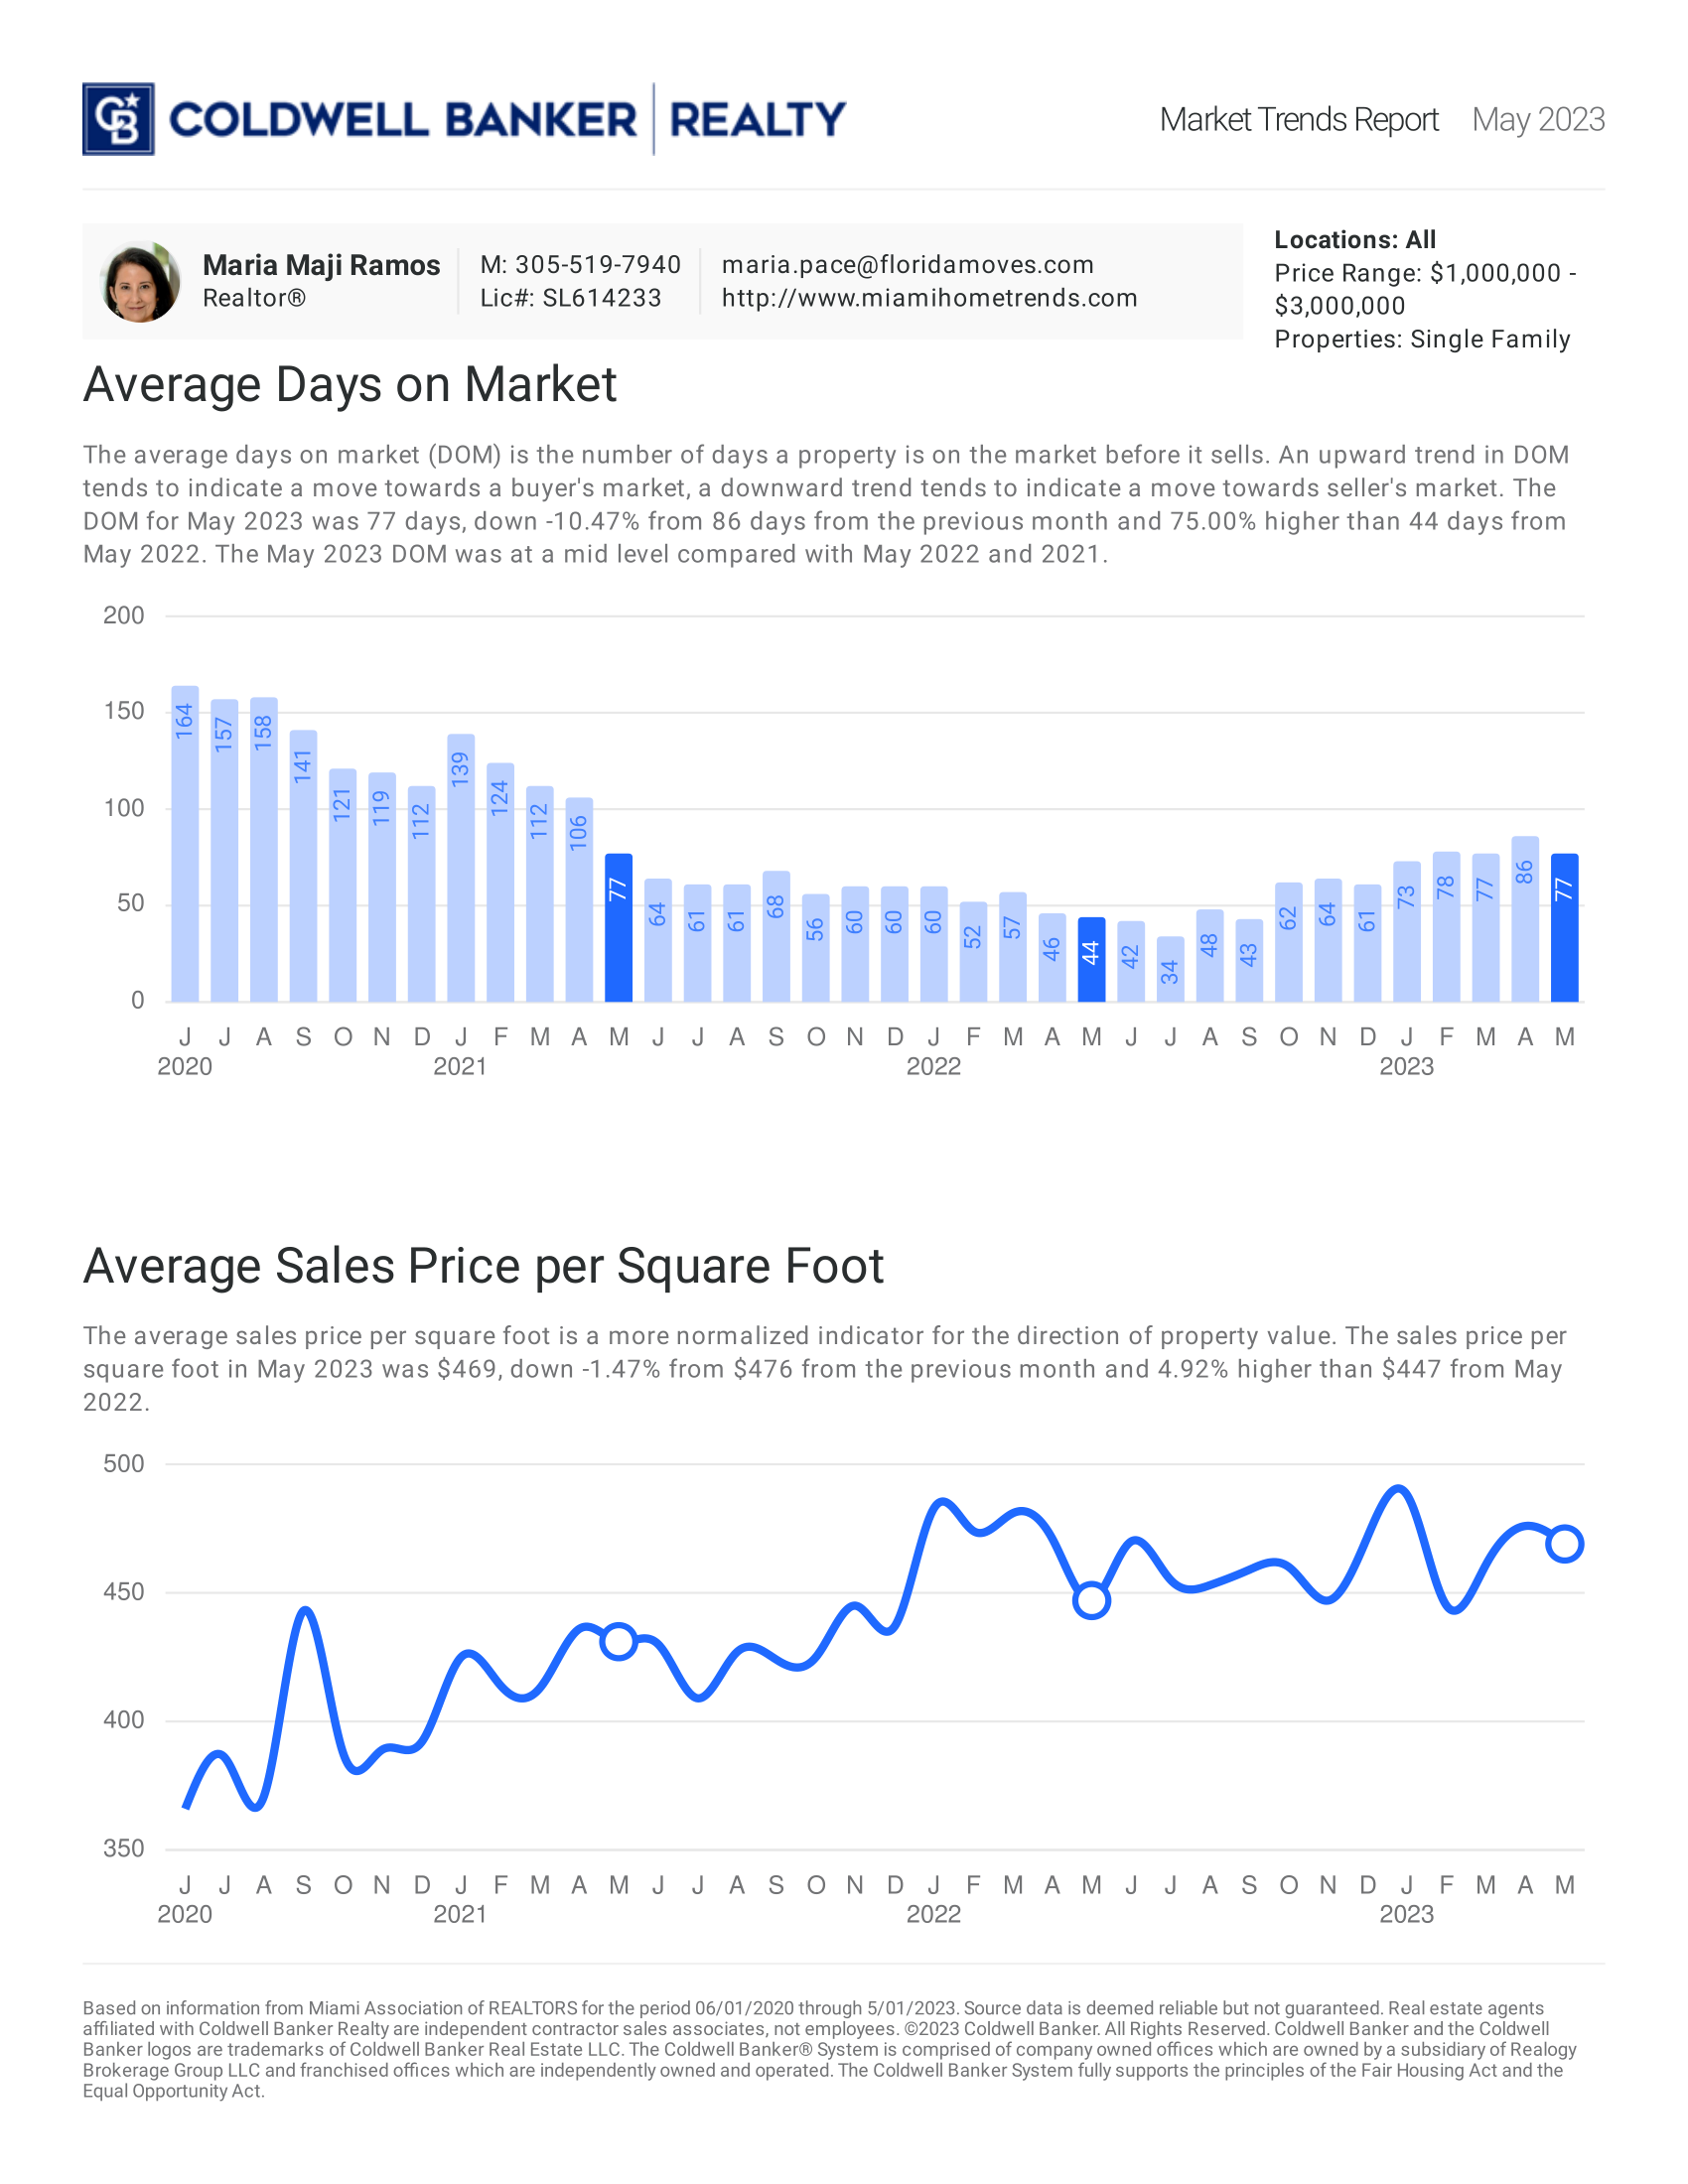
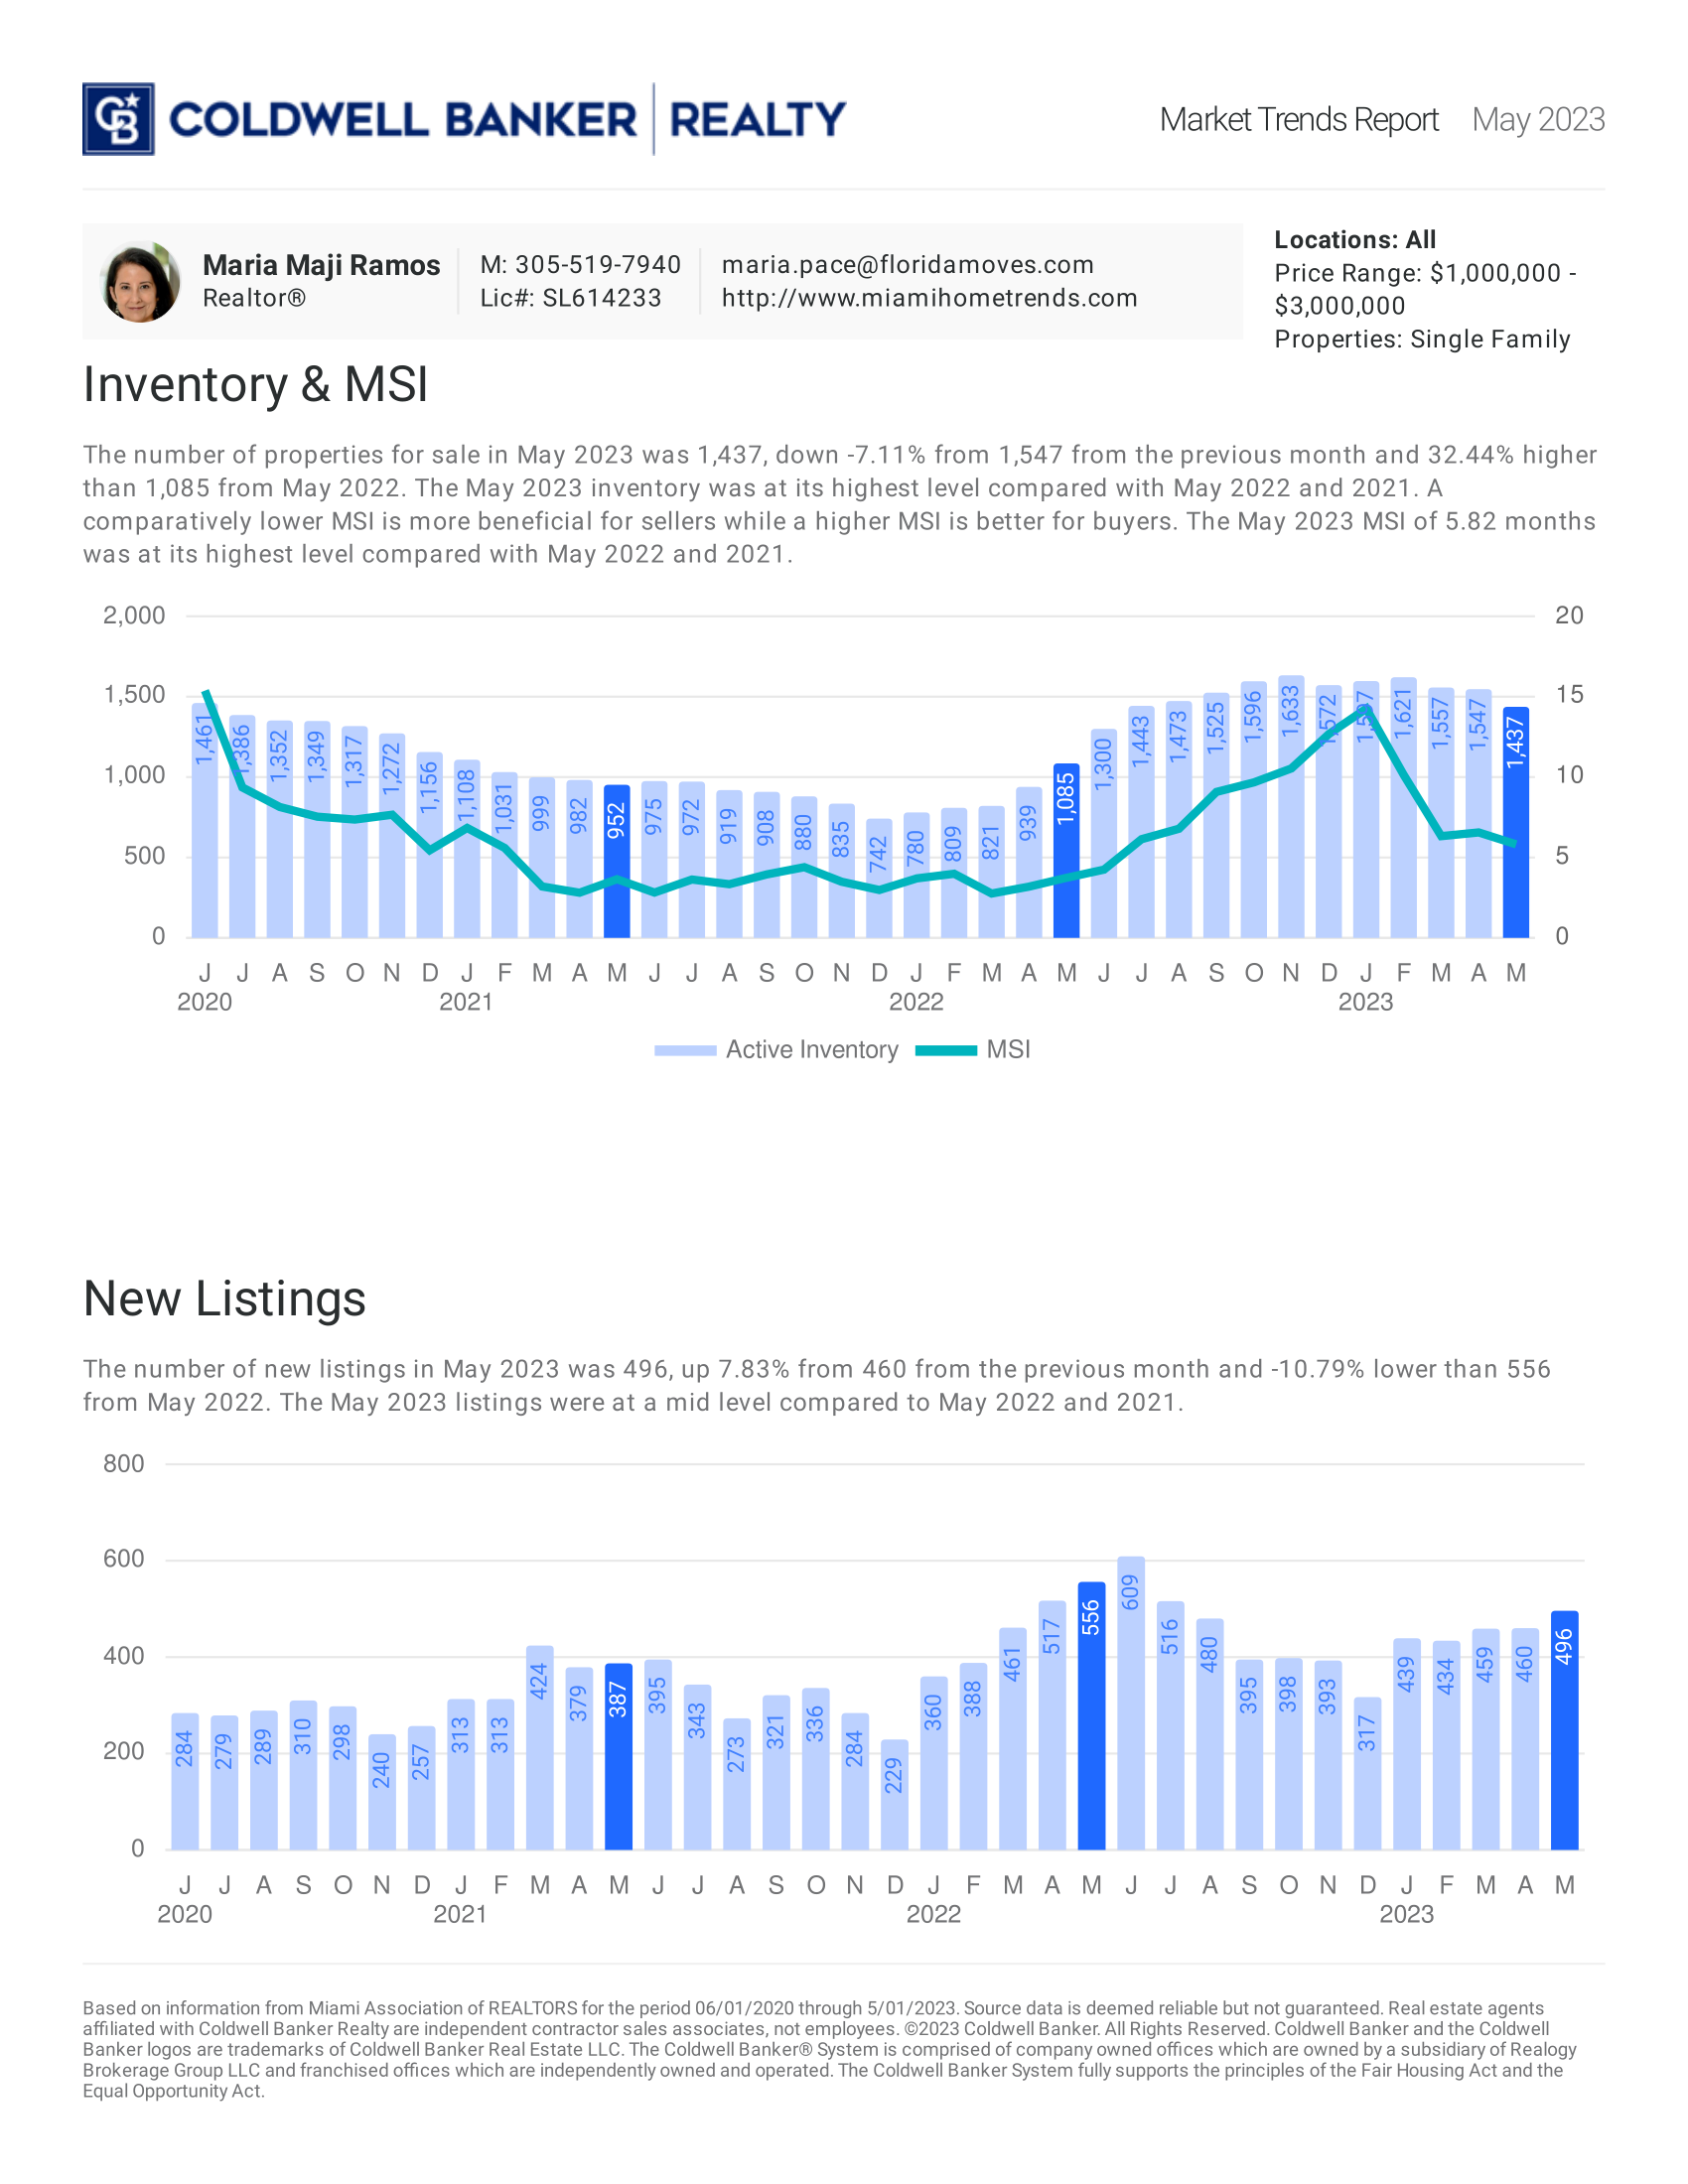
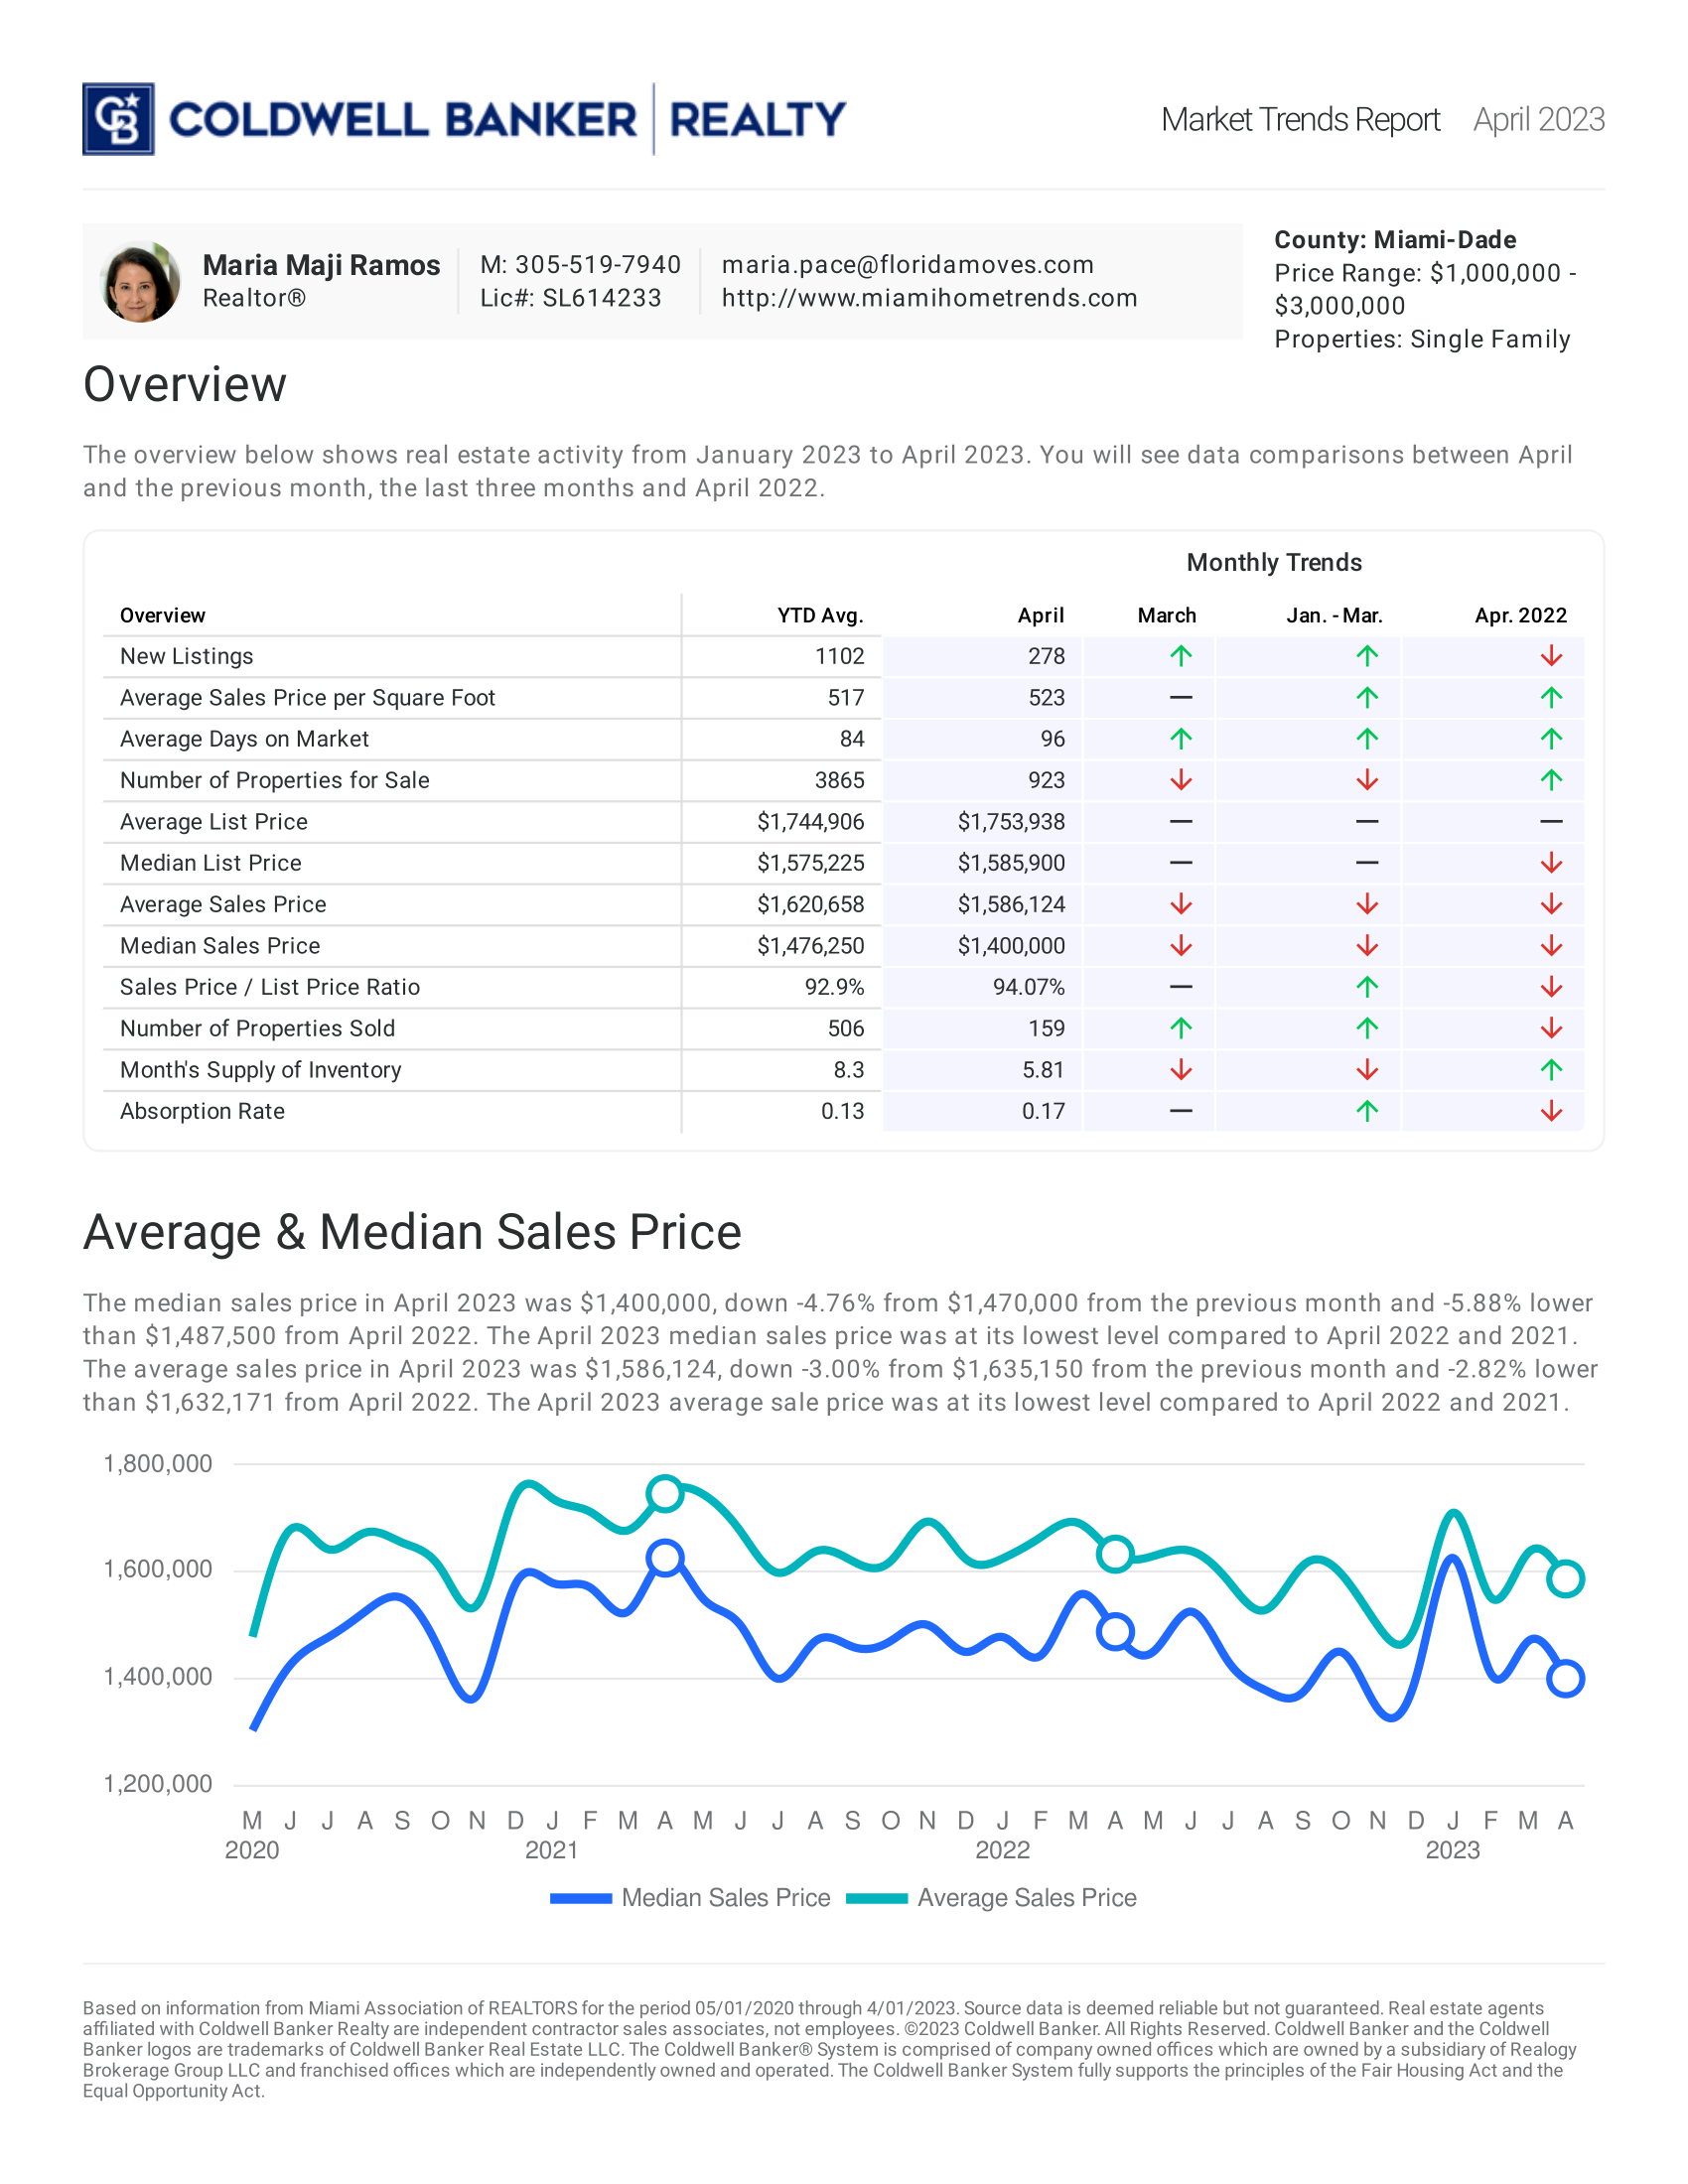
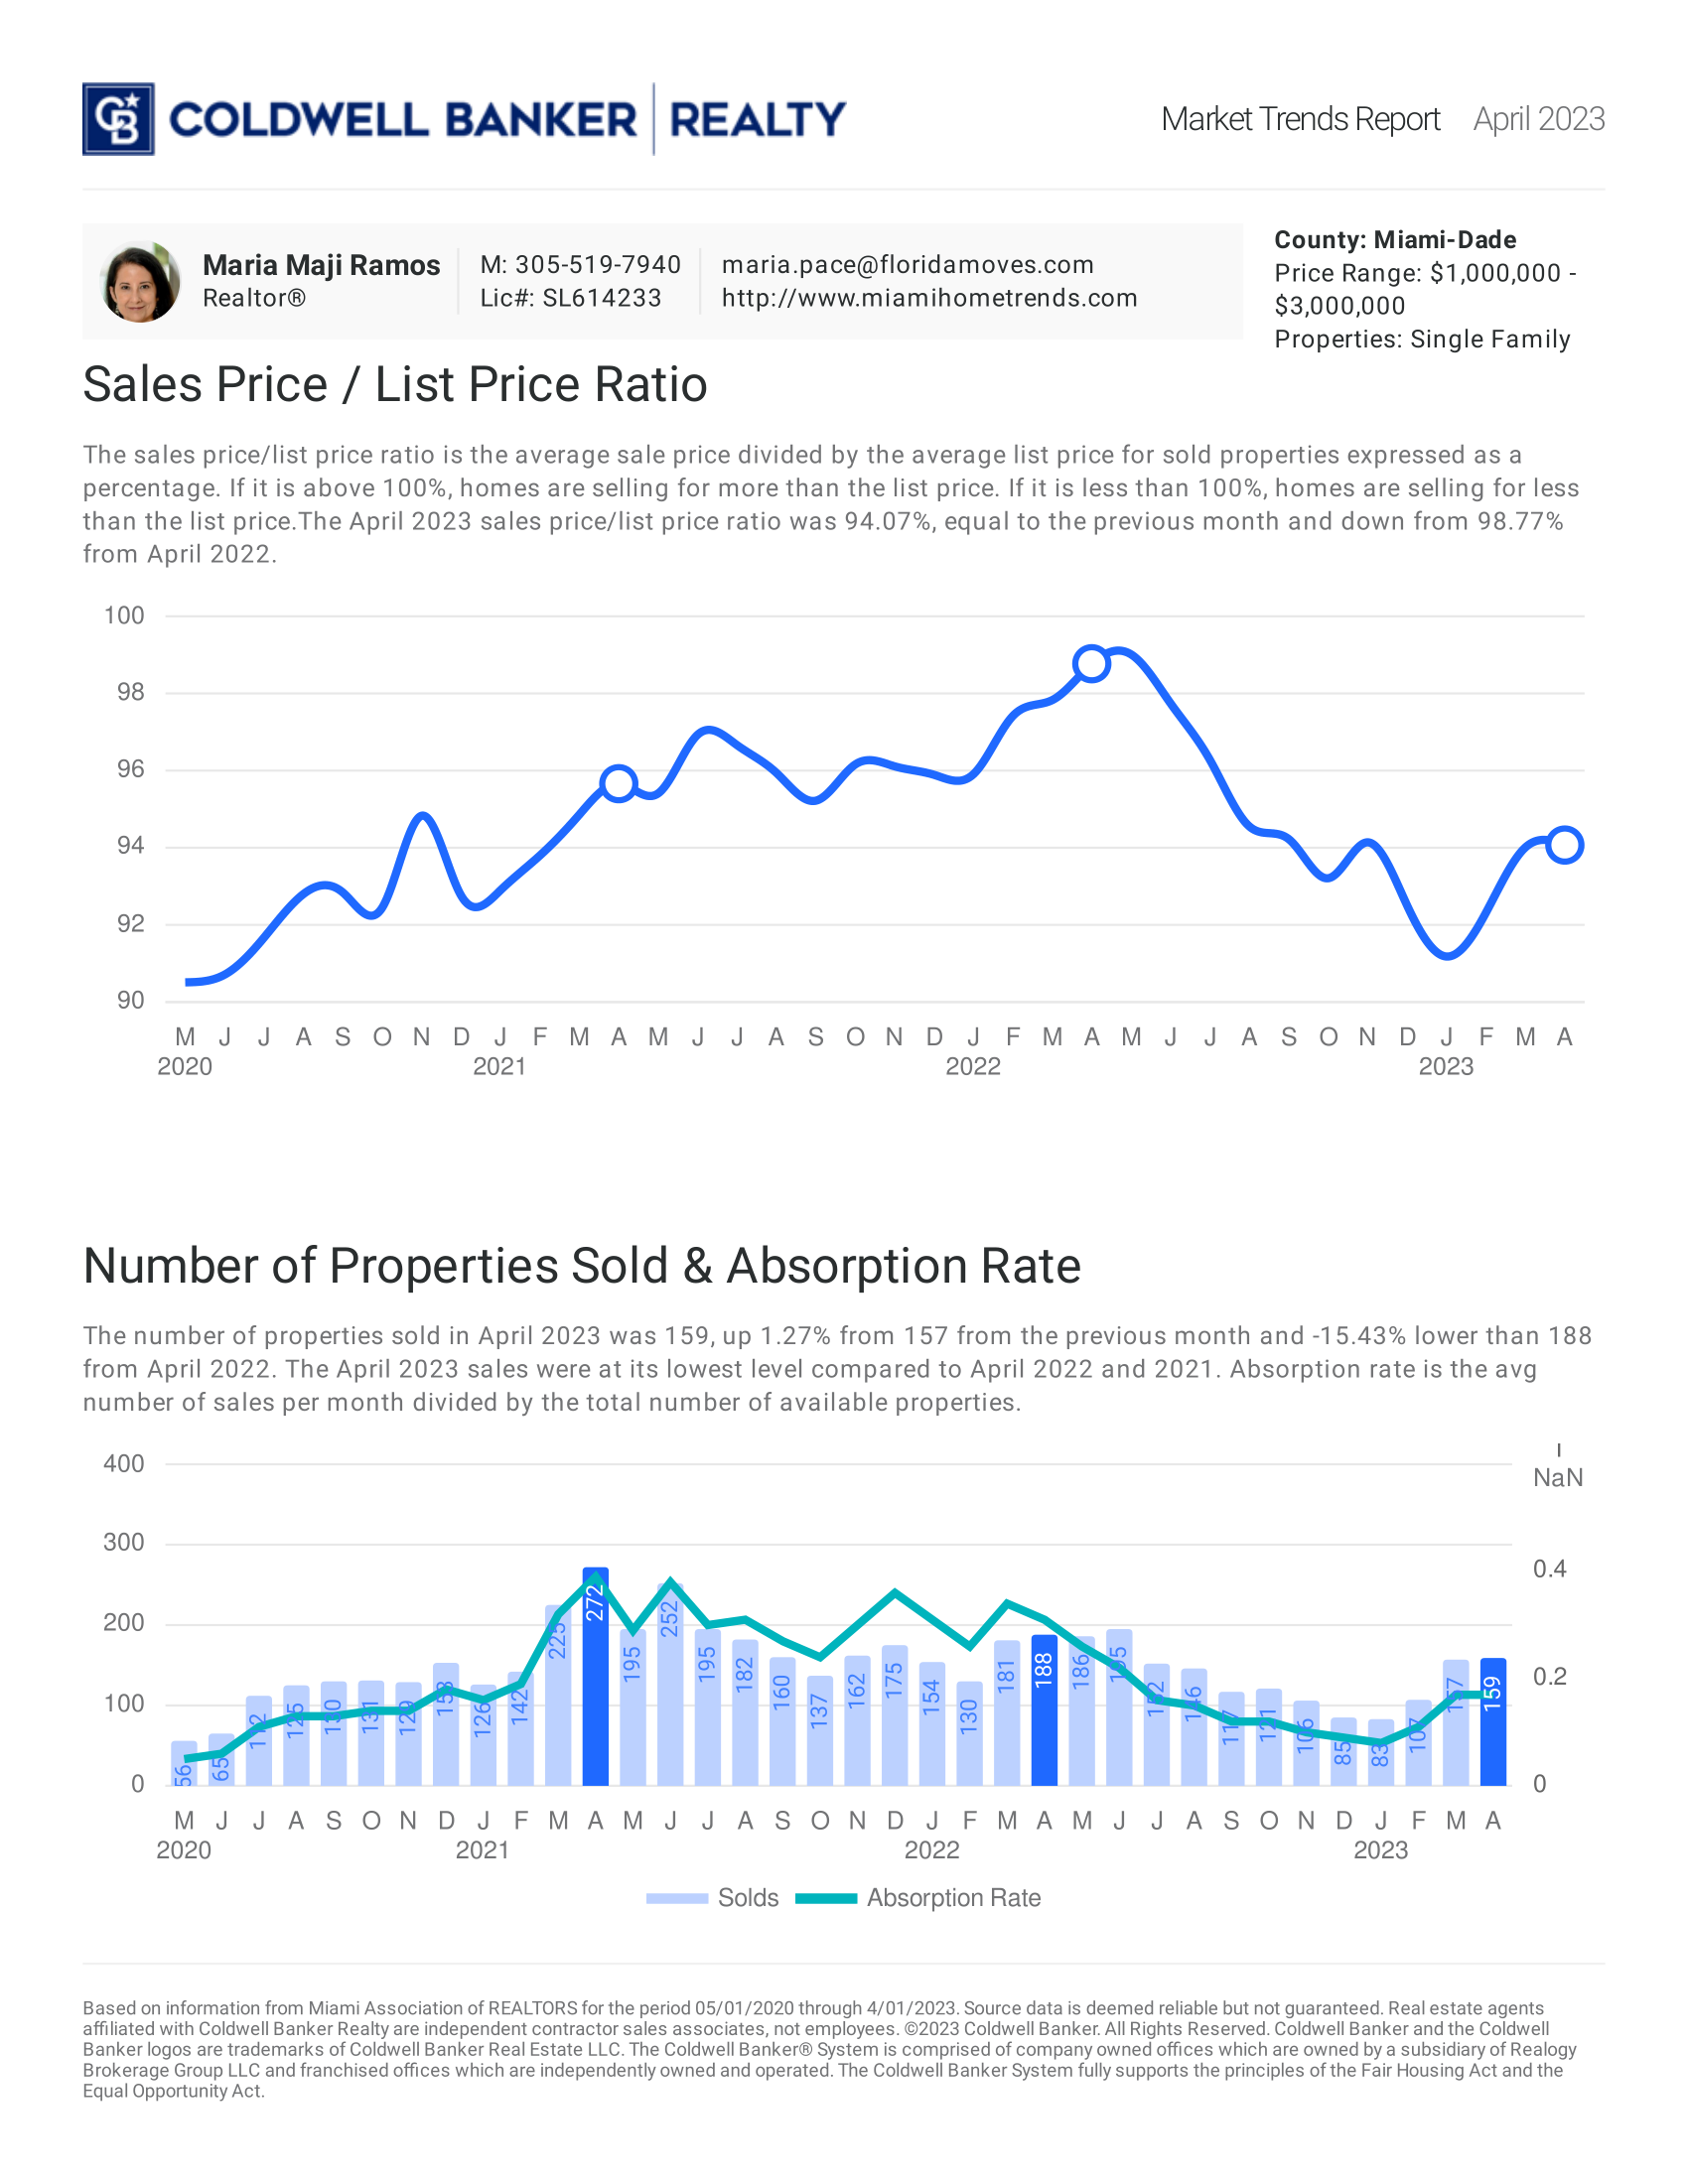
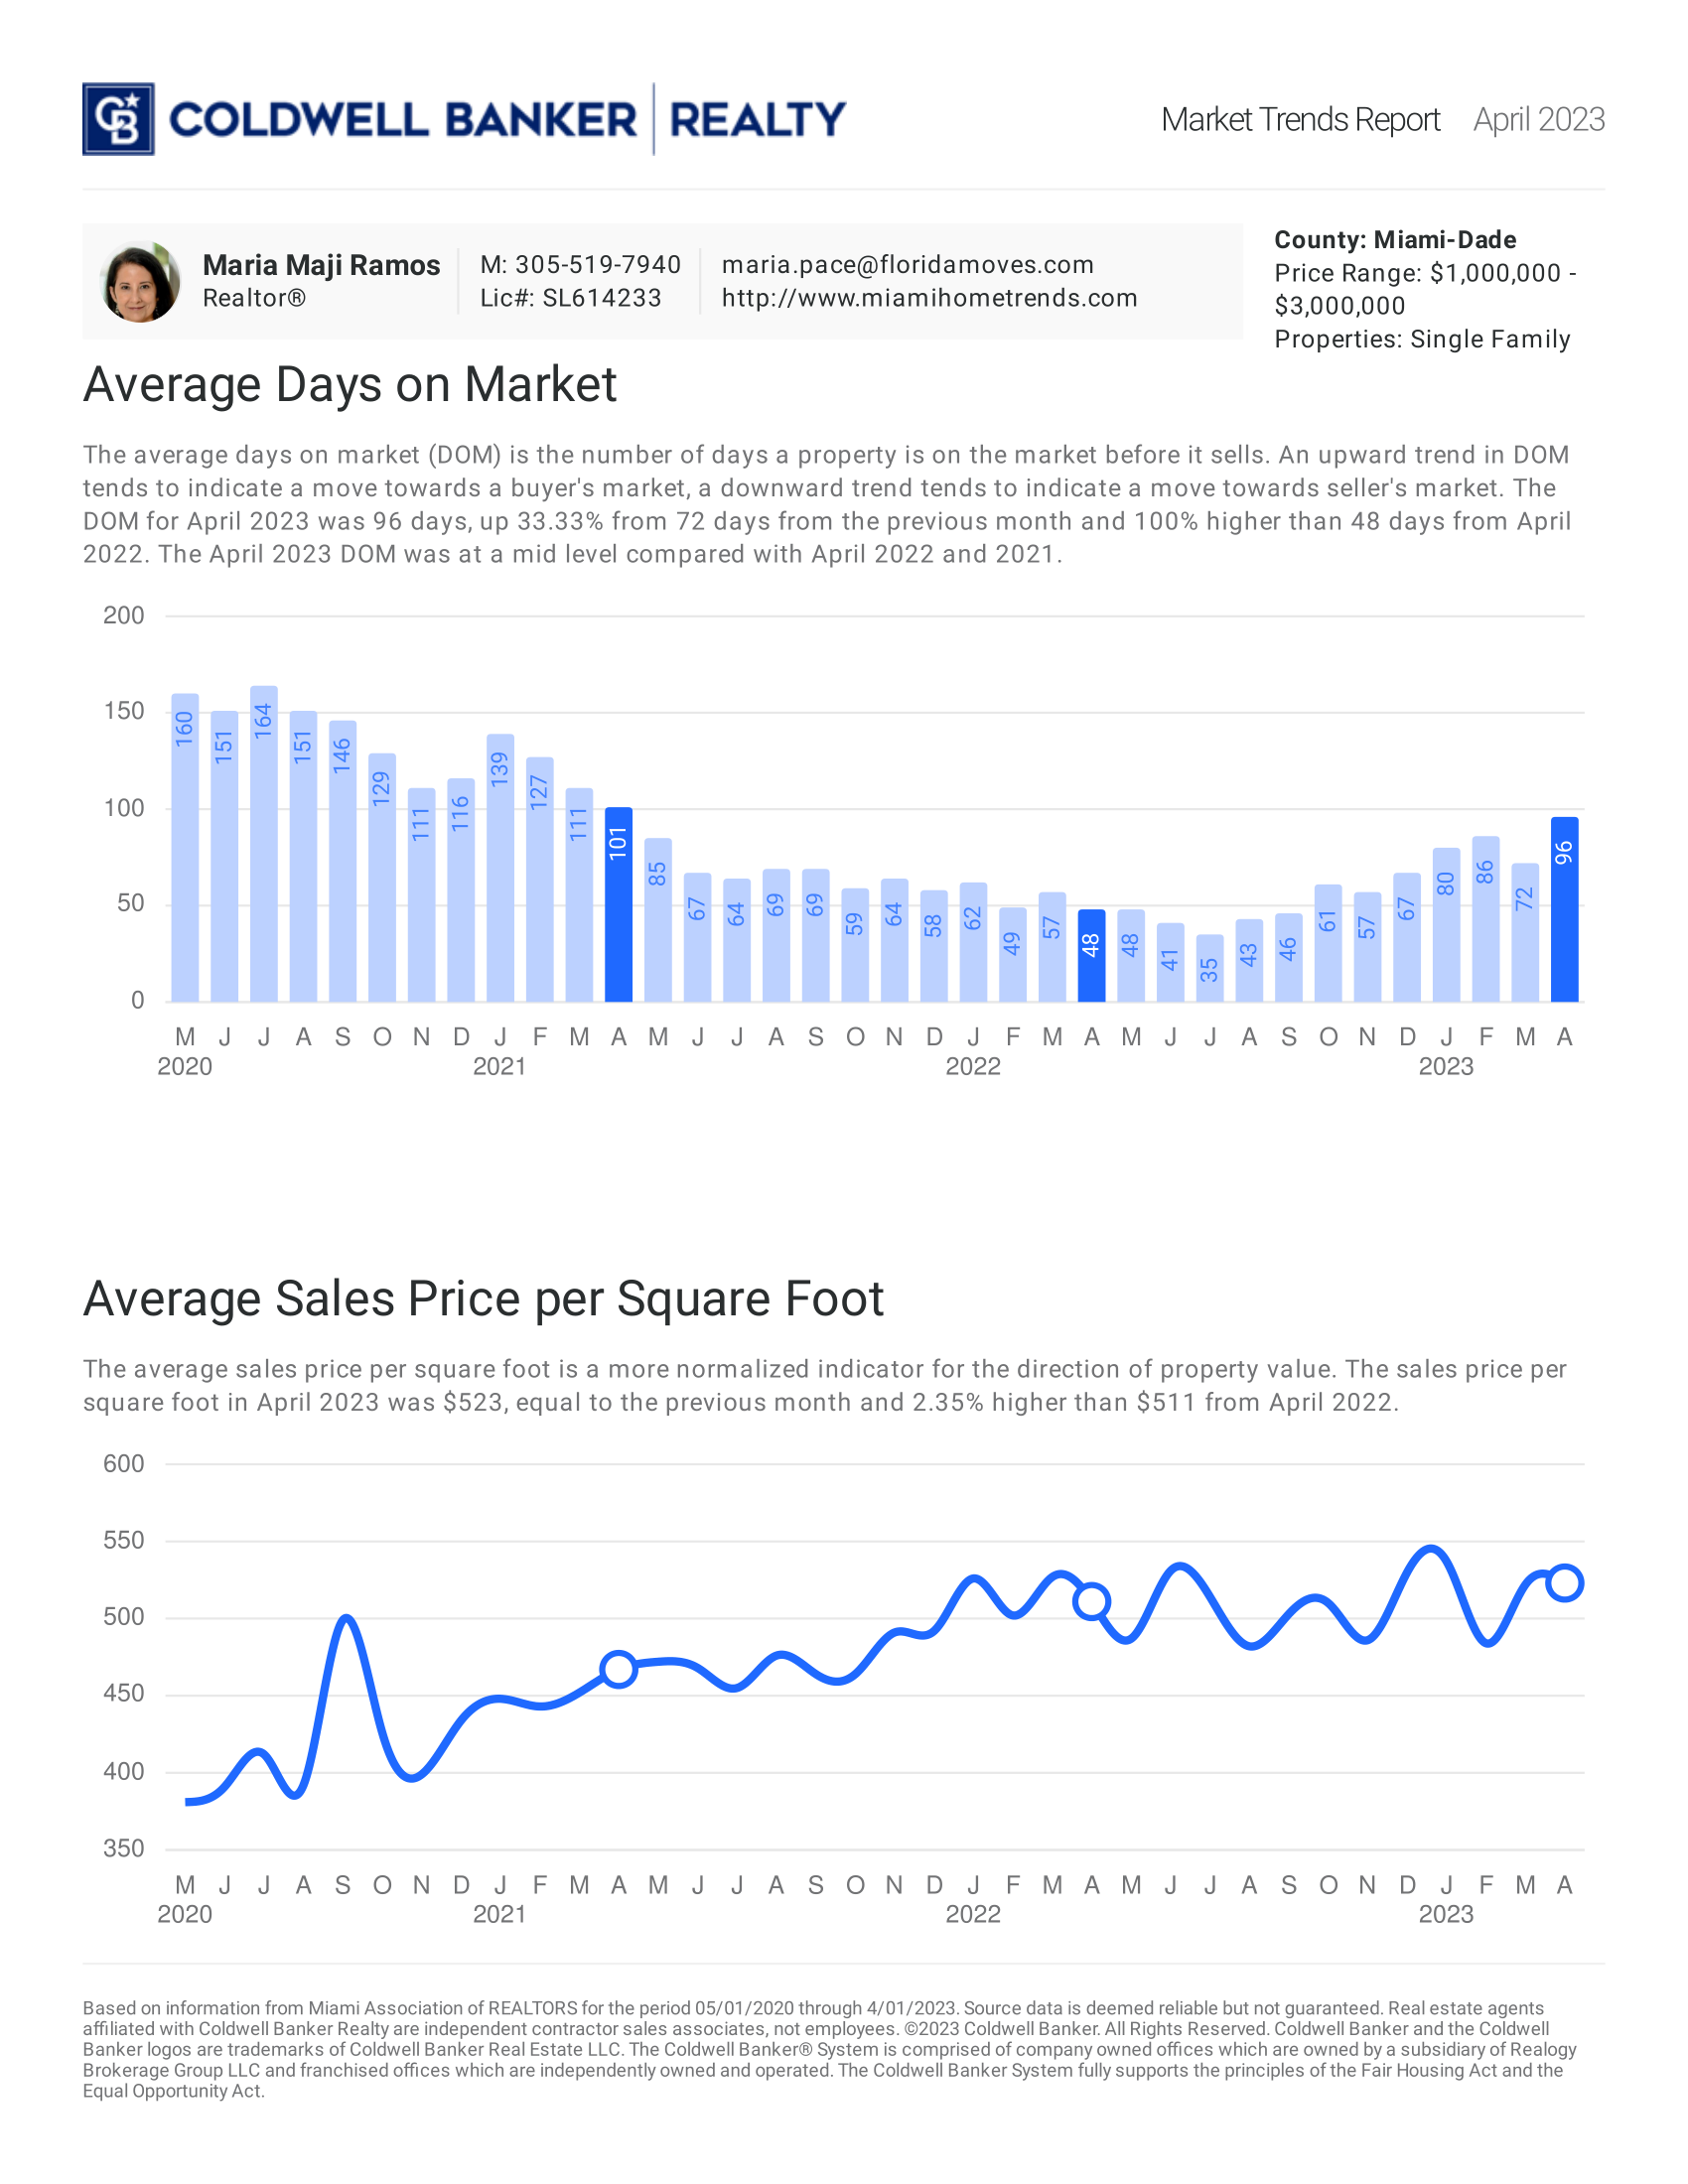
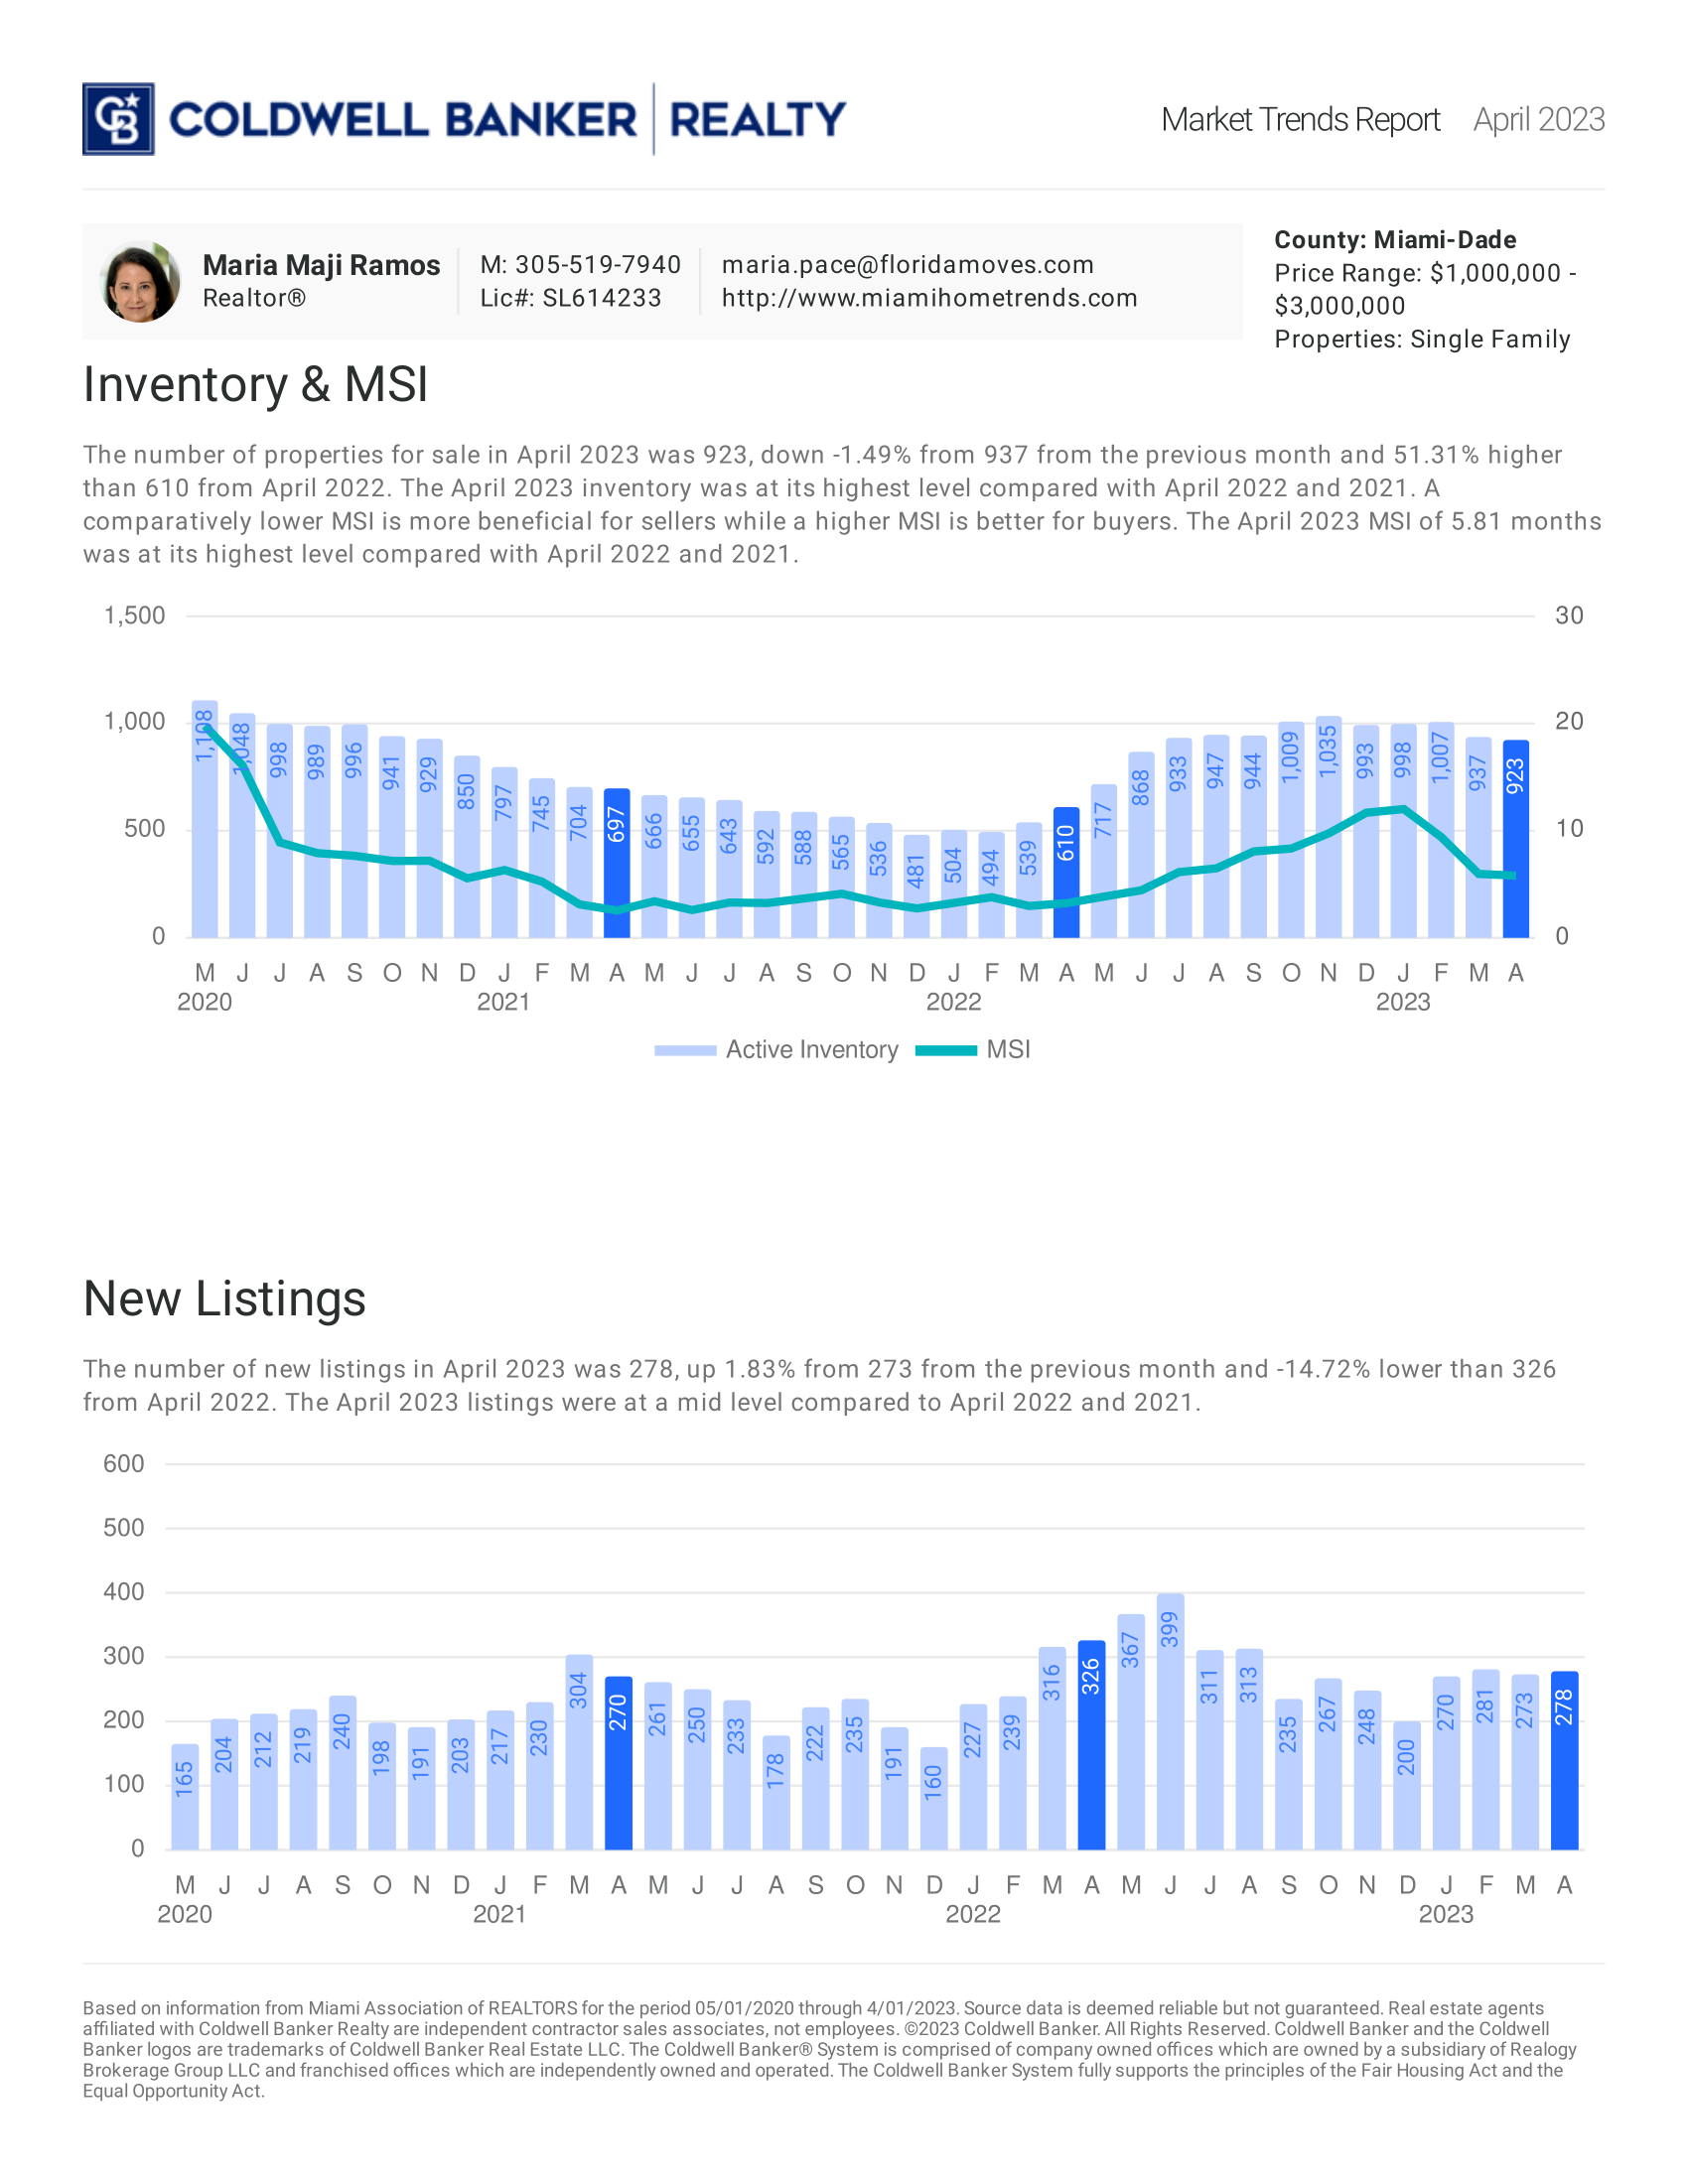
May 2023: Single Family ($1M to $3M)


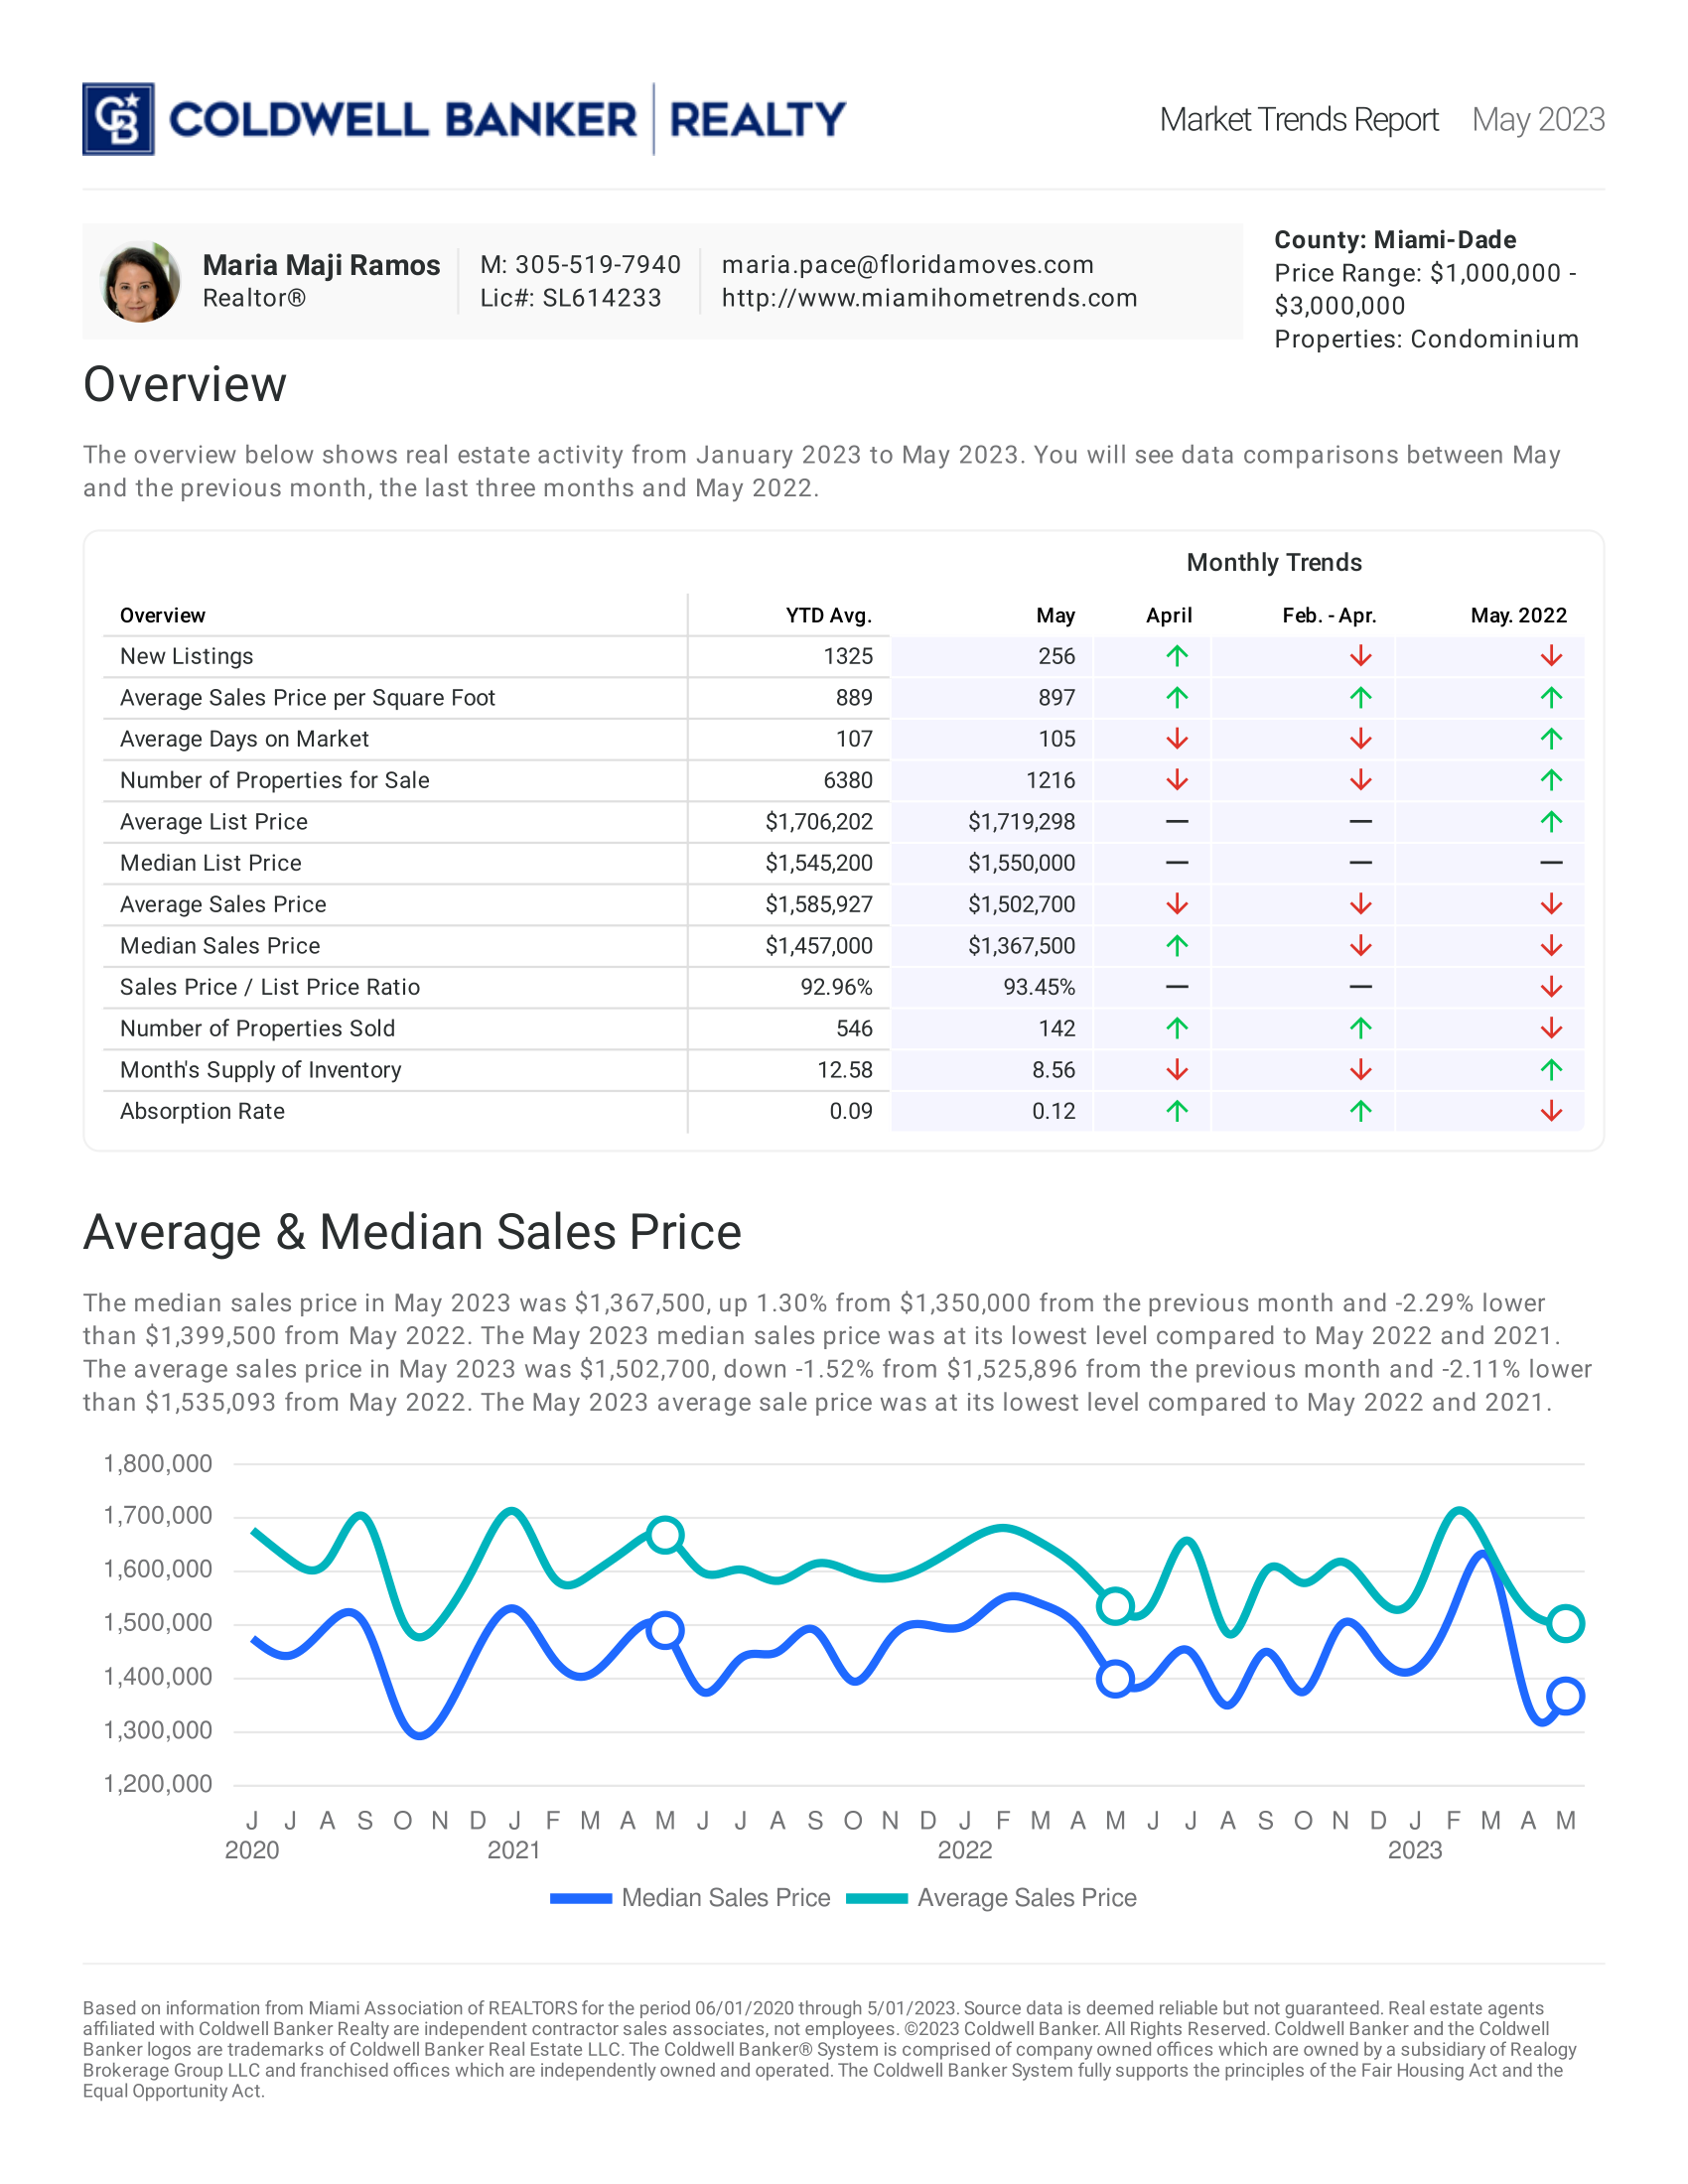
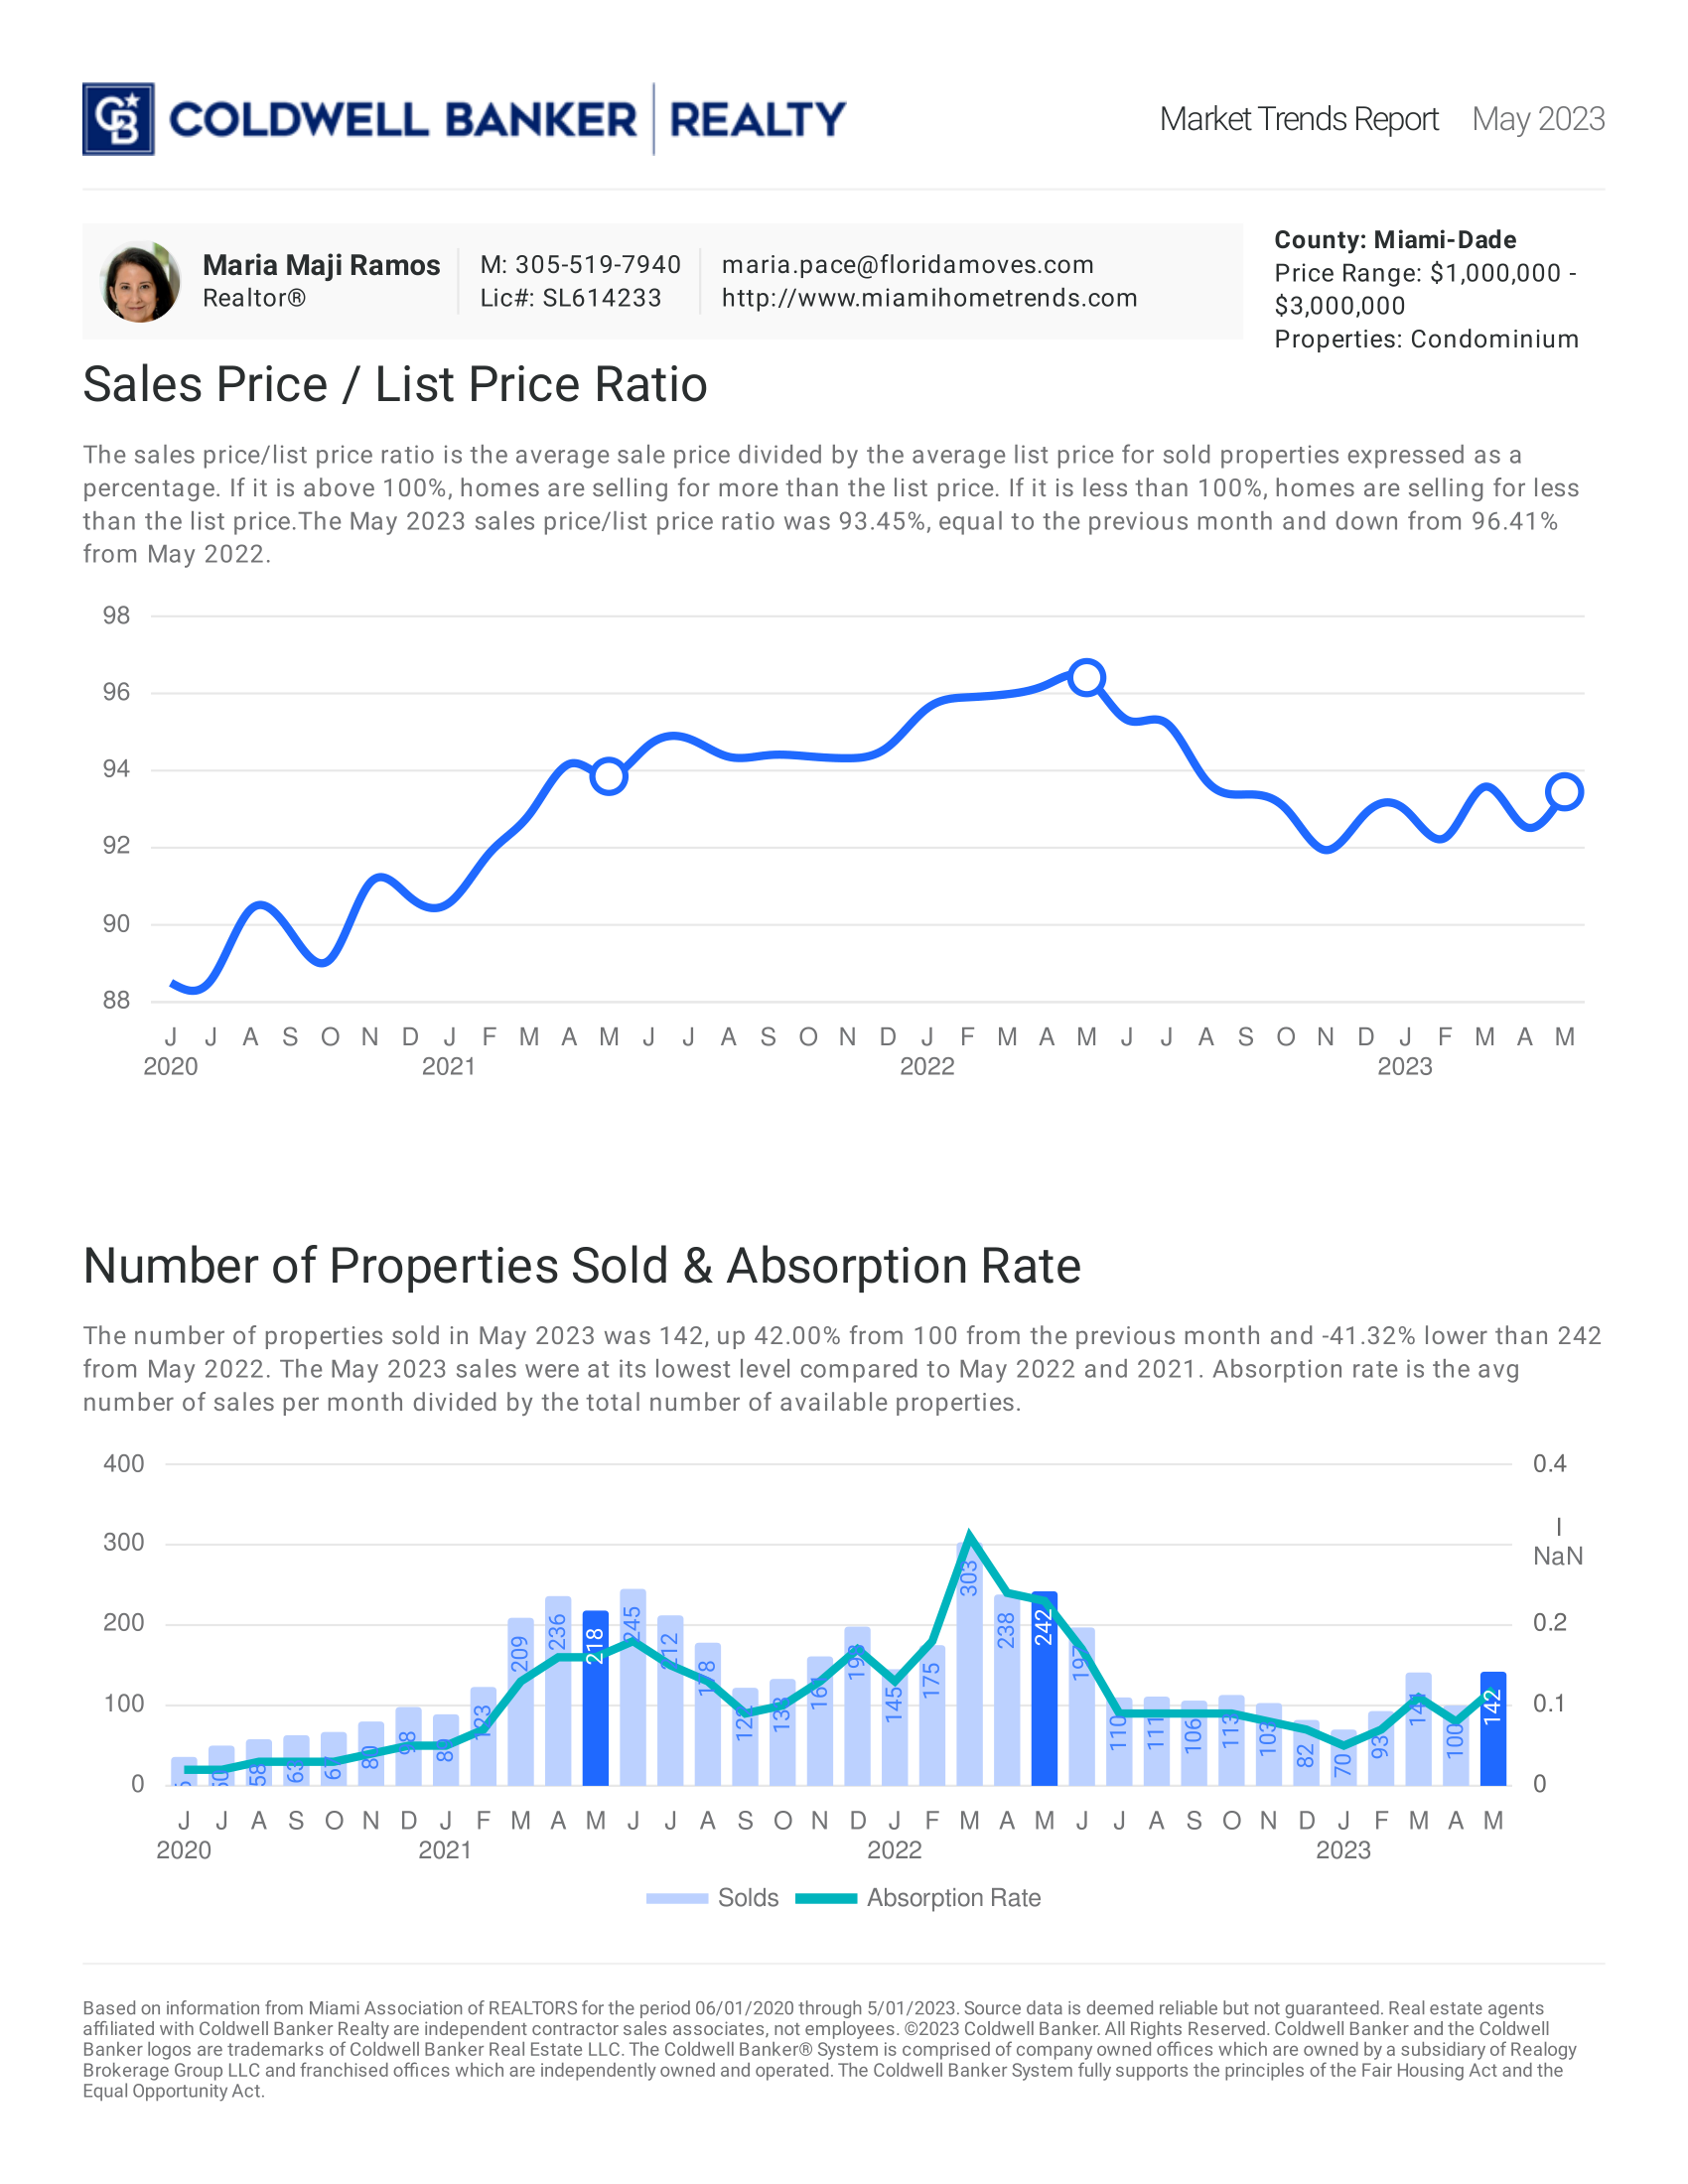
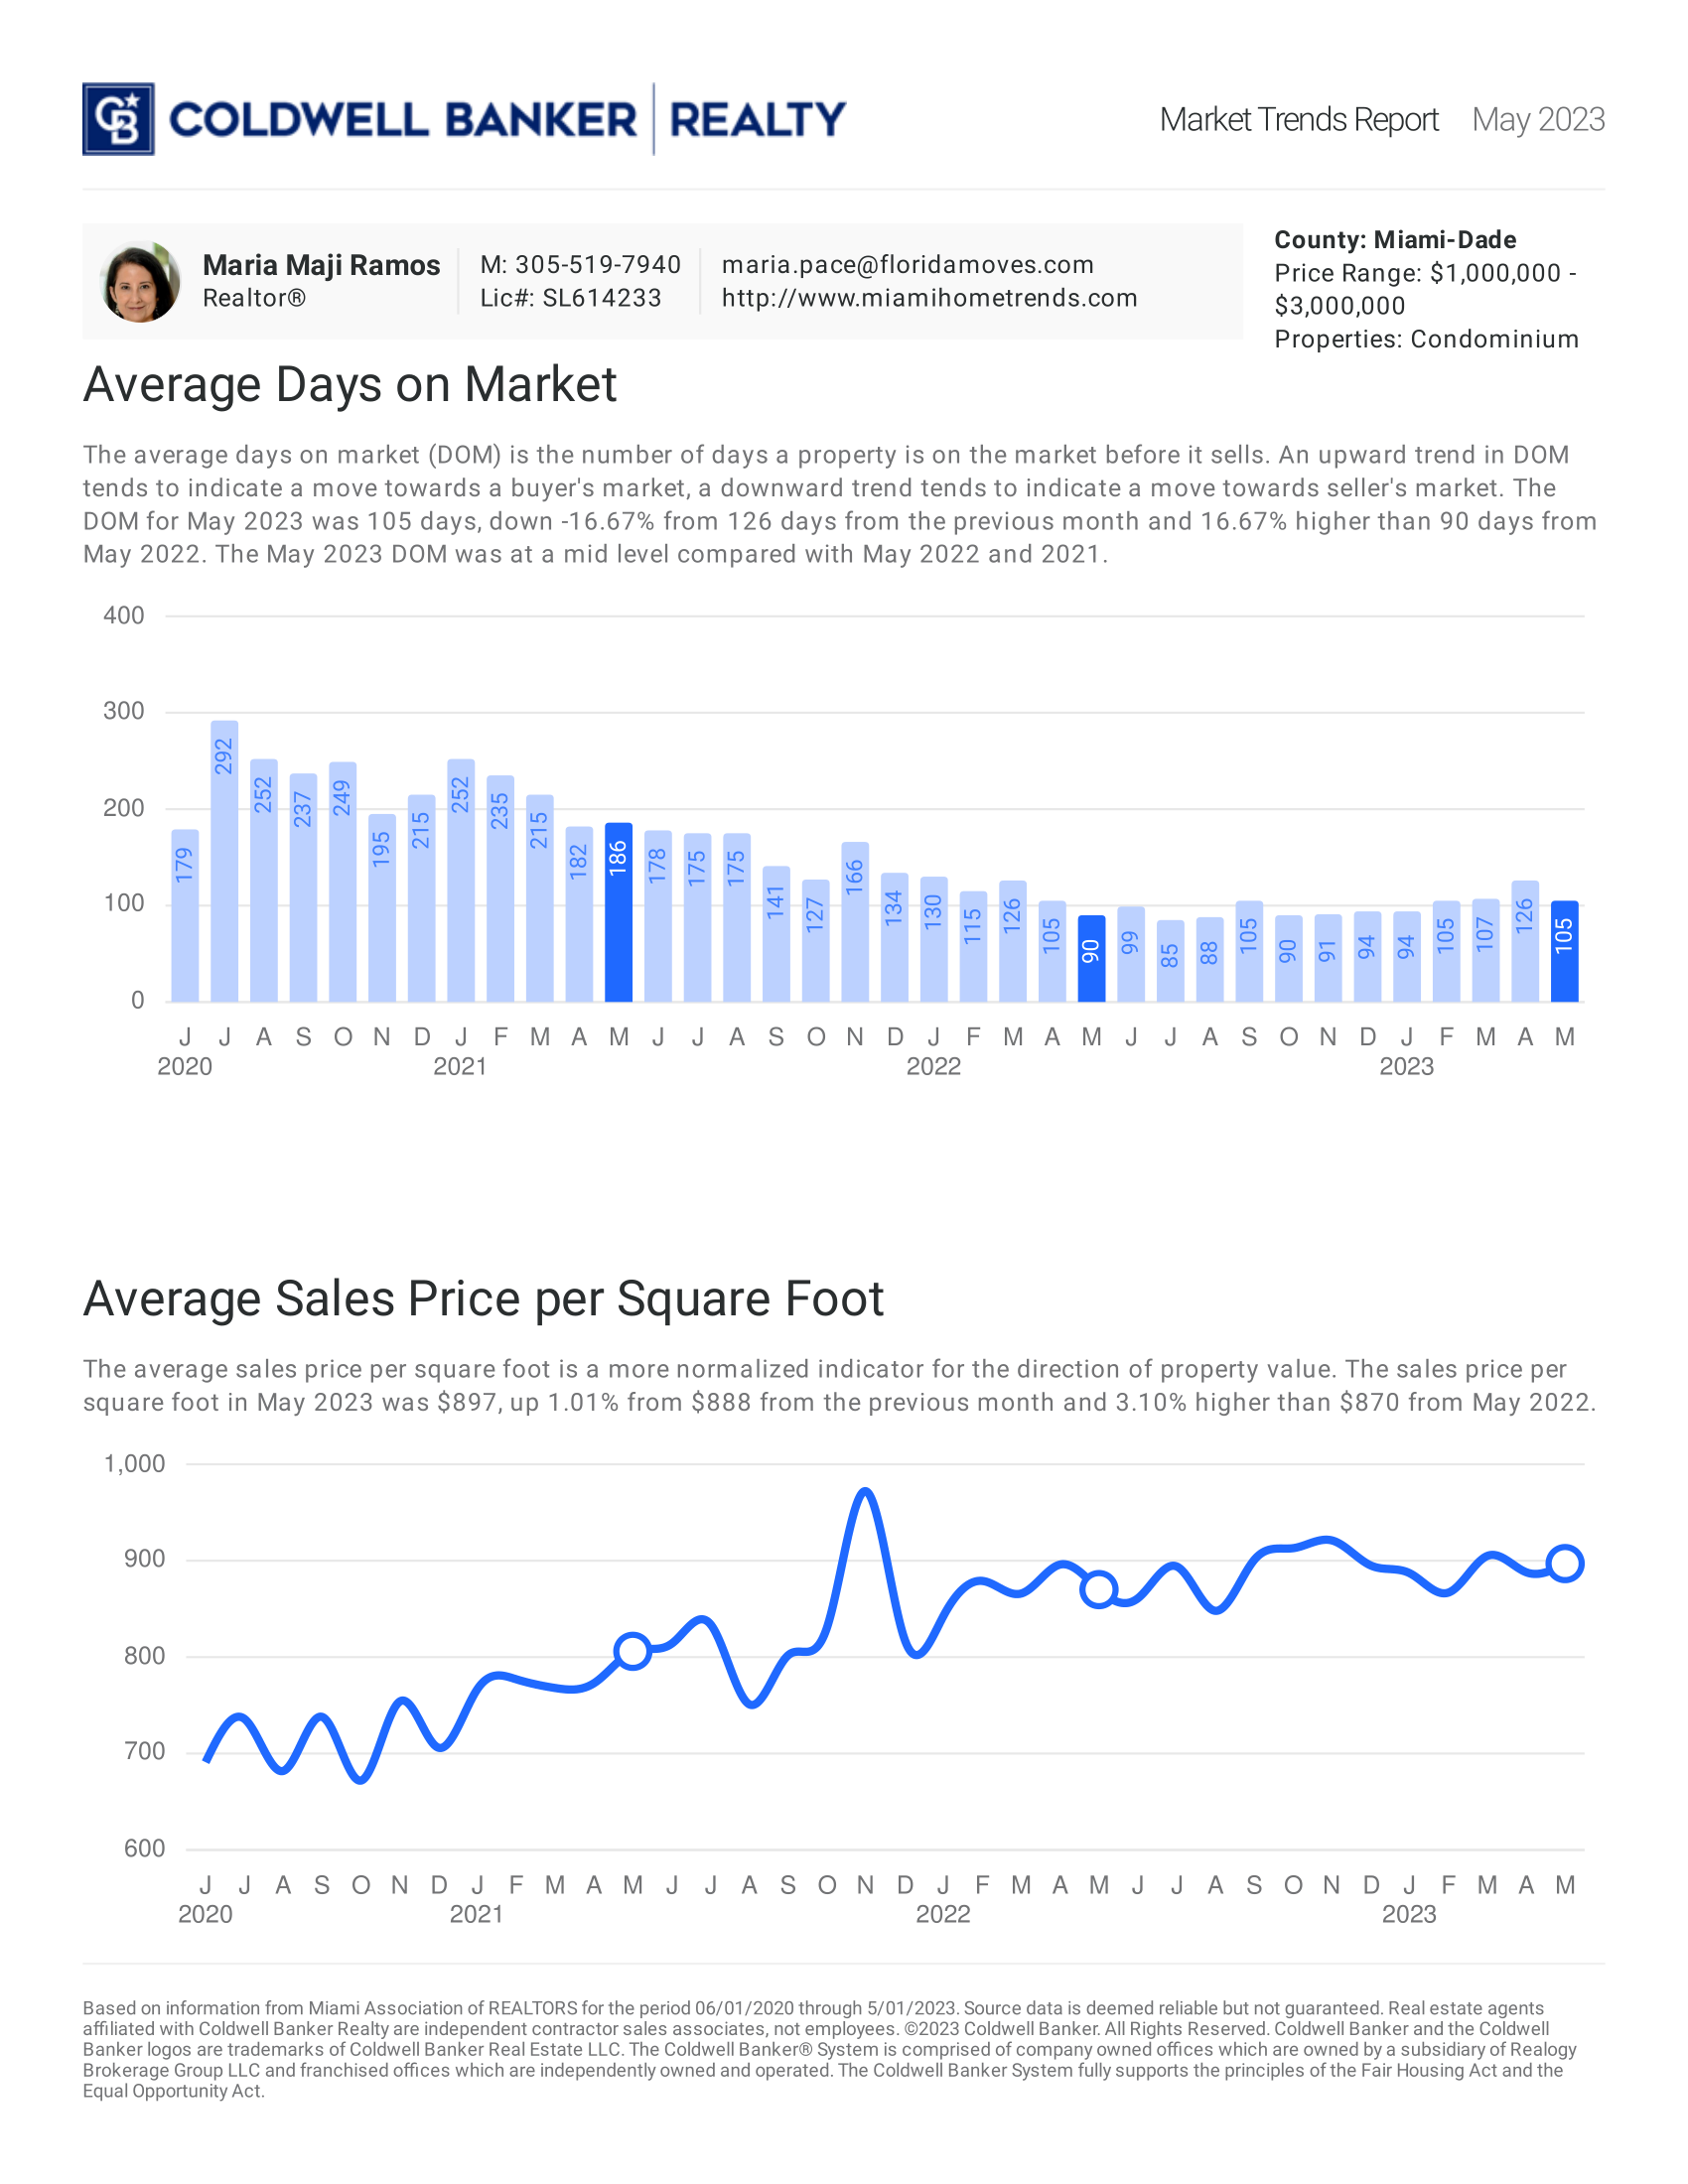
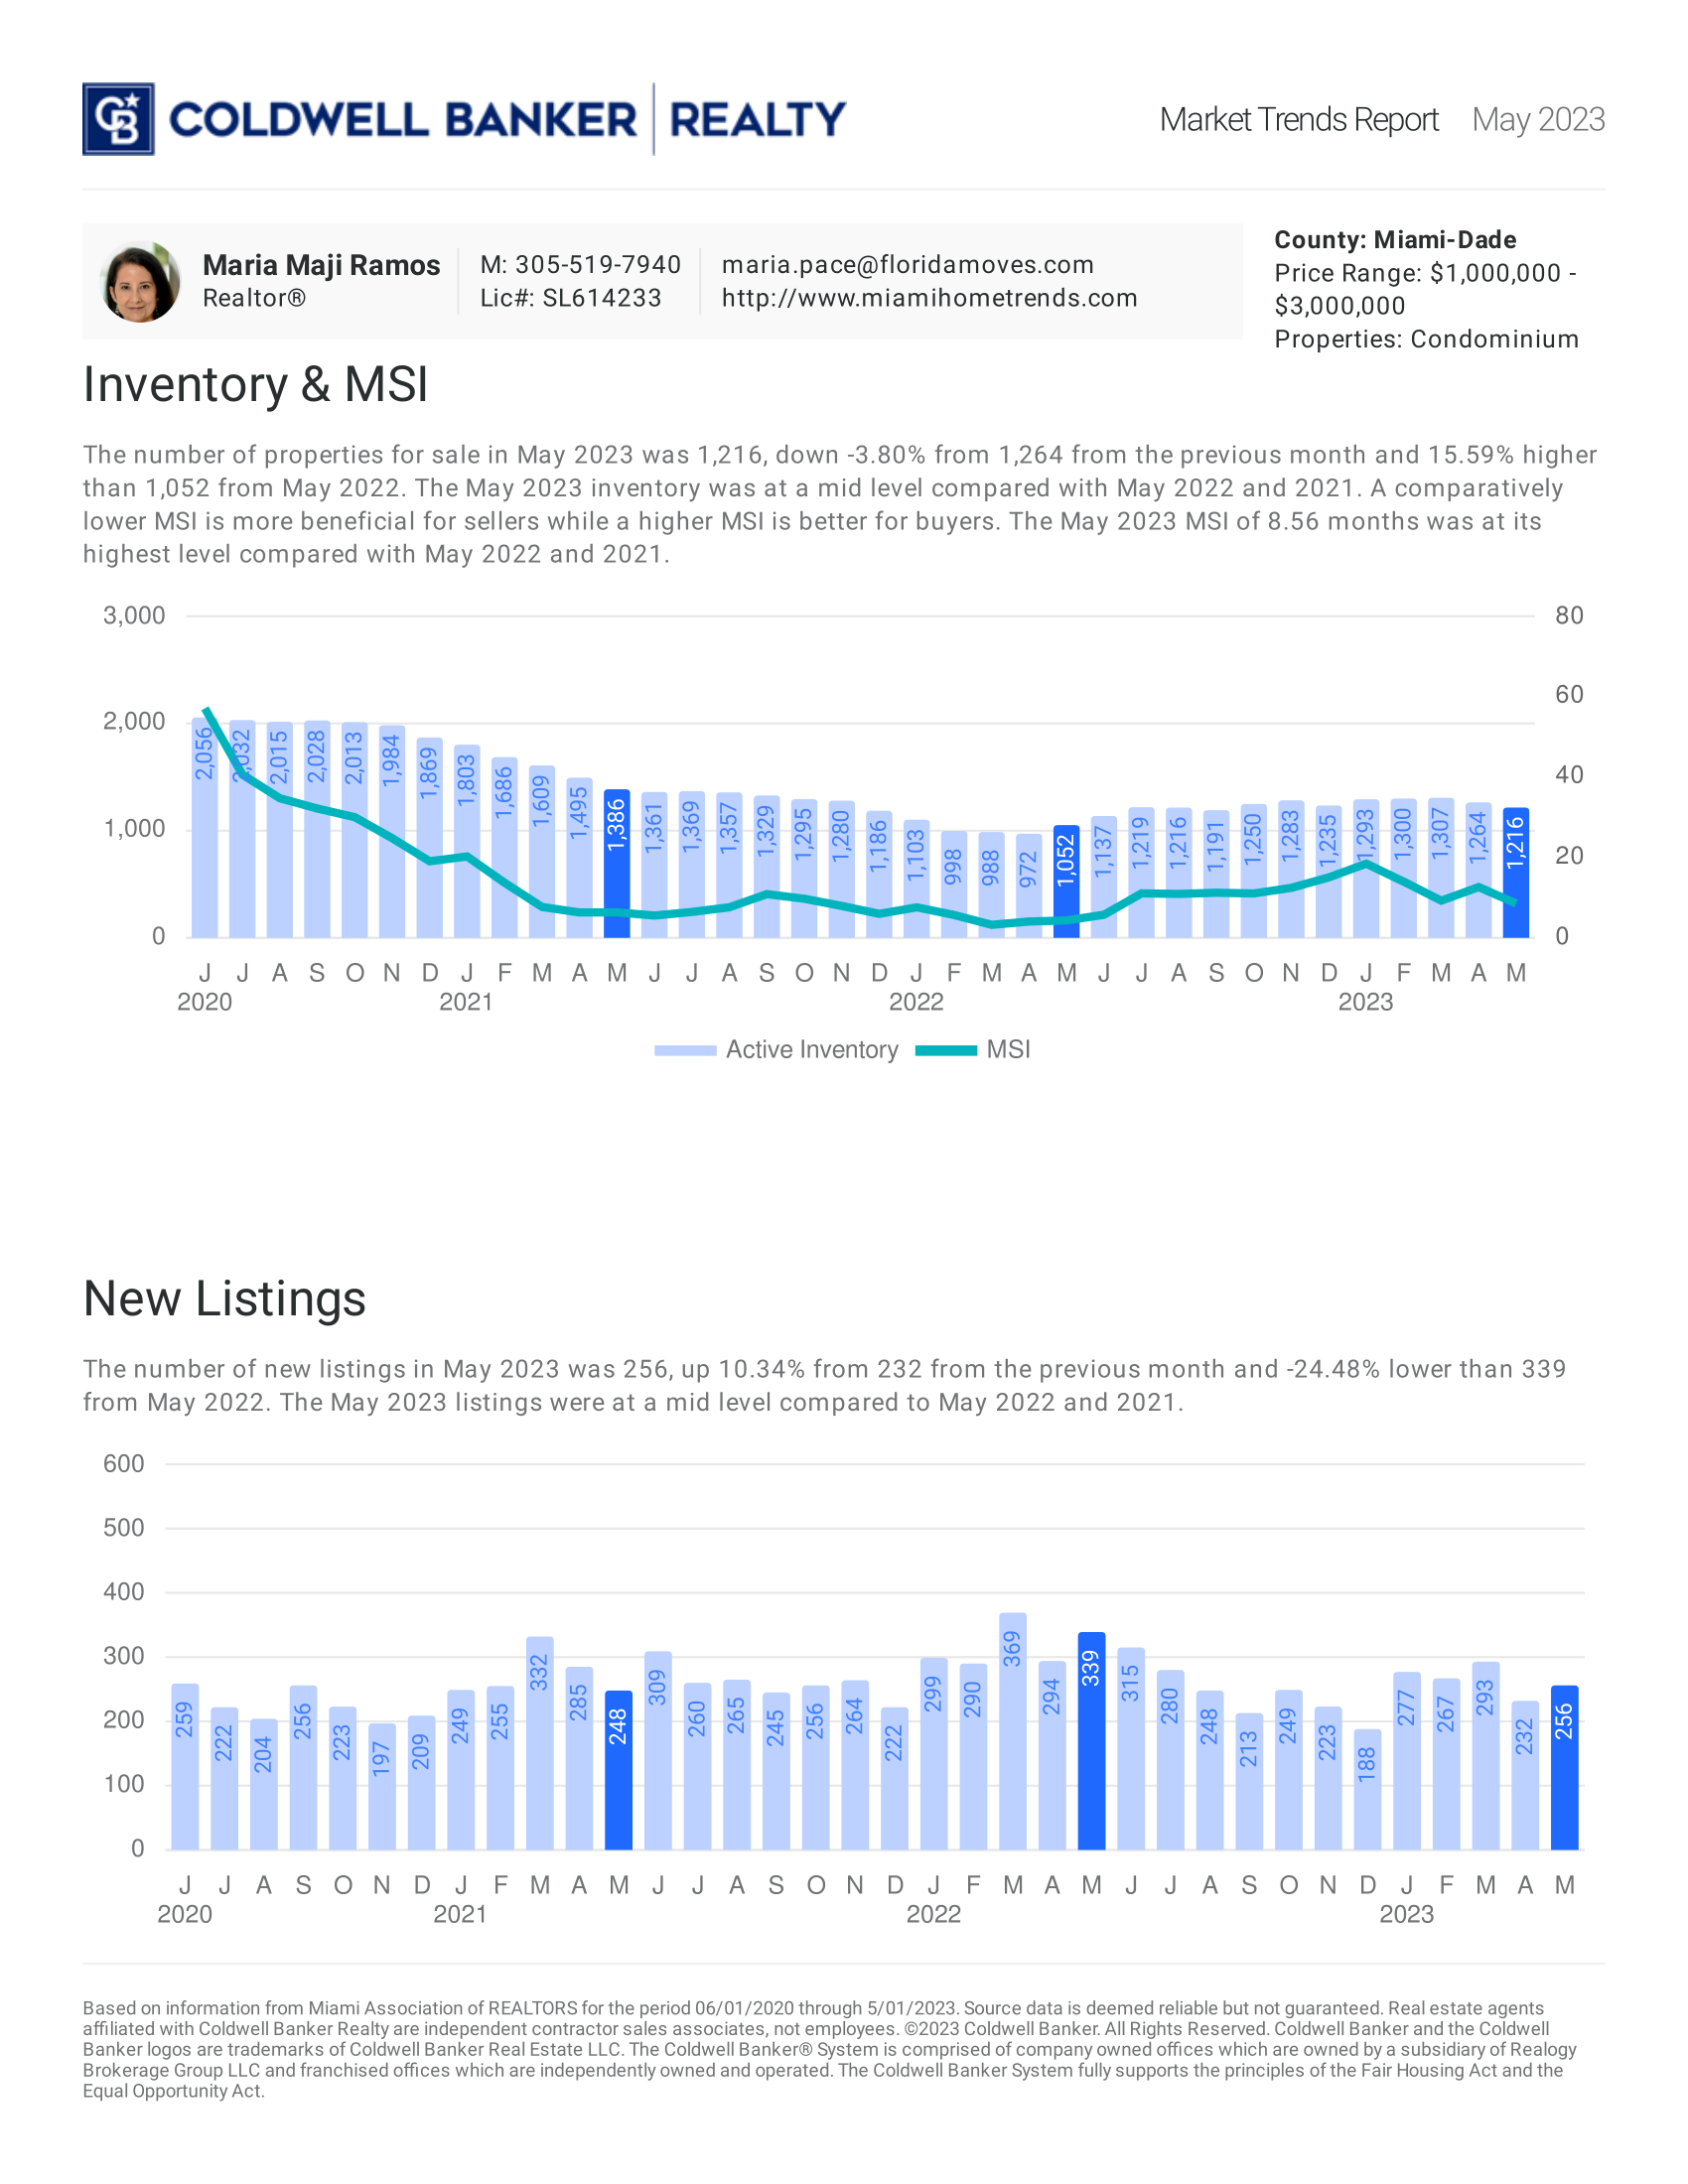
May 2023: Condo ($1M to $3M)

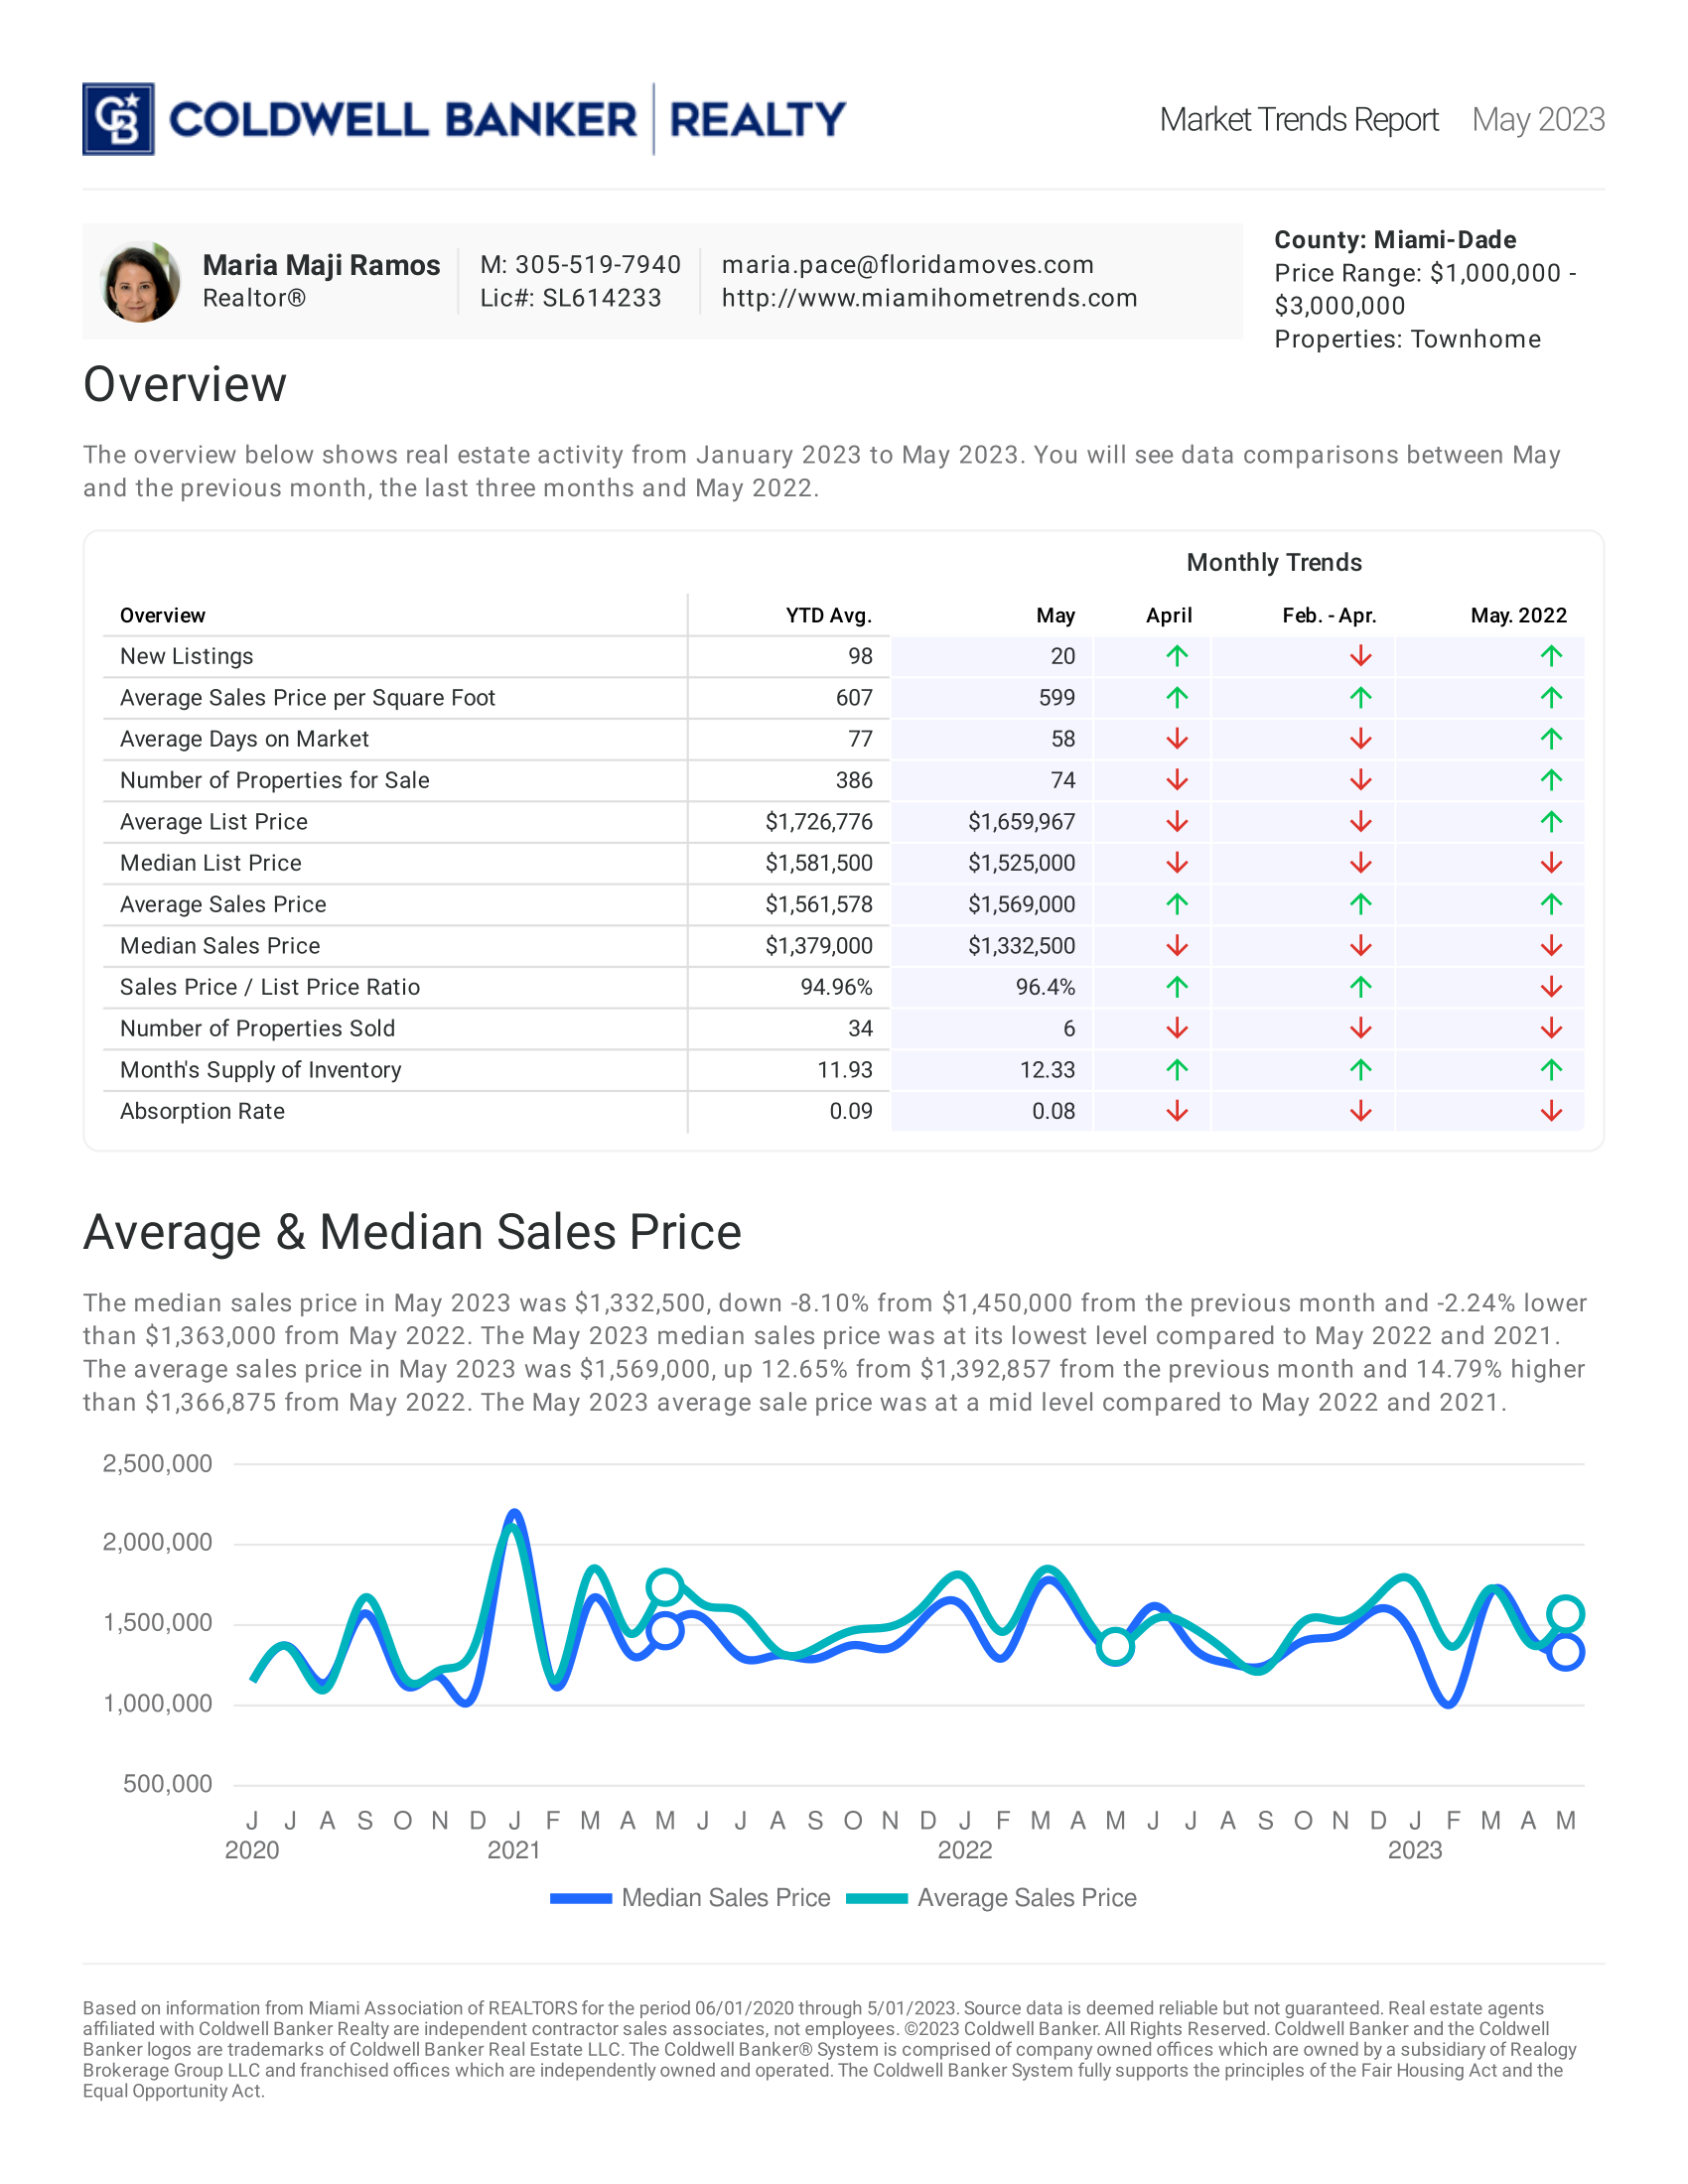
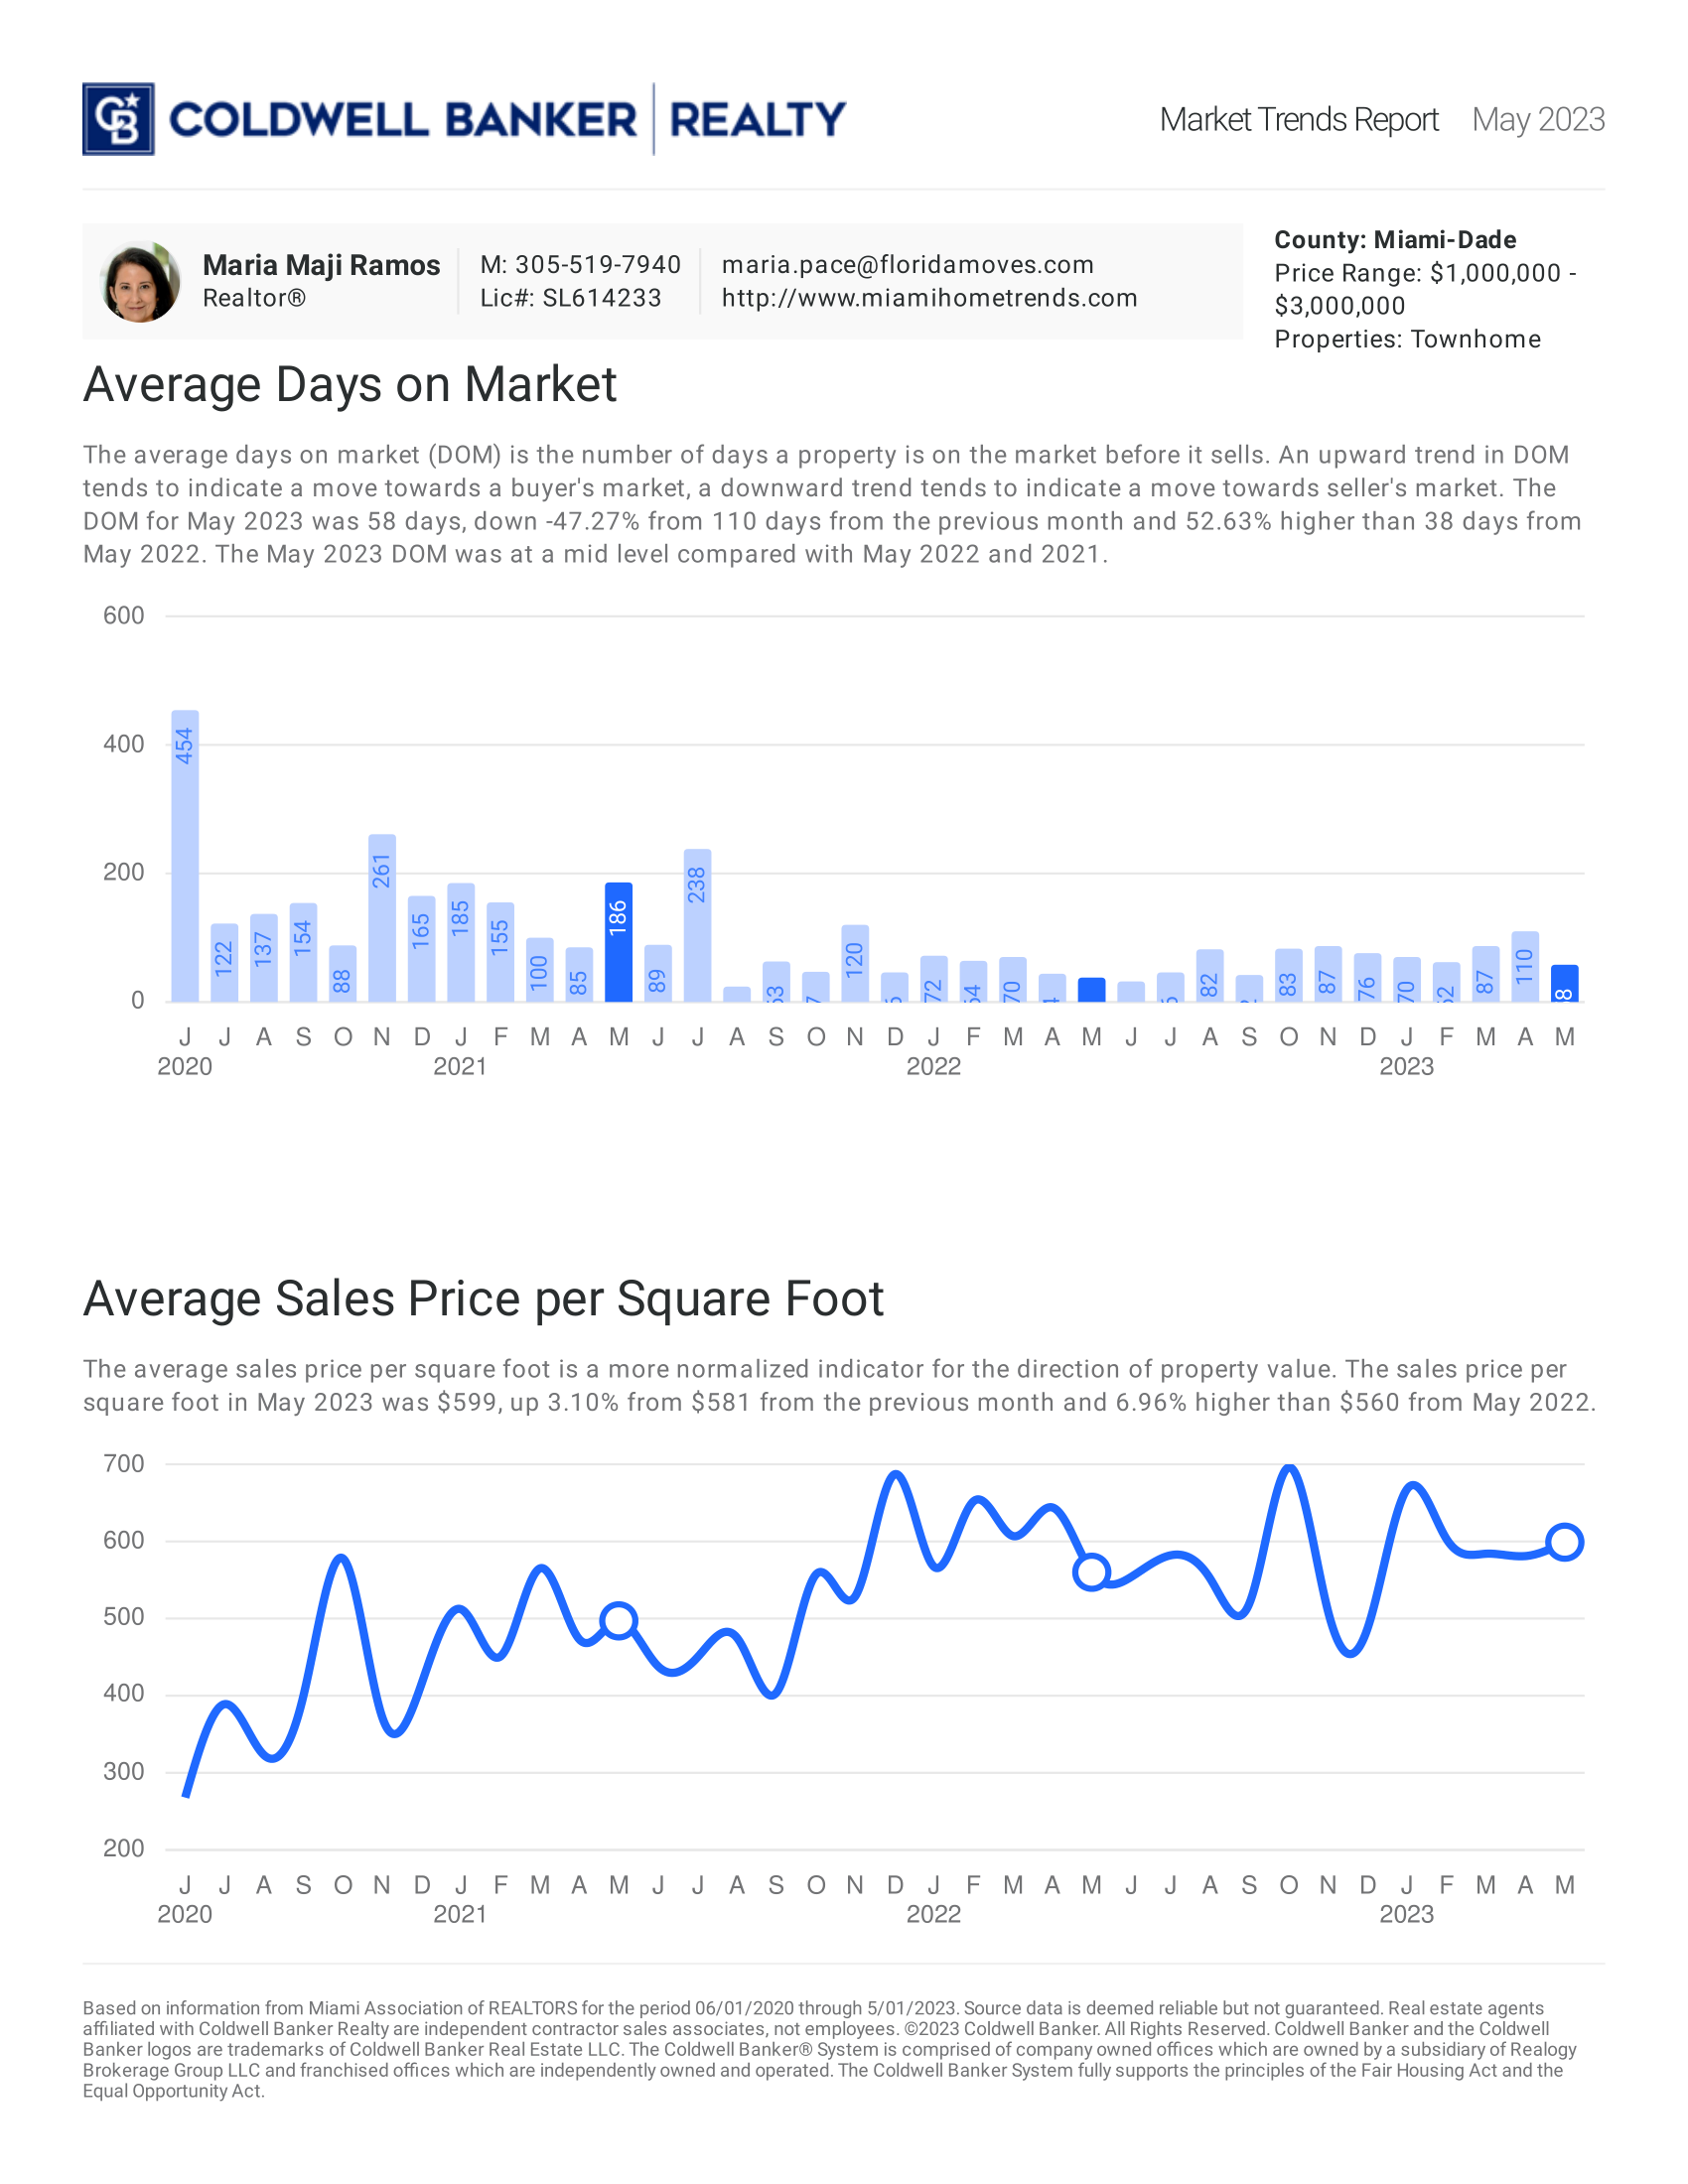
May 2023: Townhome ($1M to $3M)


April 2023: Single Family

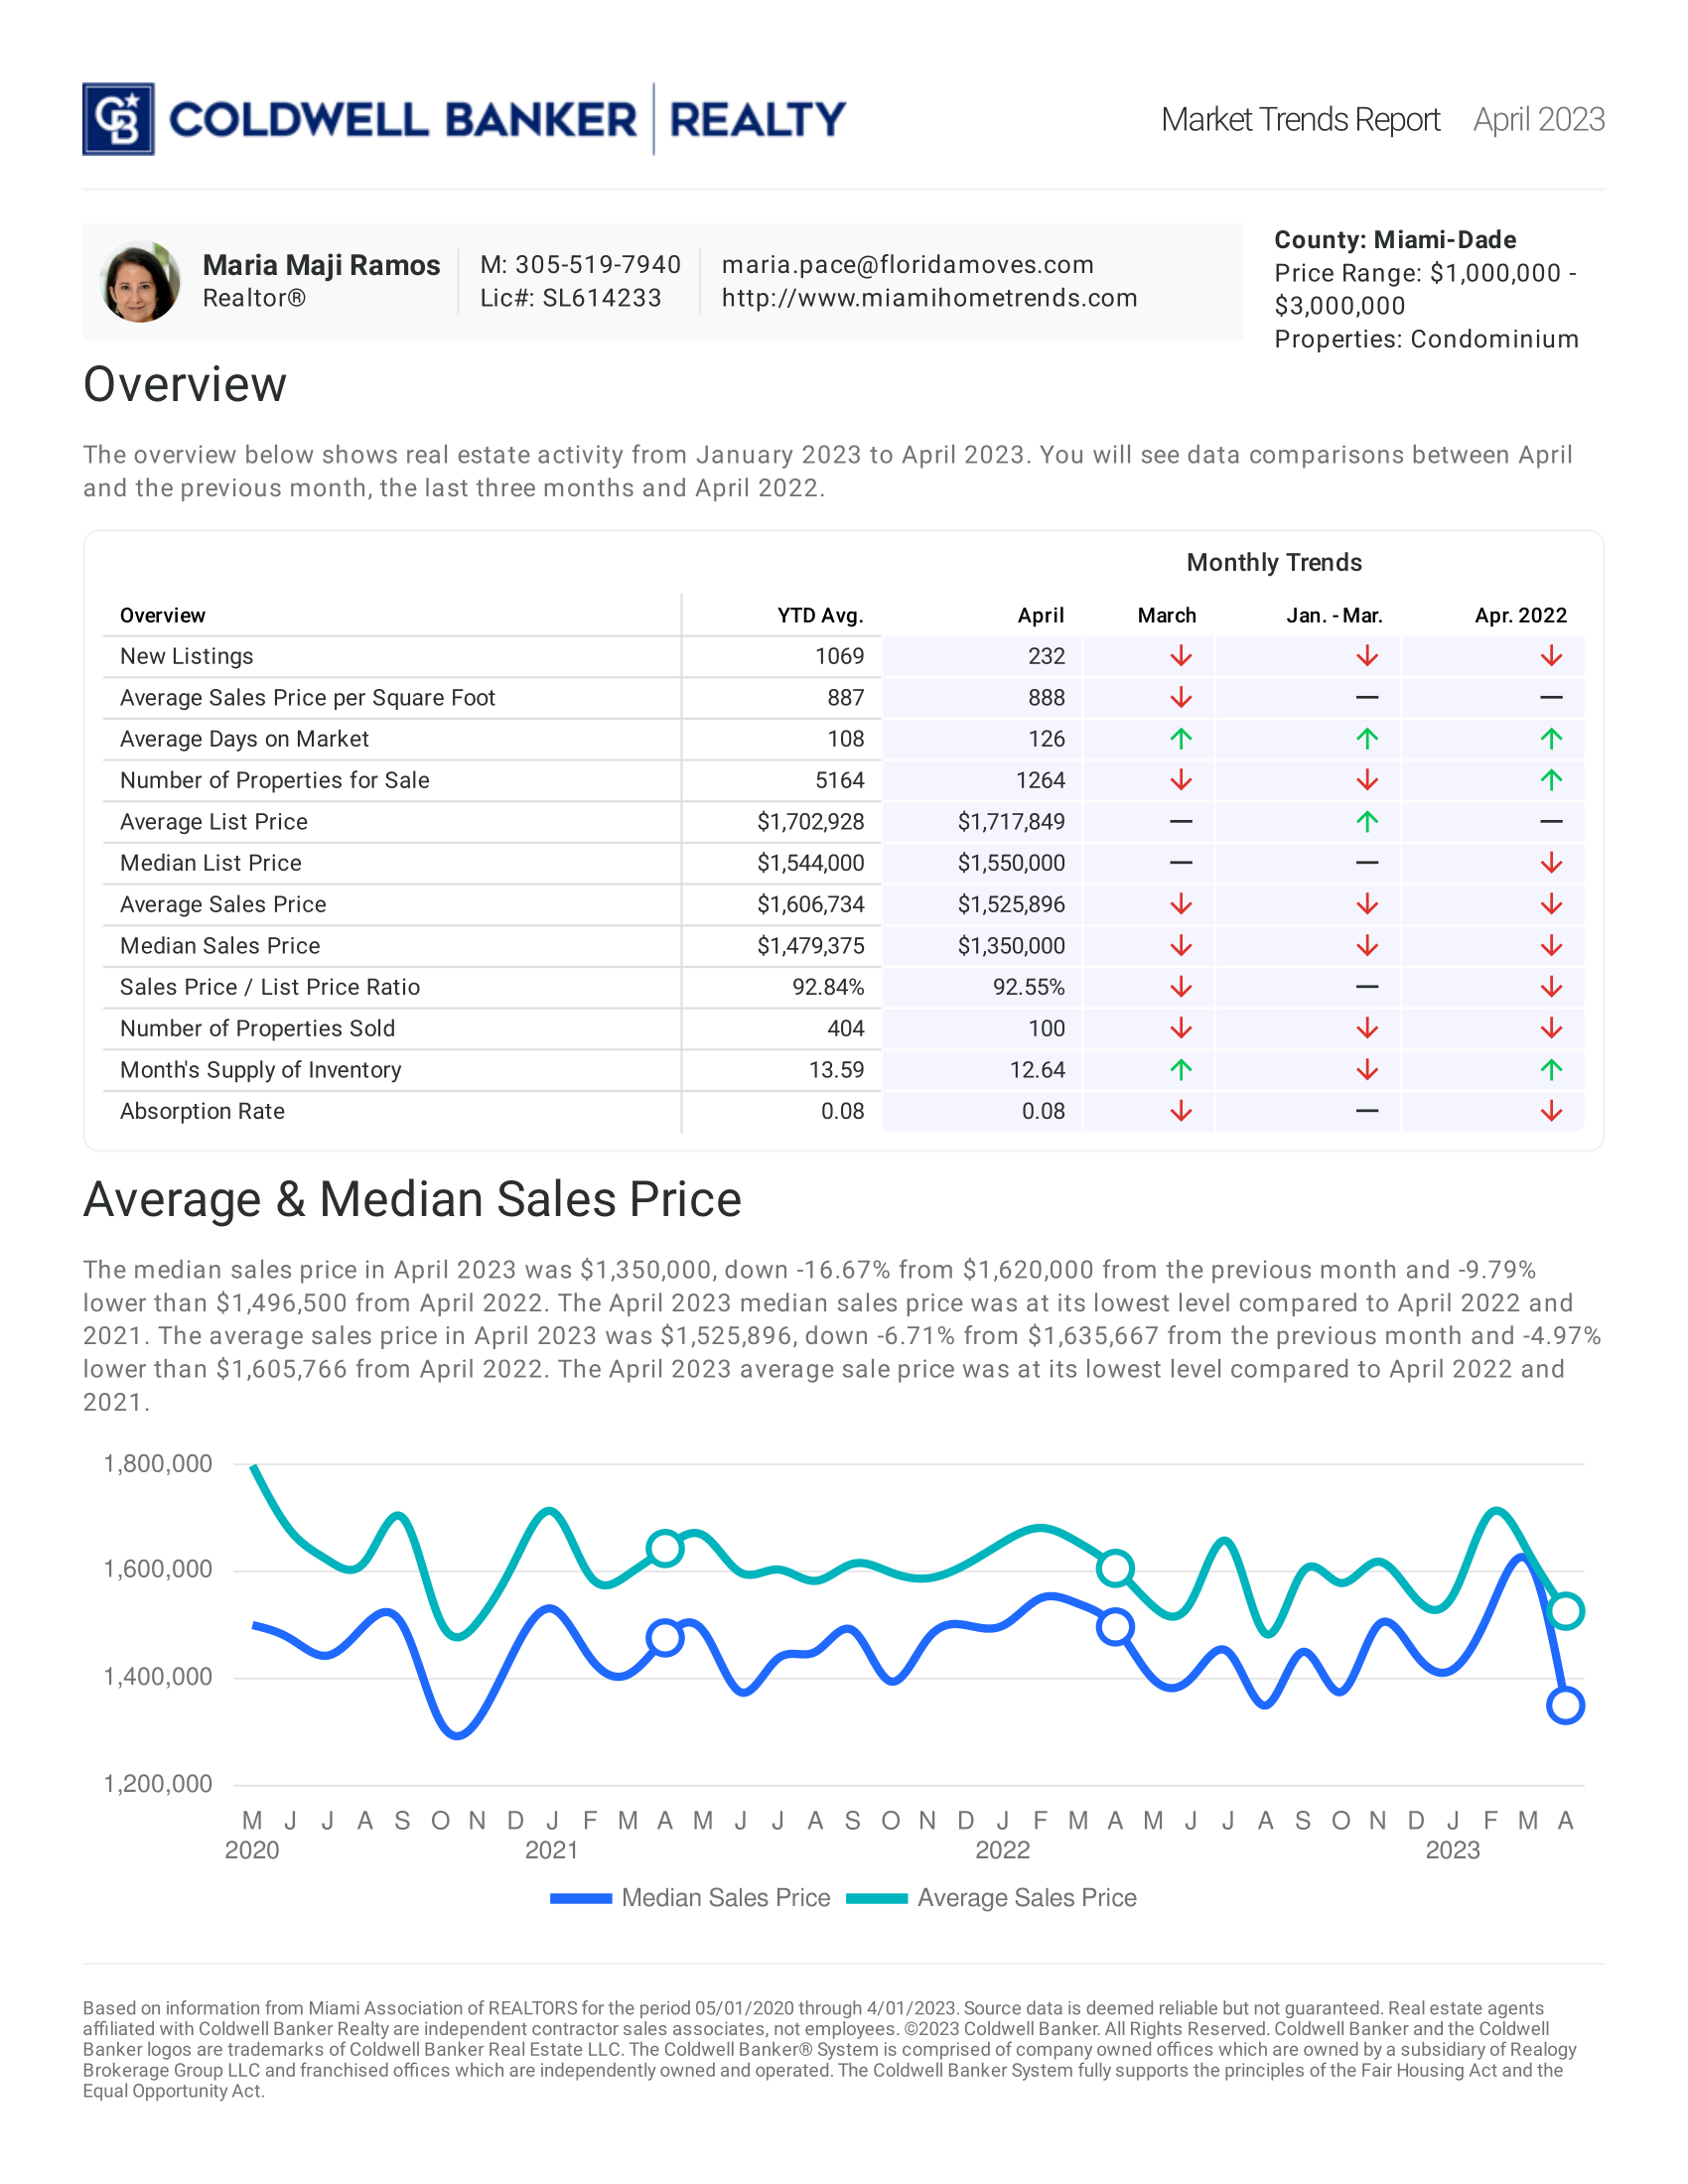
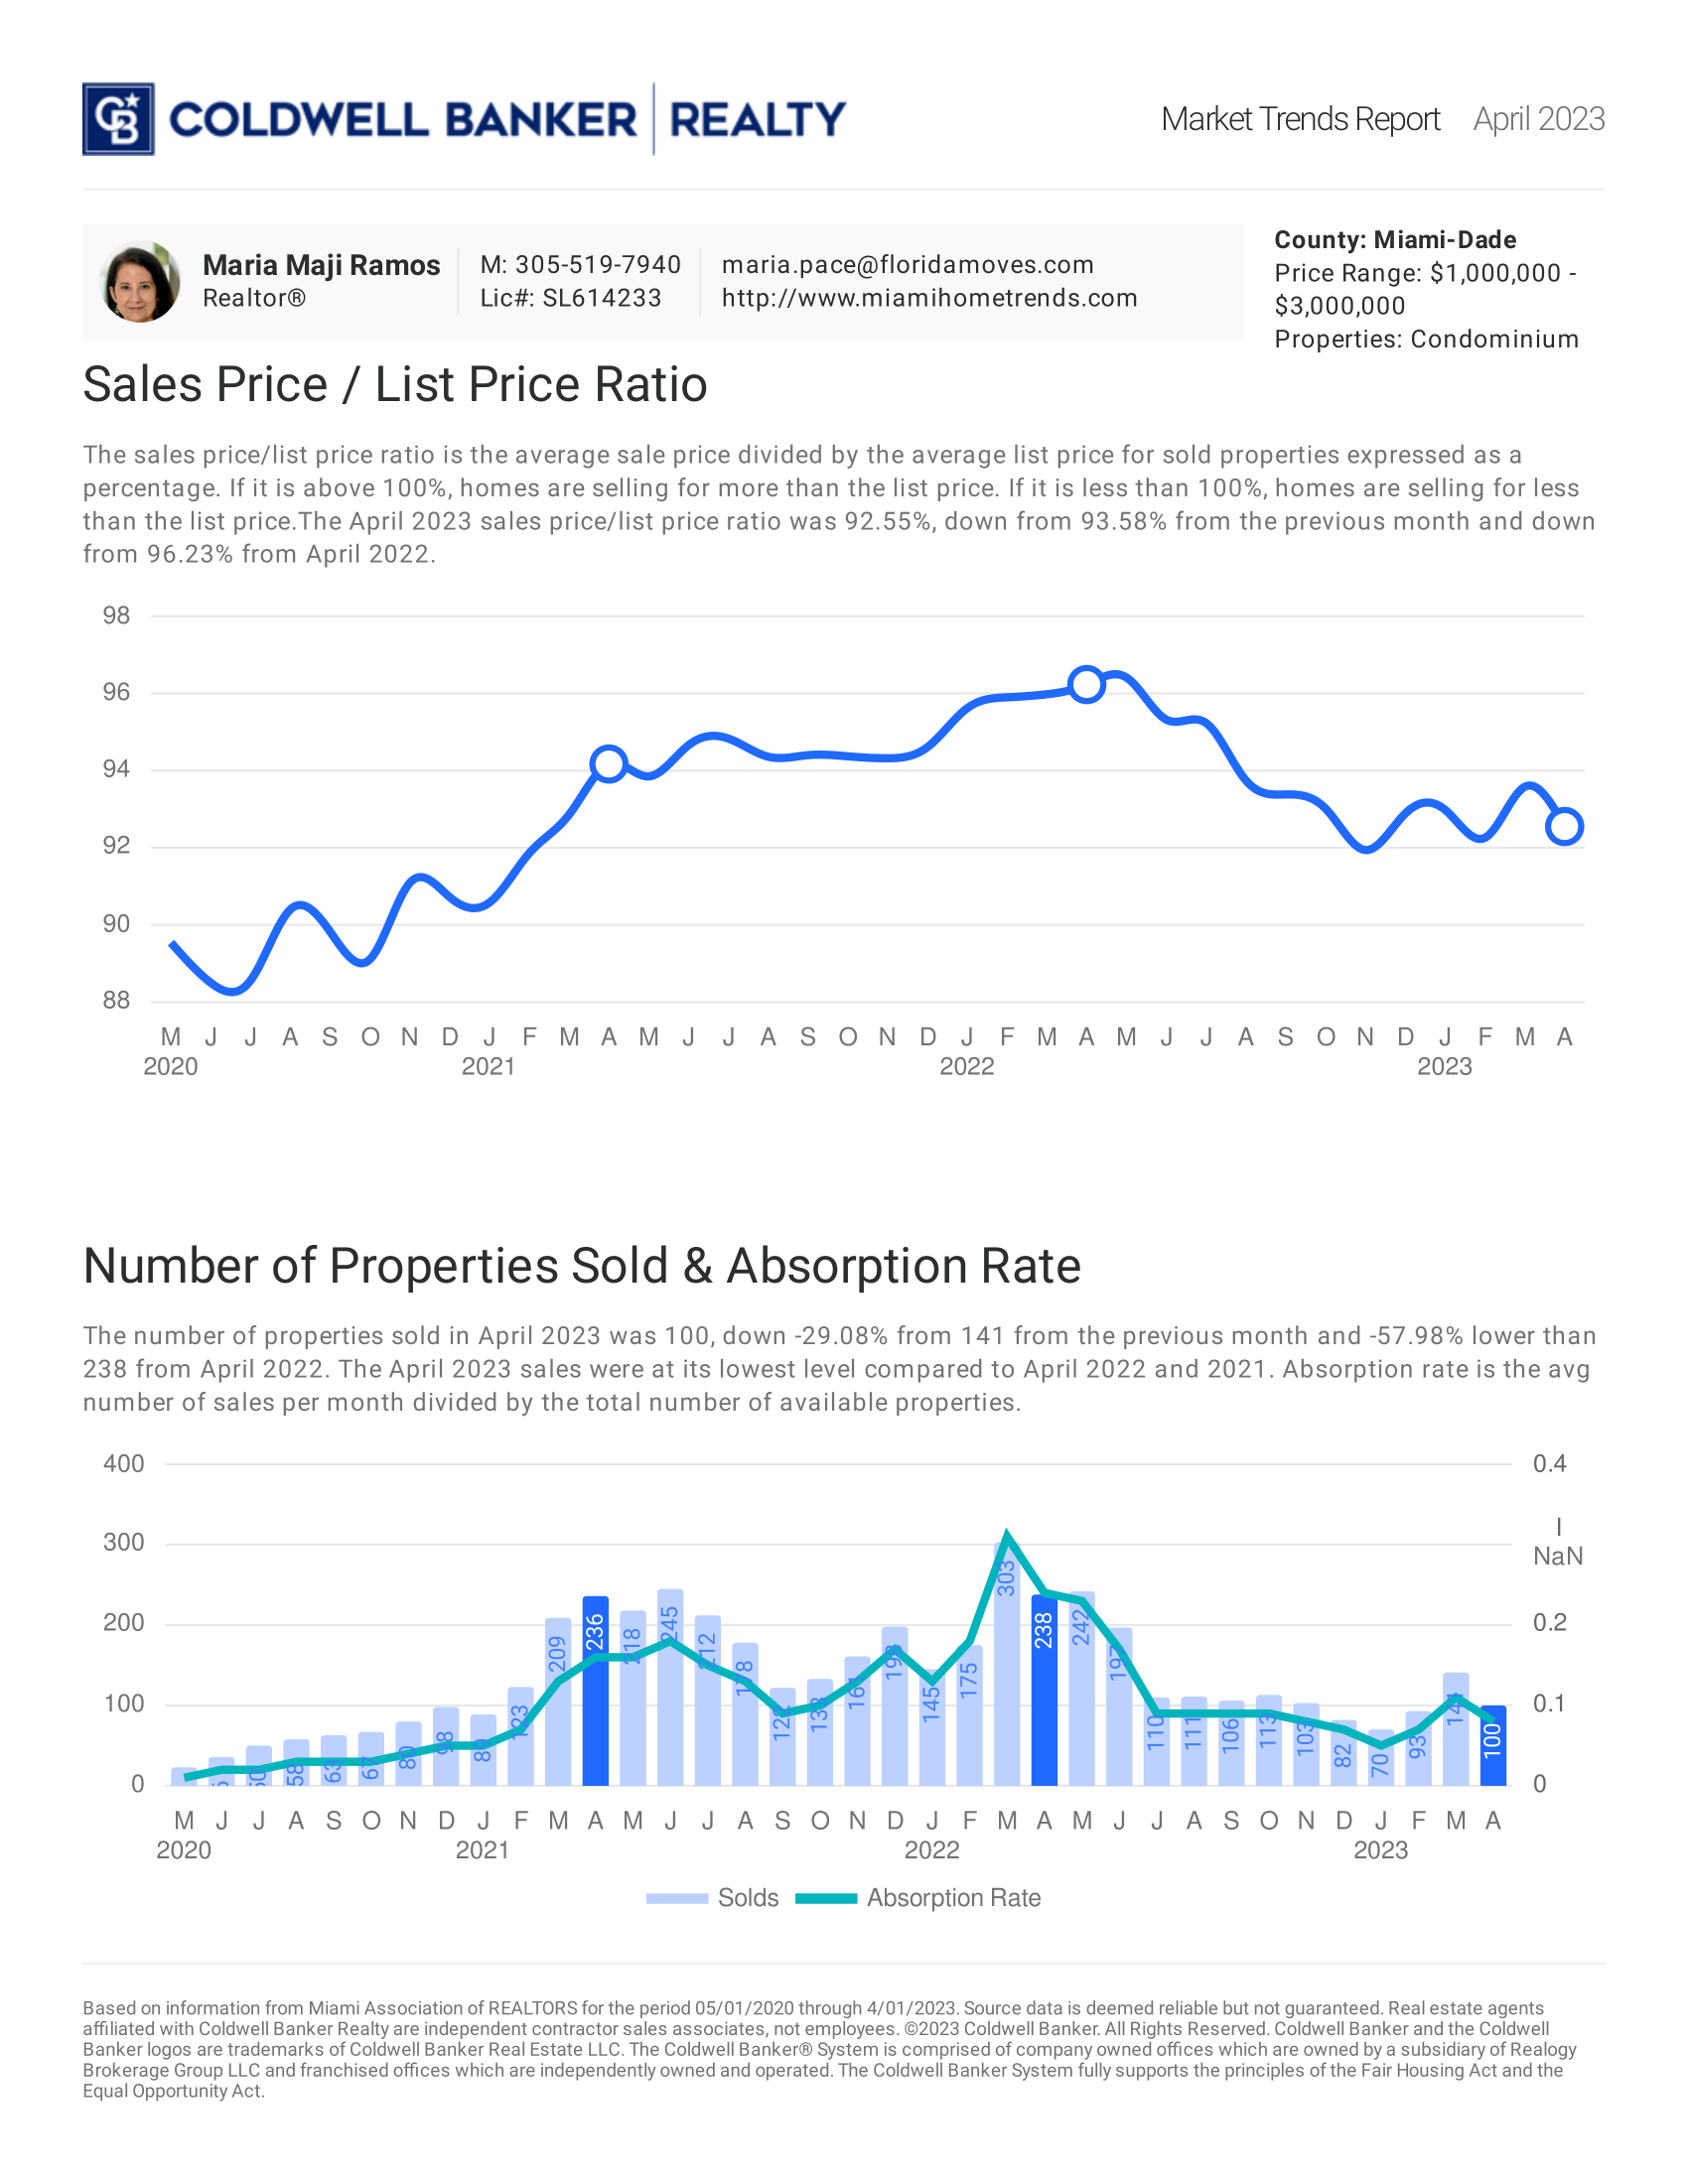
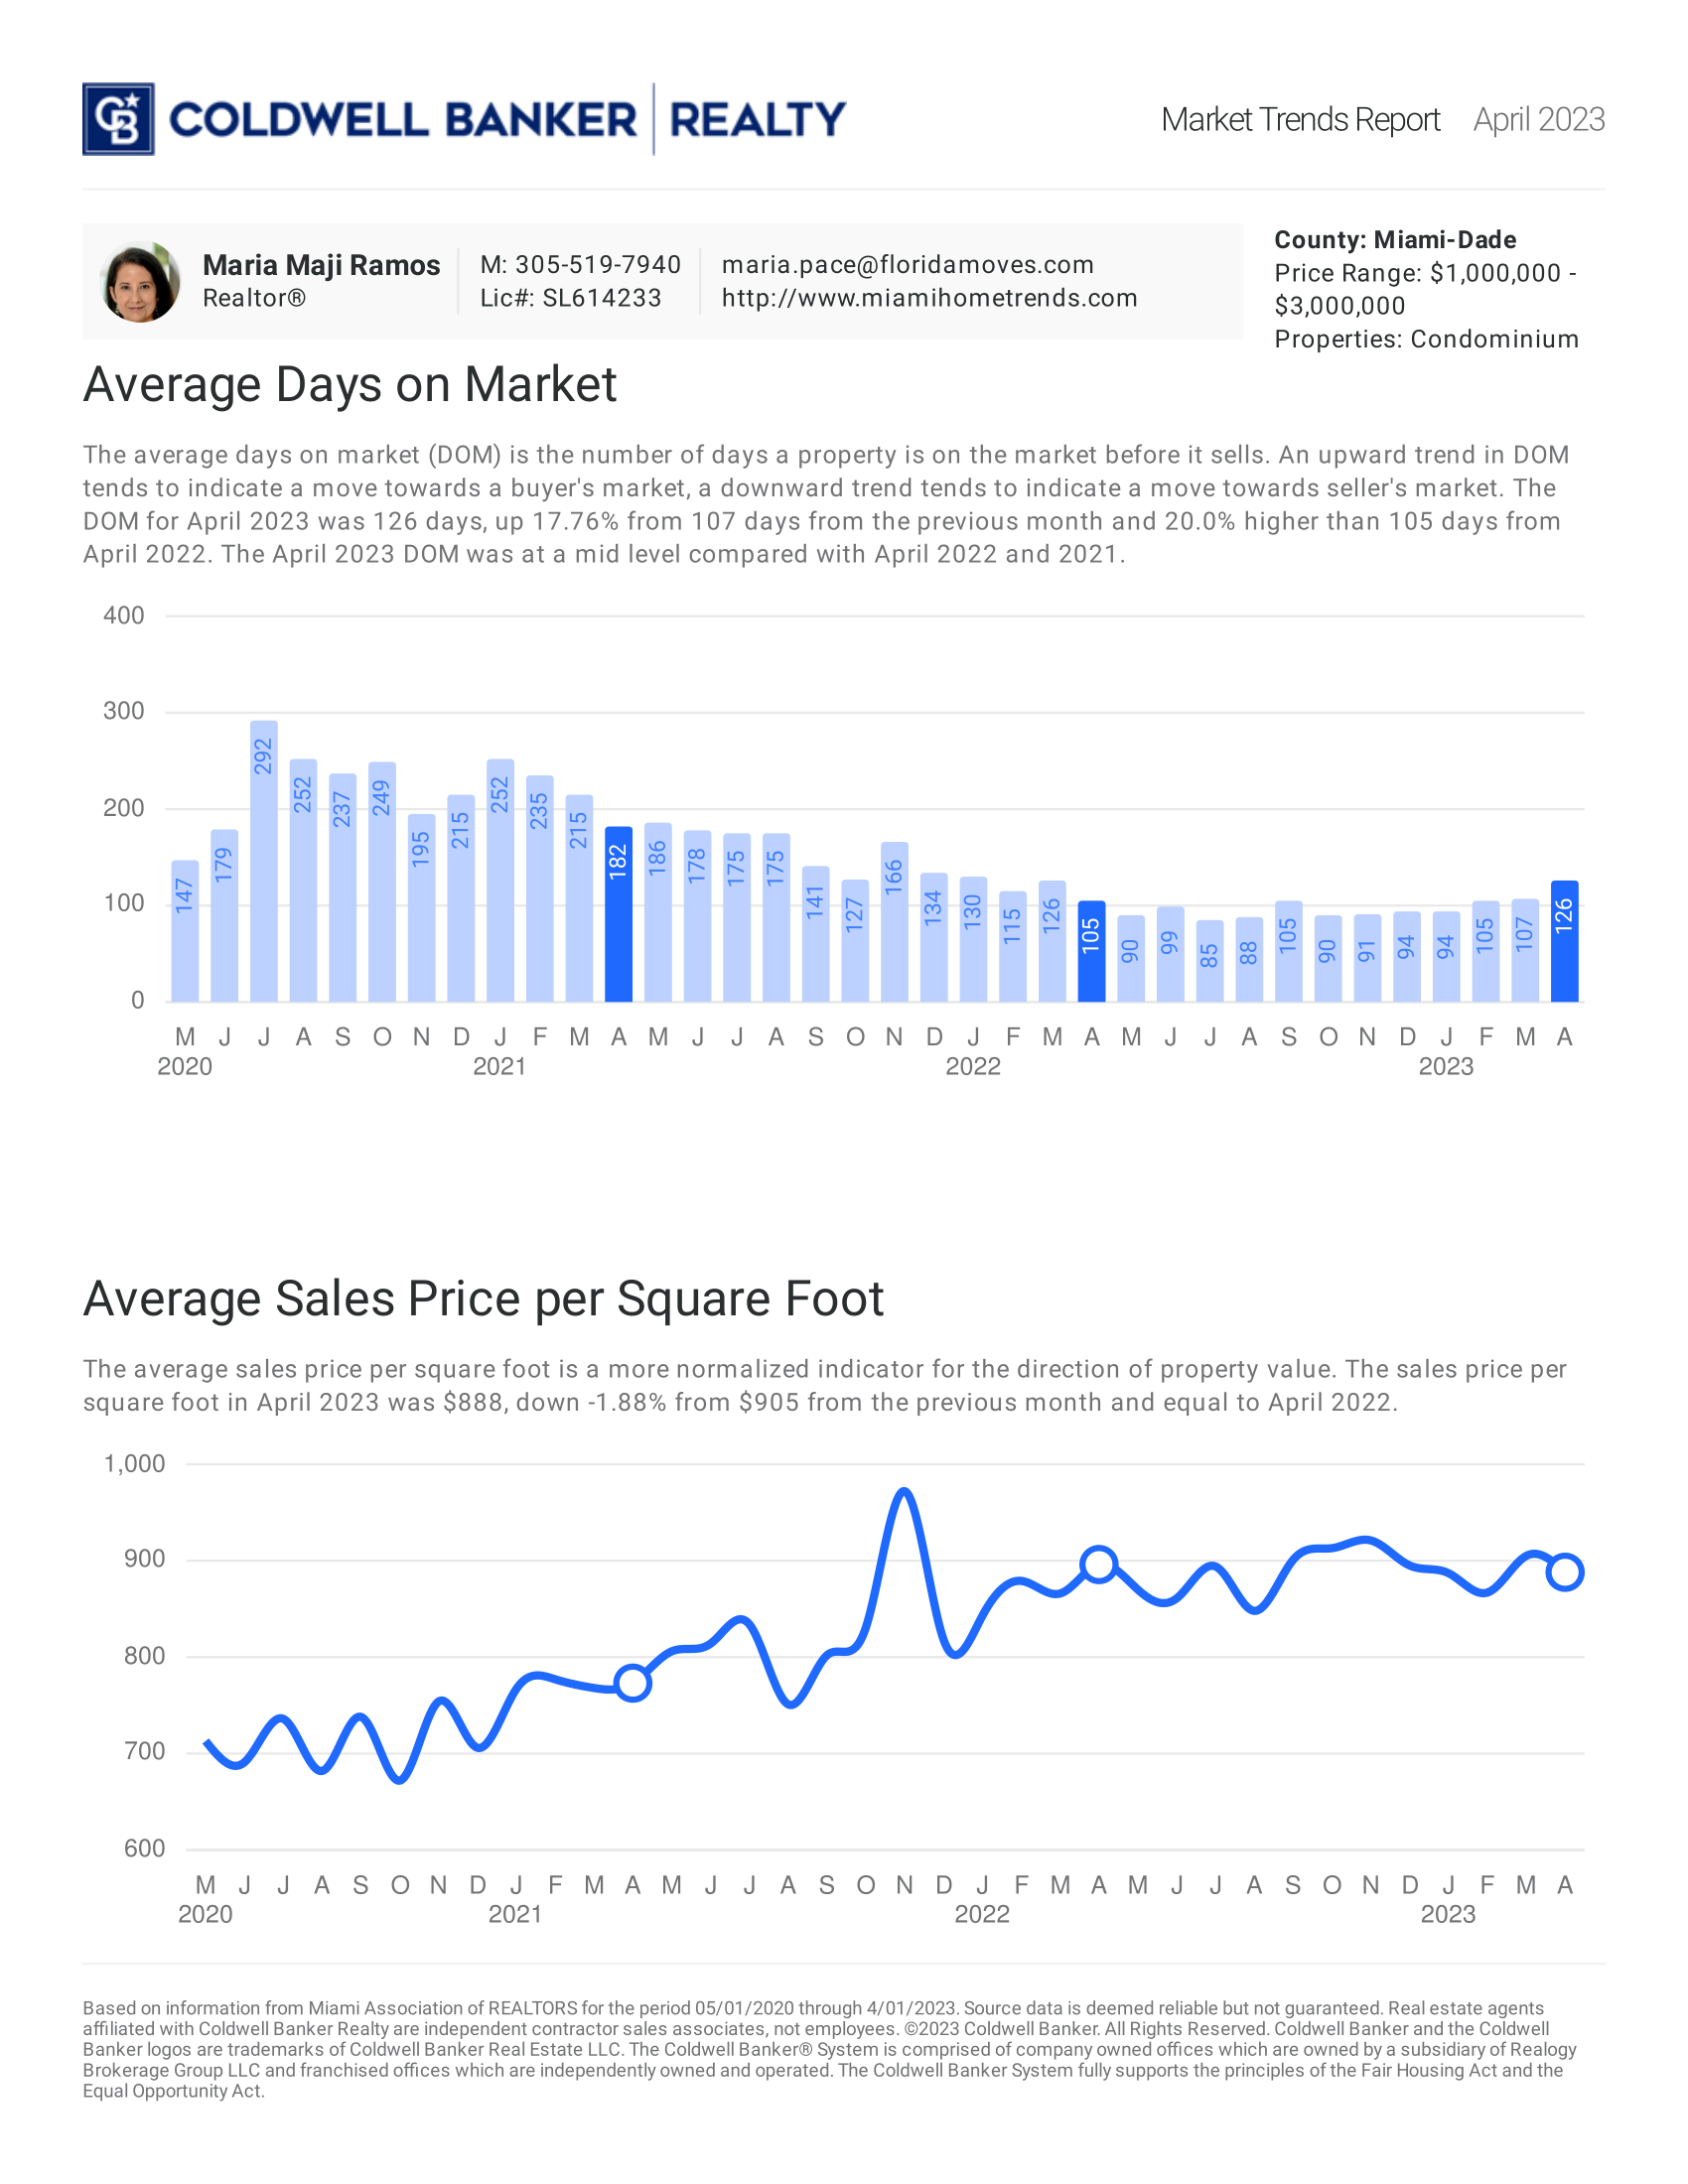
April 2023: Condo


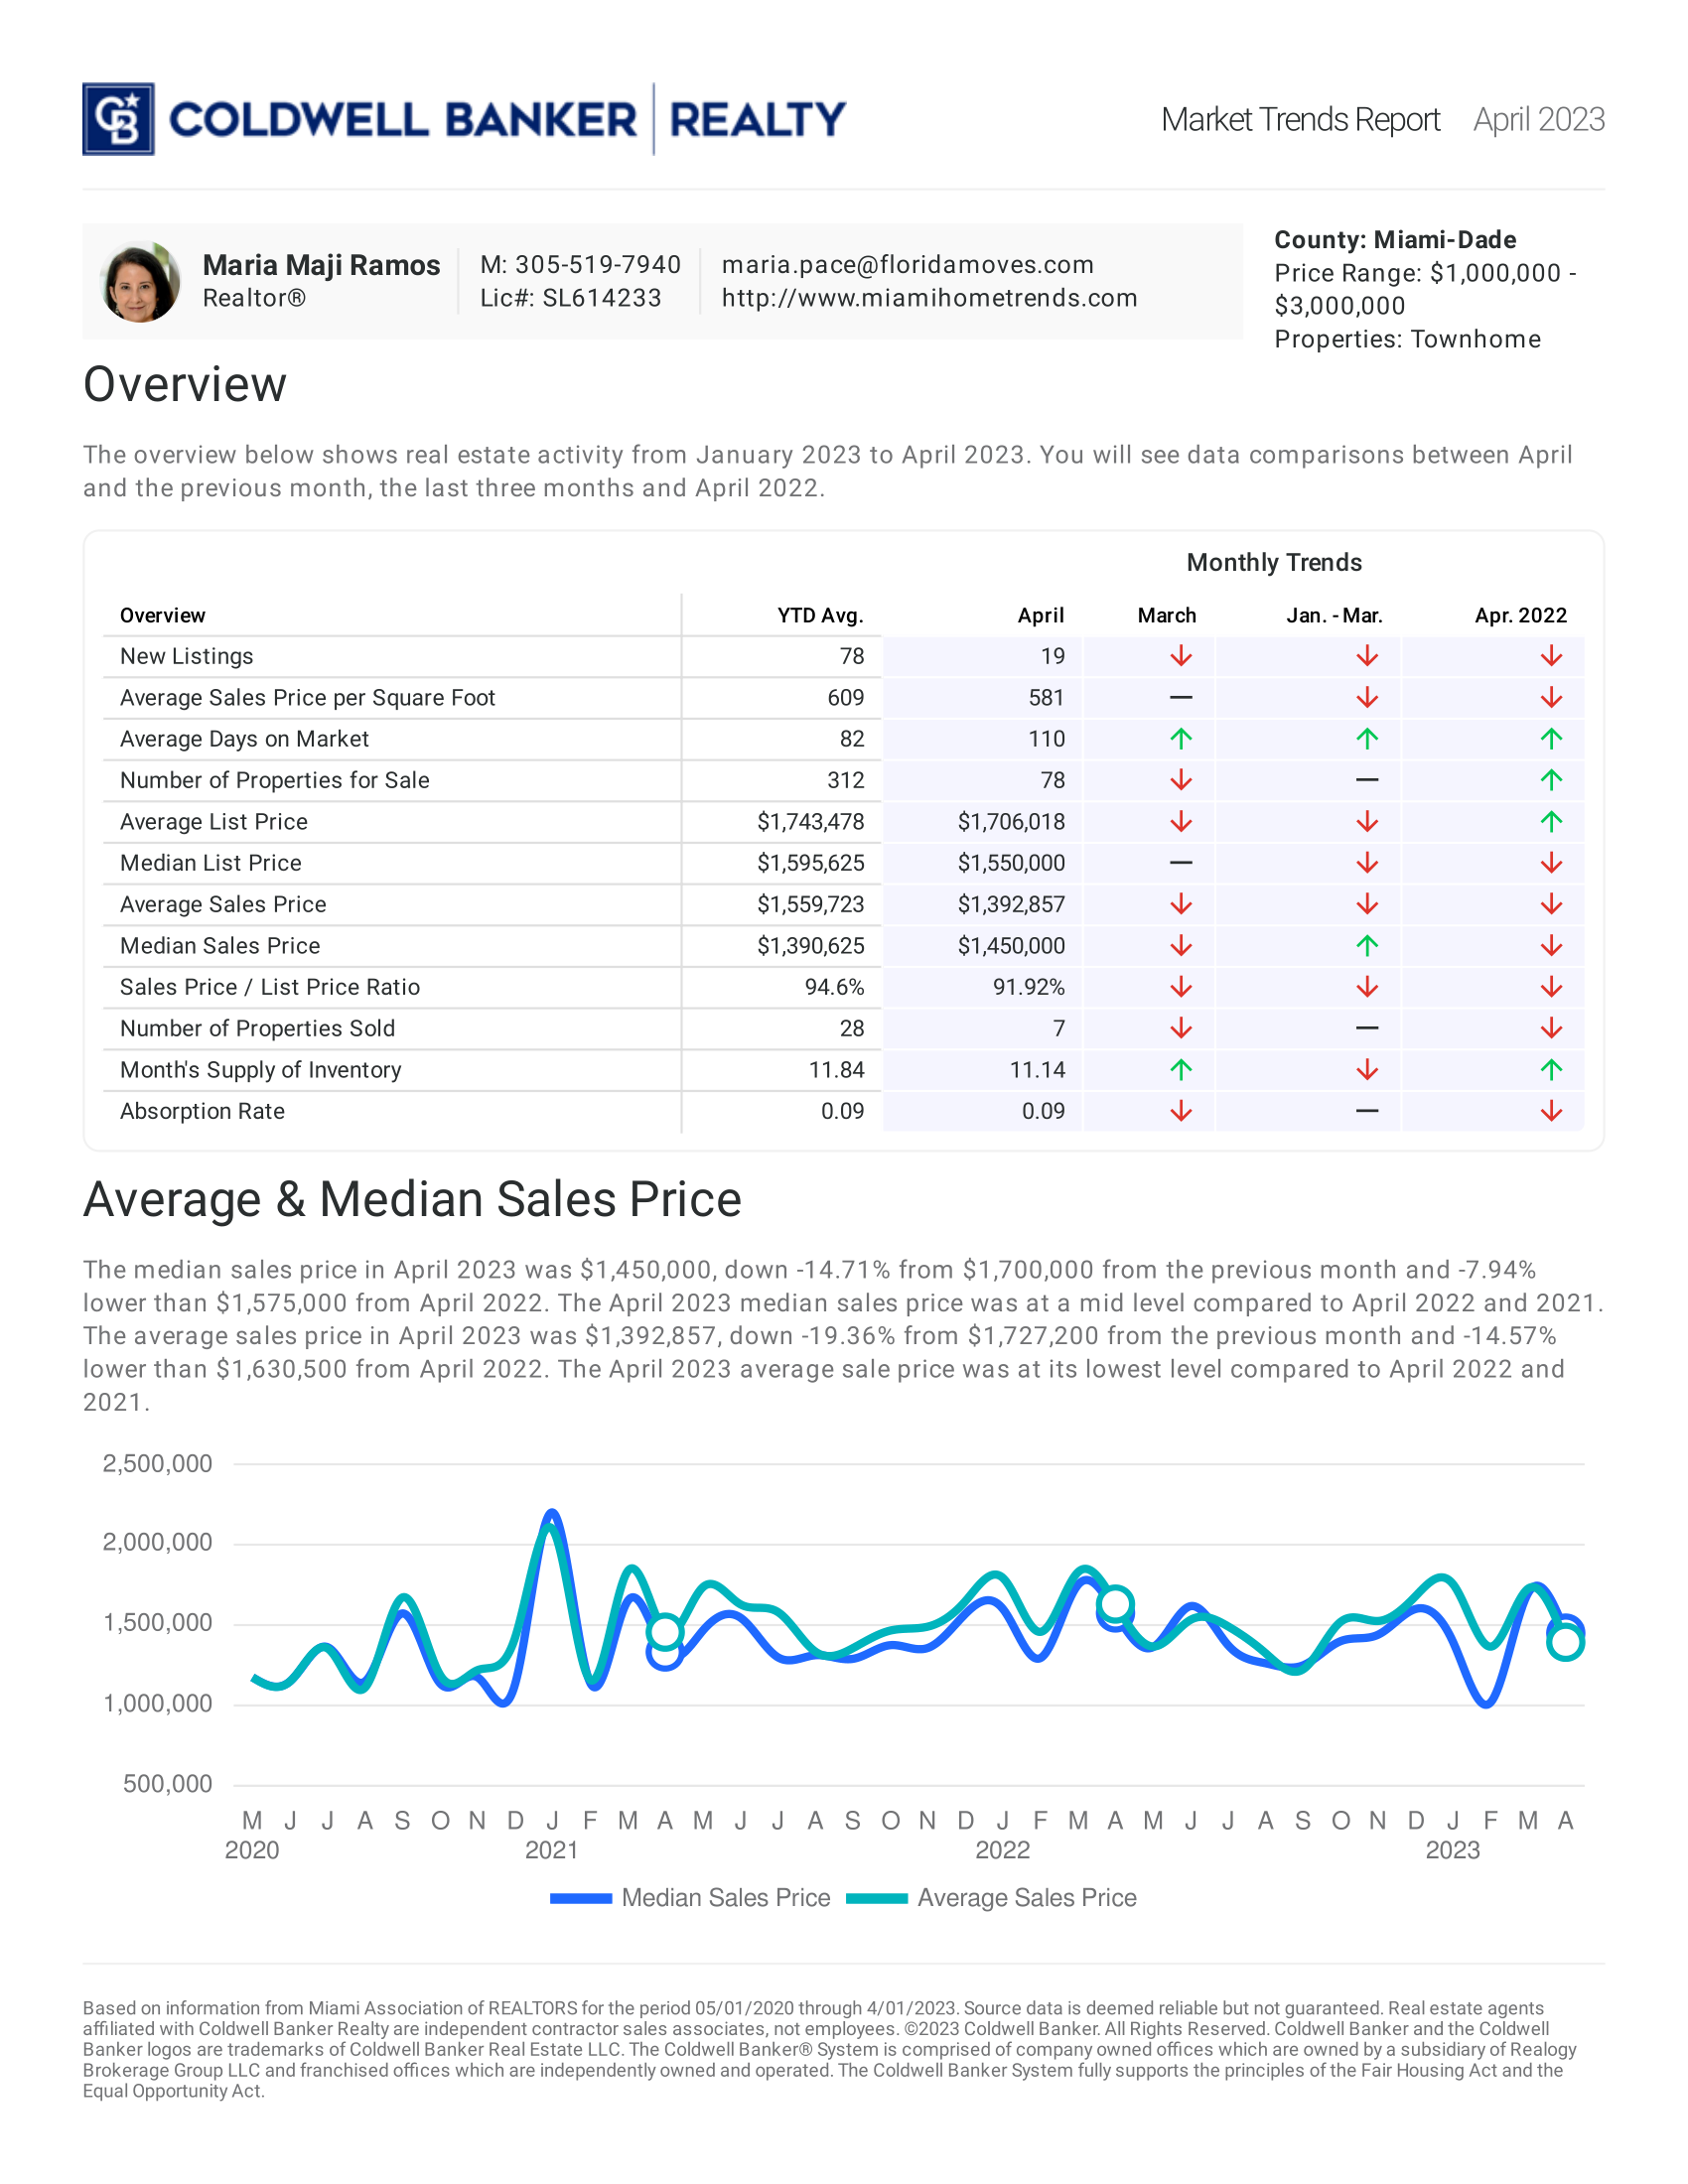
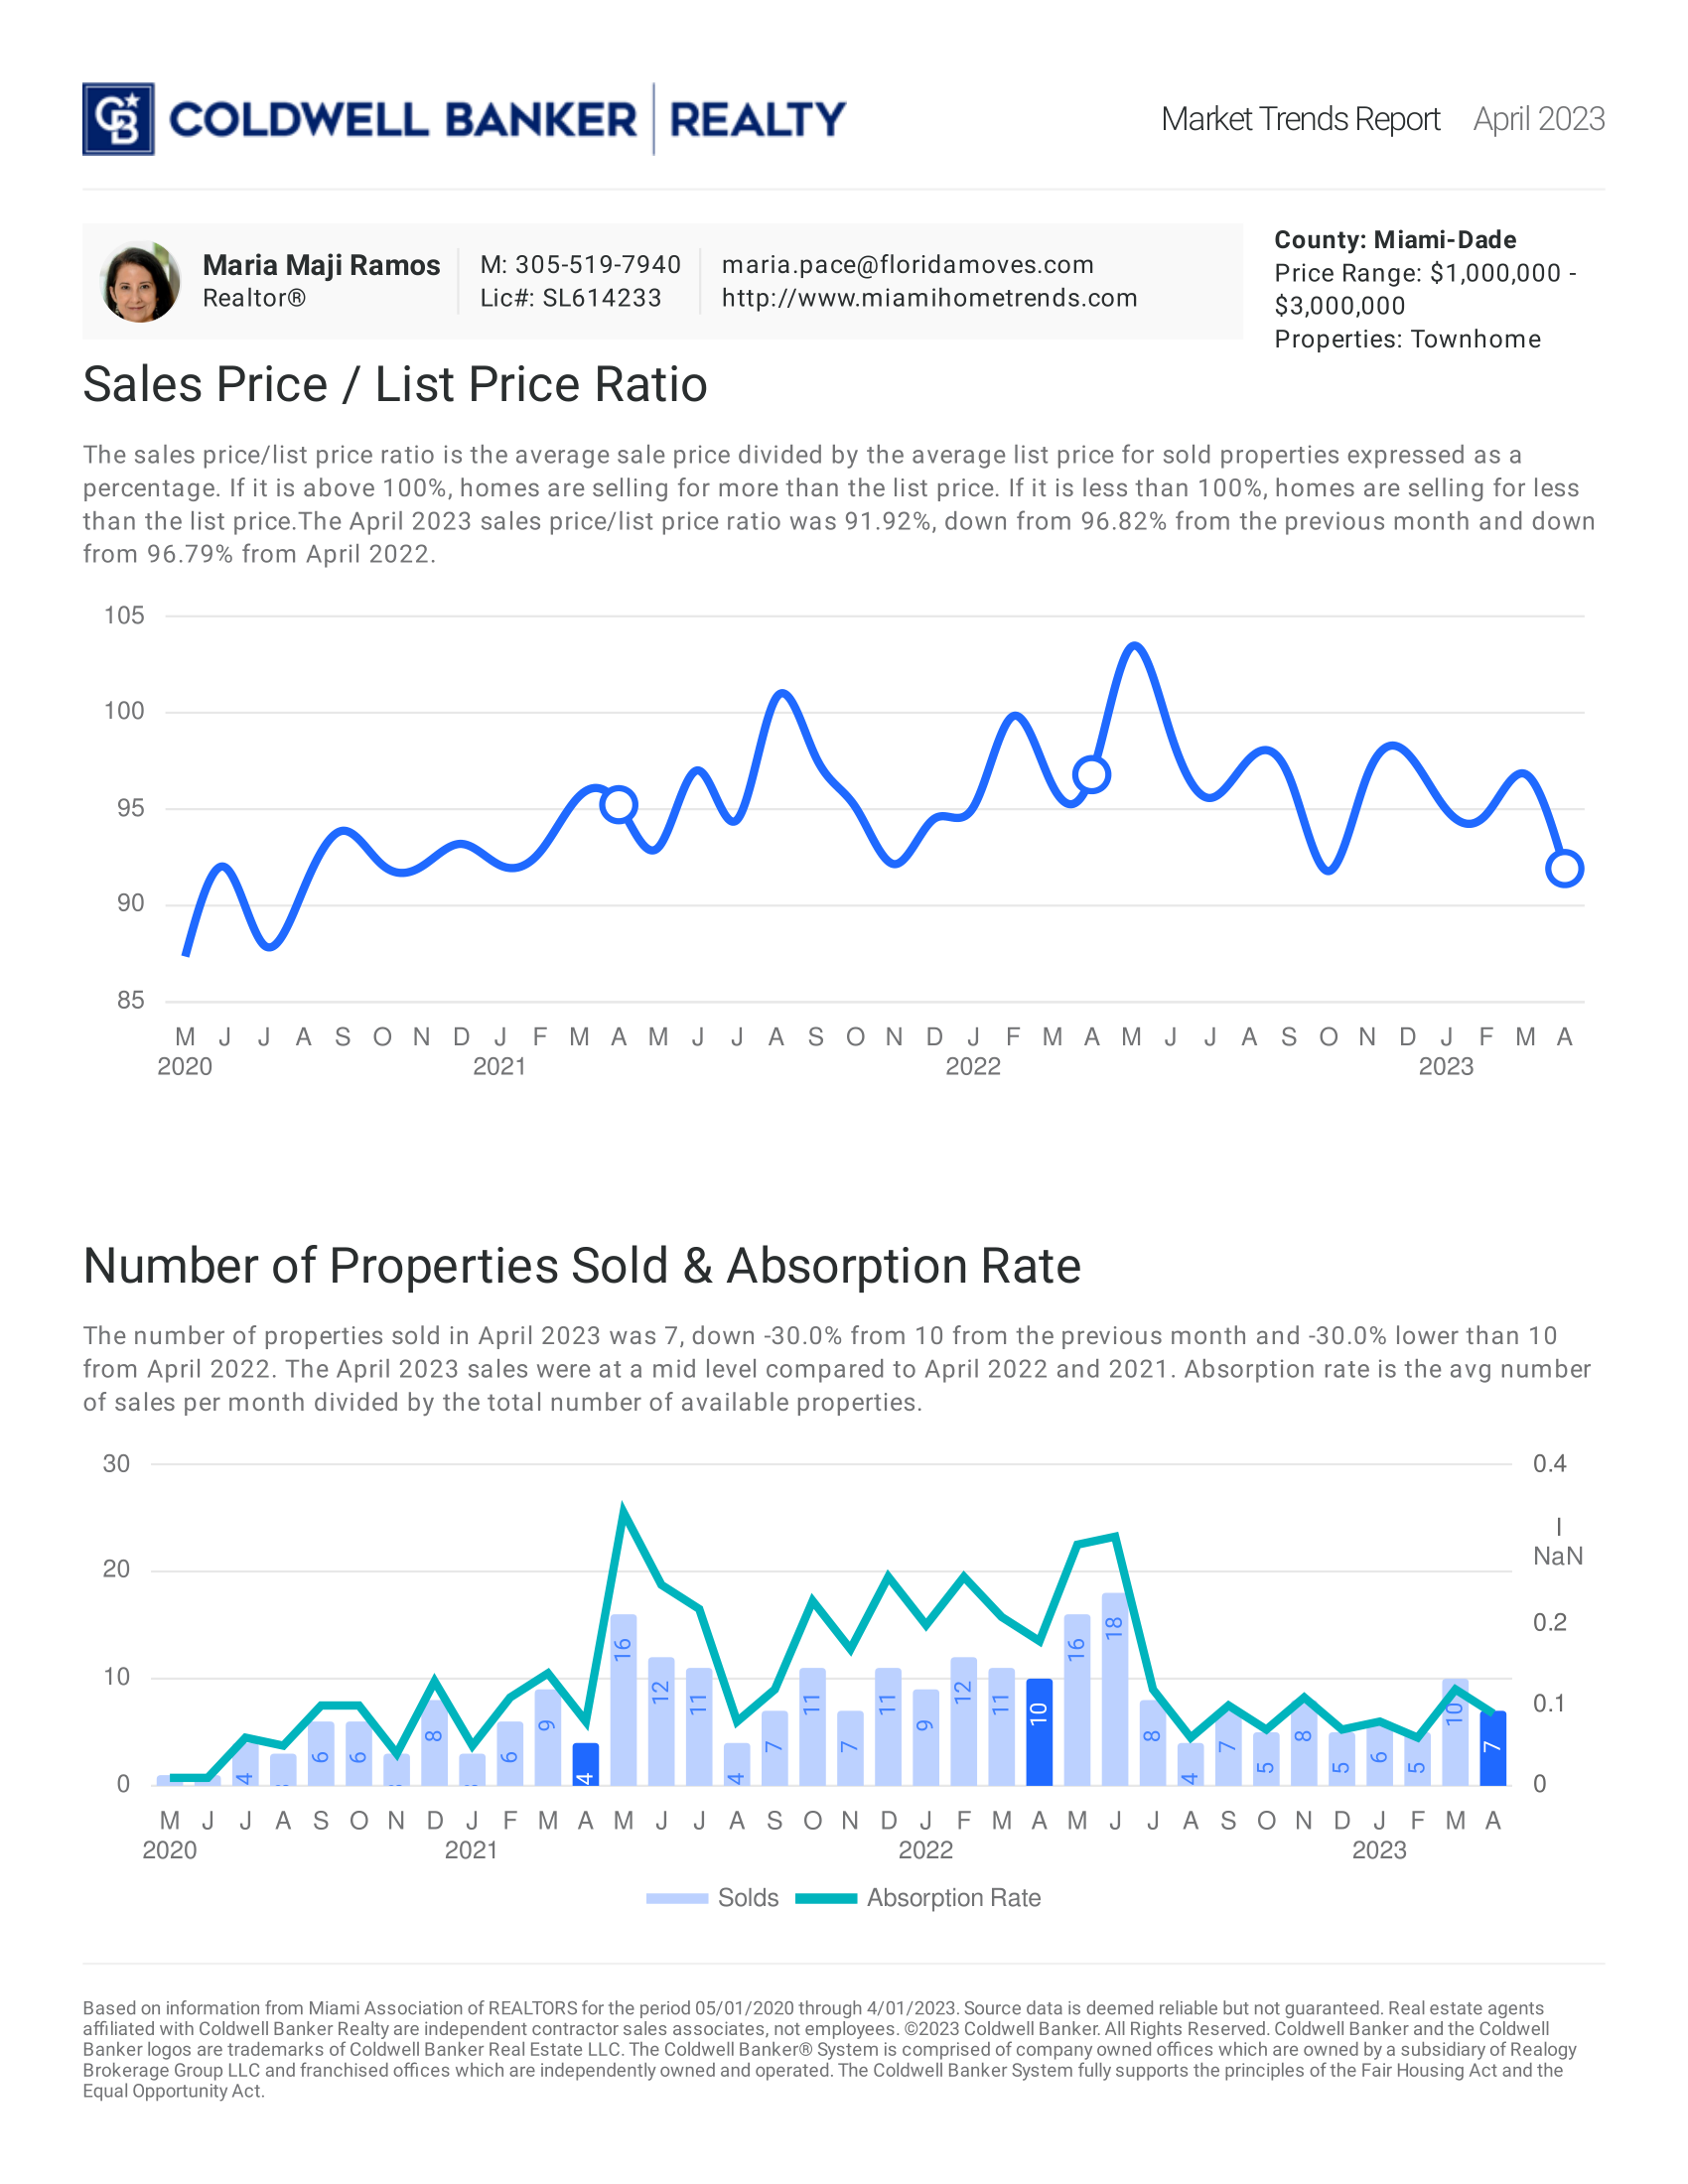
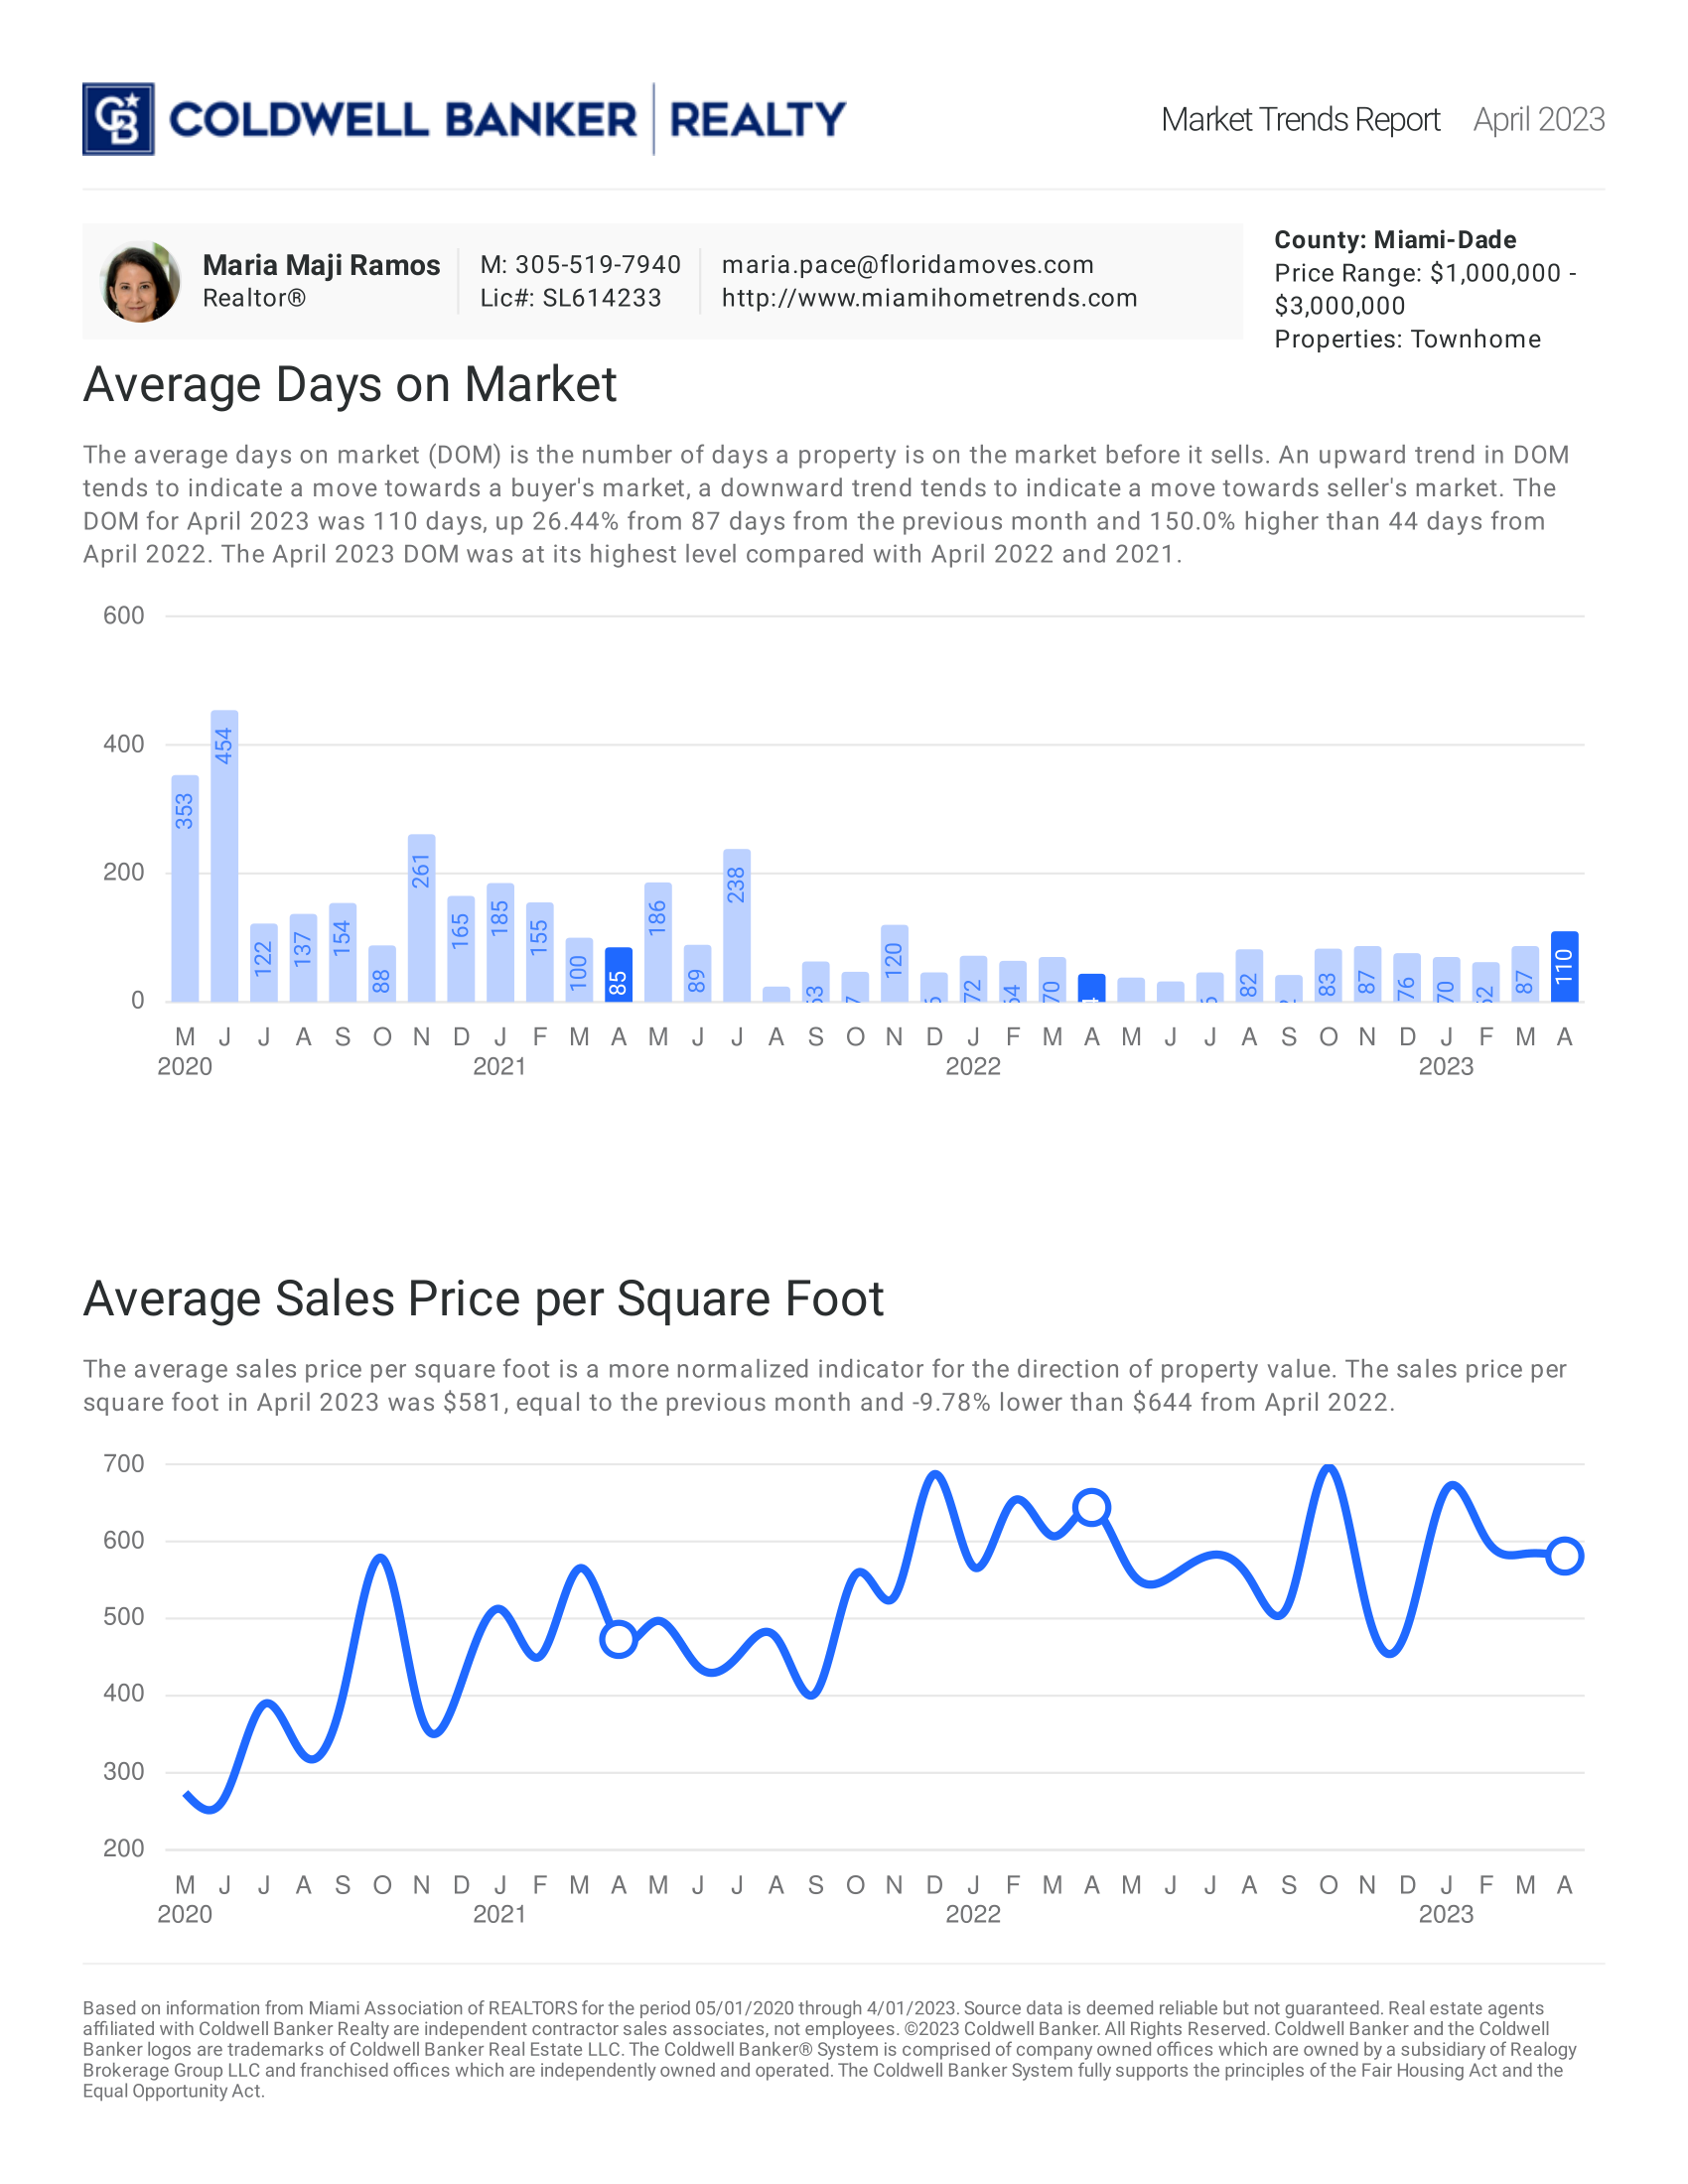
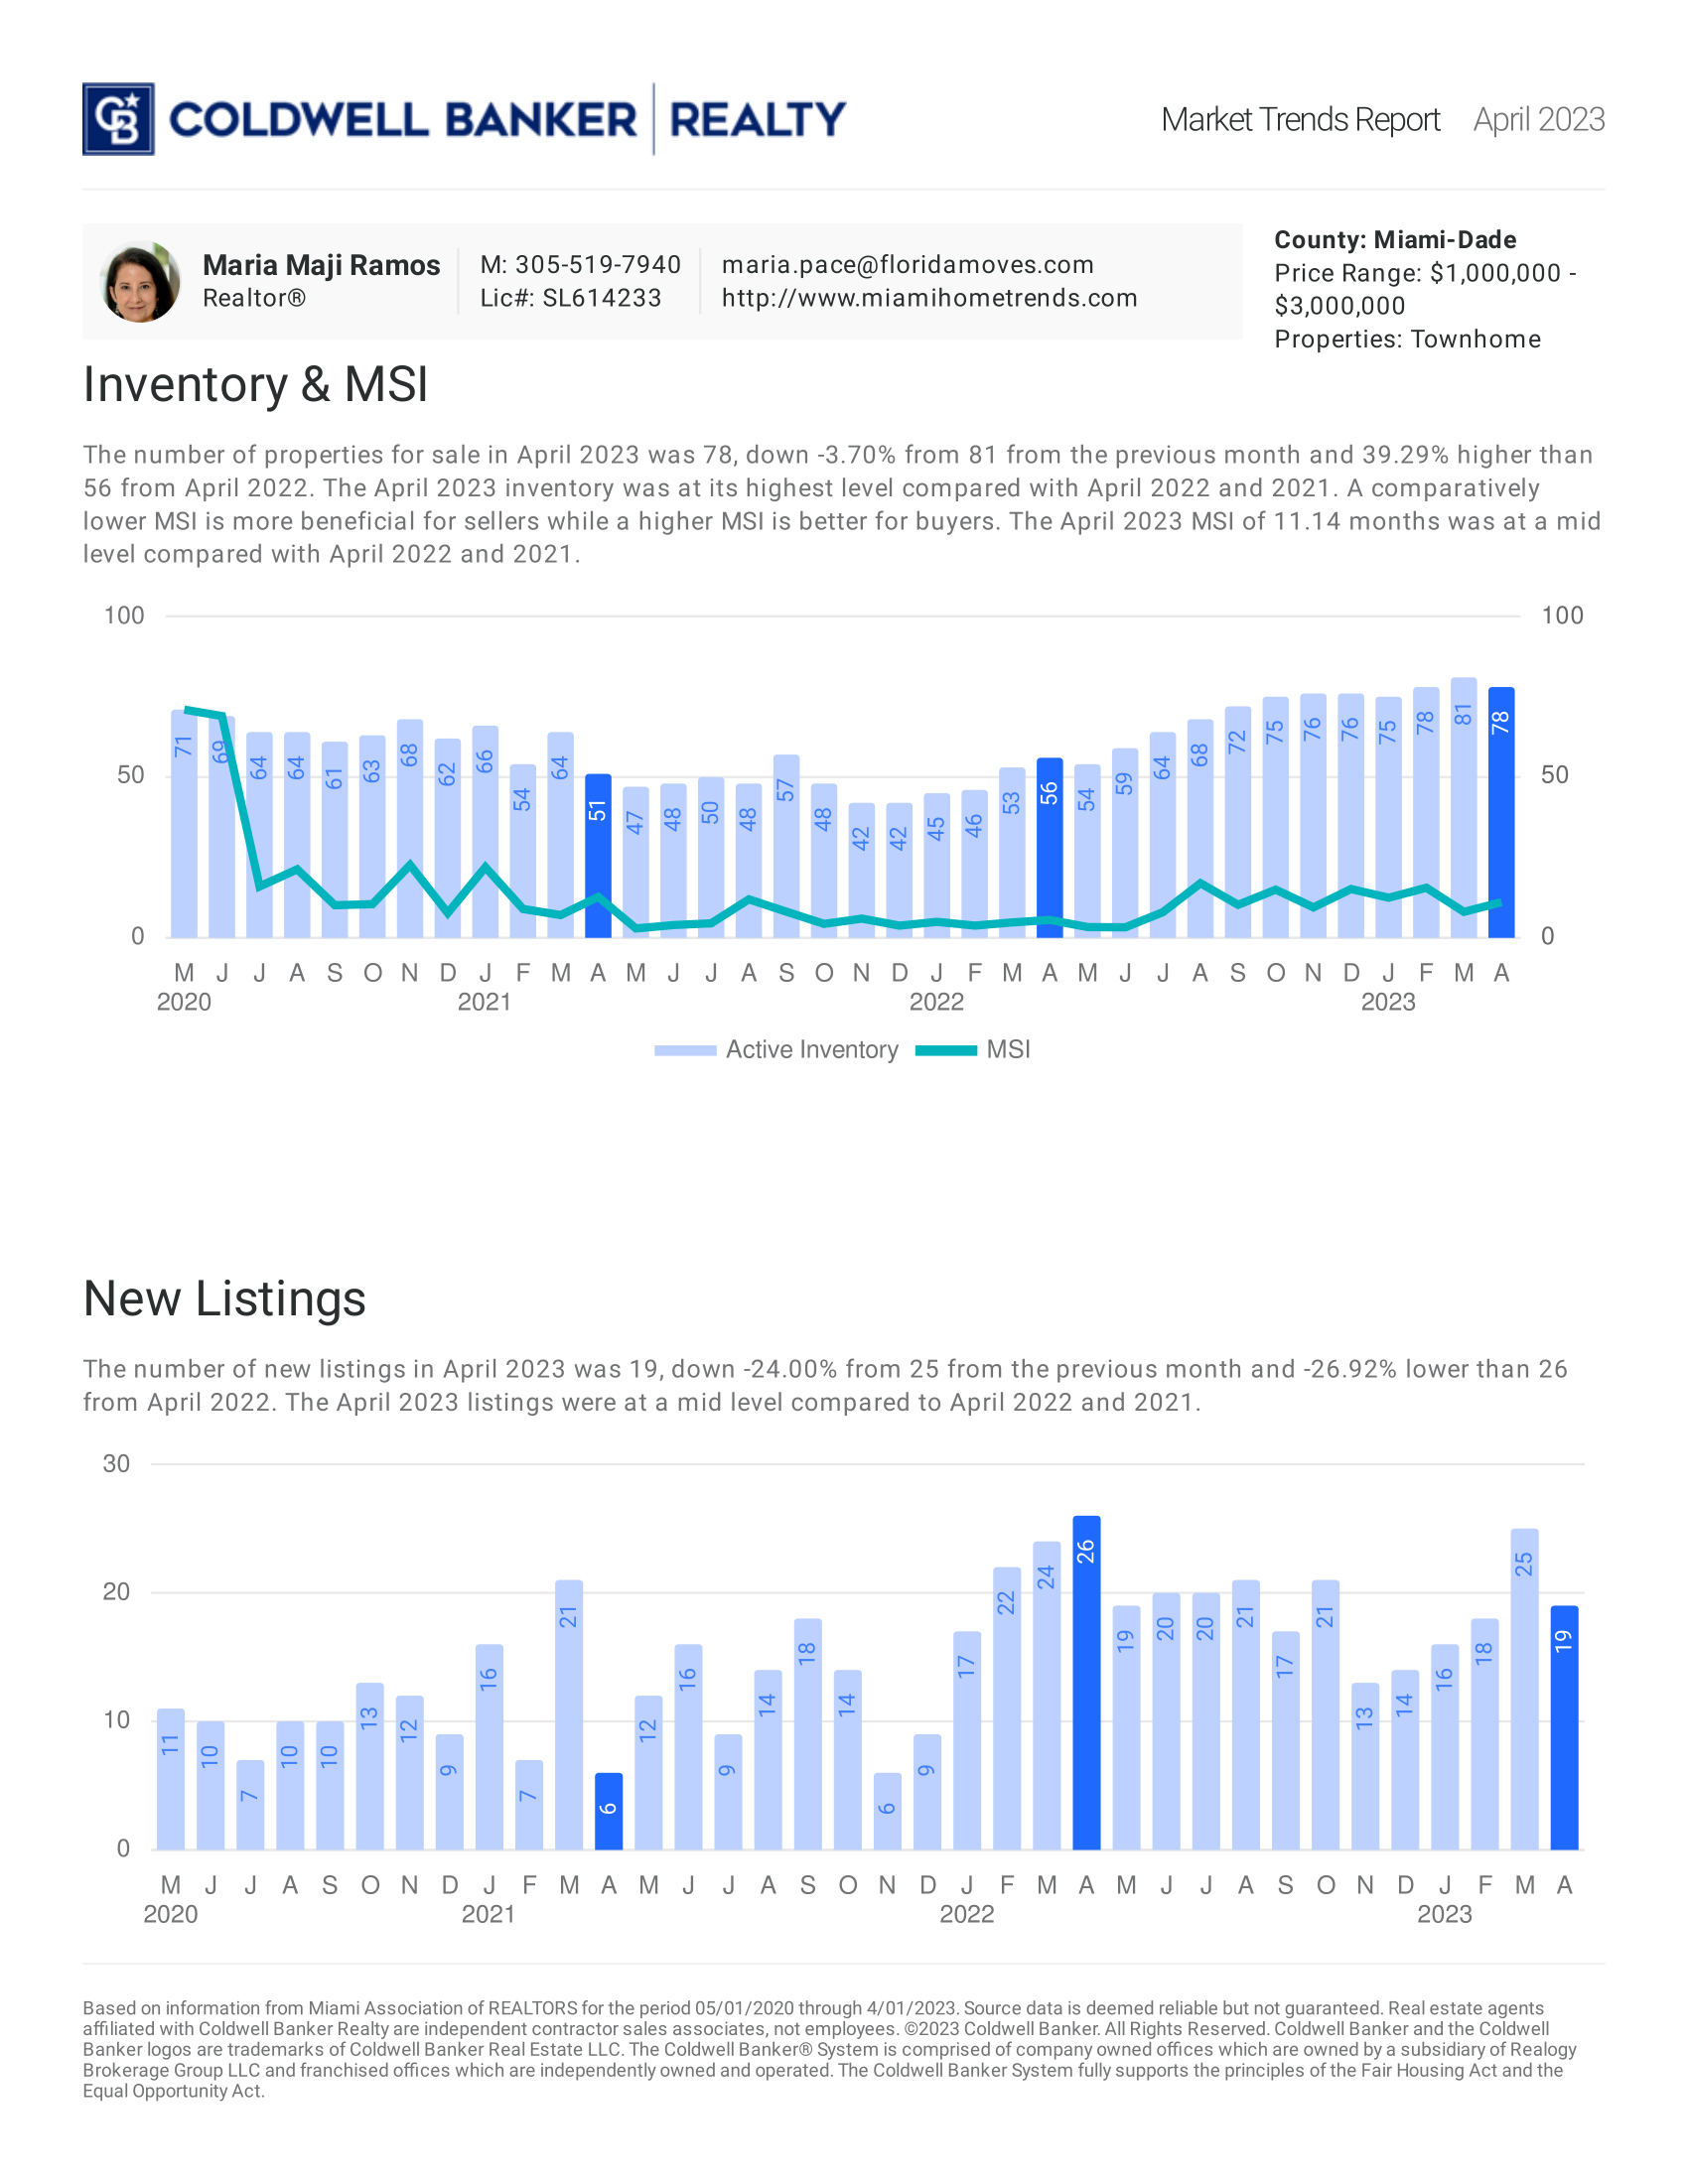
April 2023: Townhome

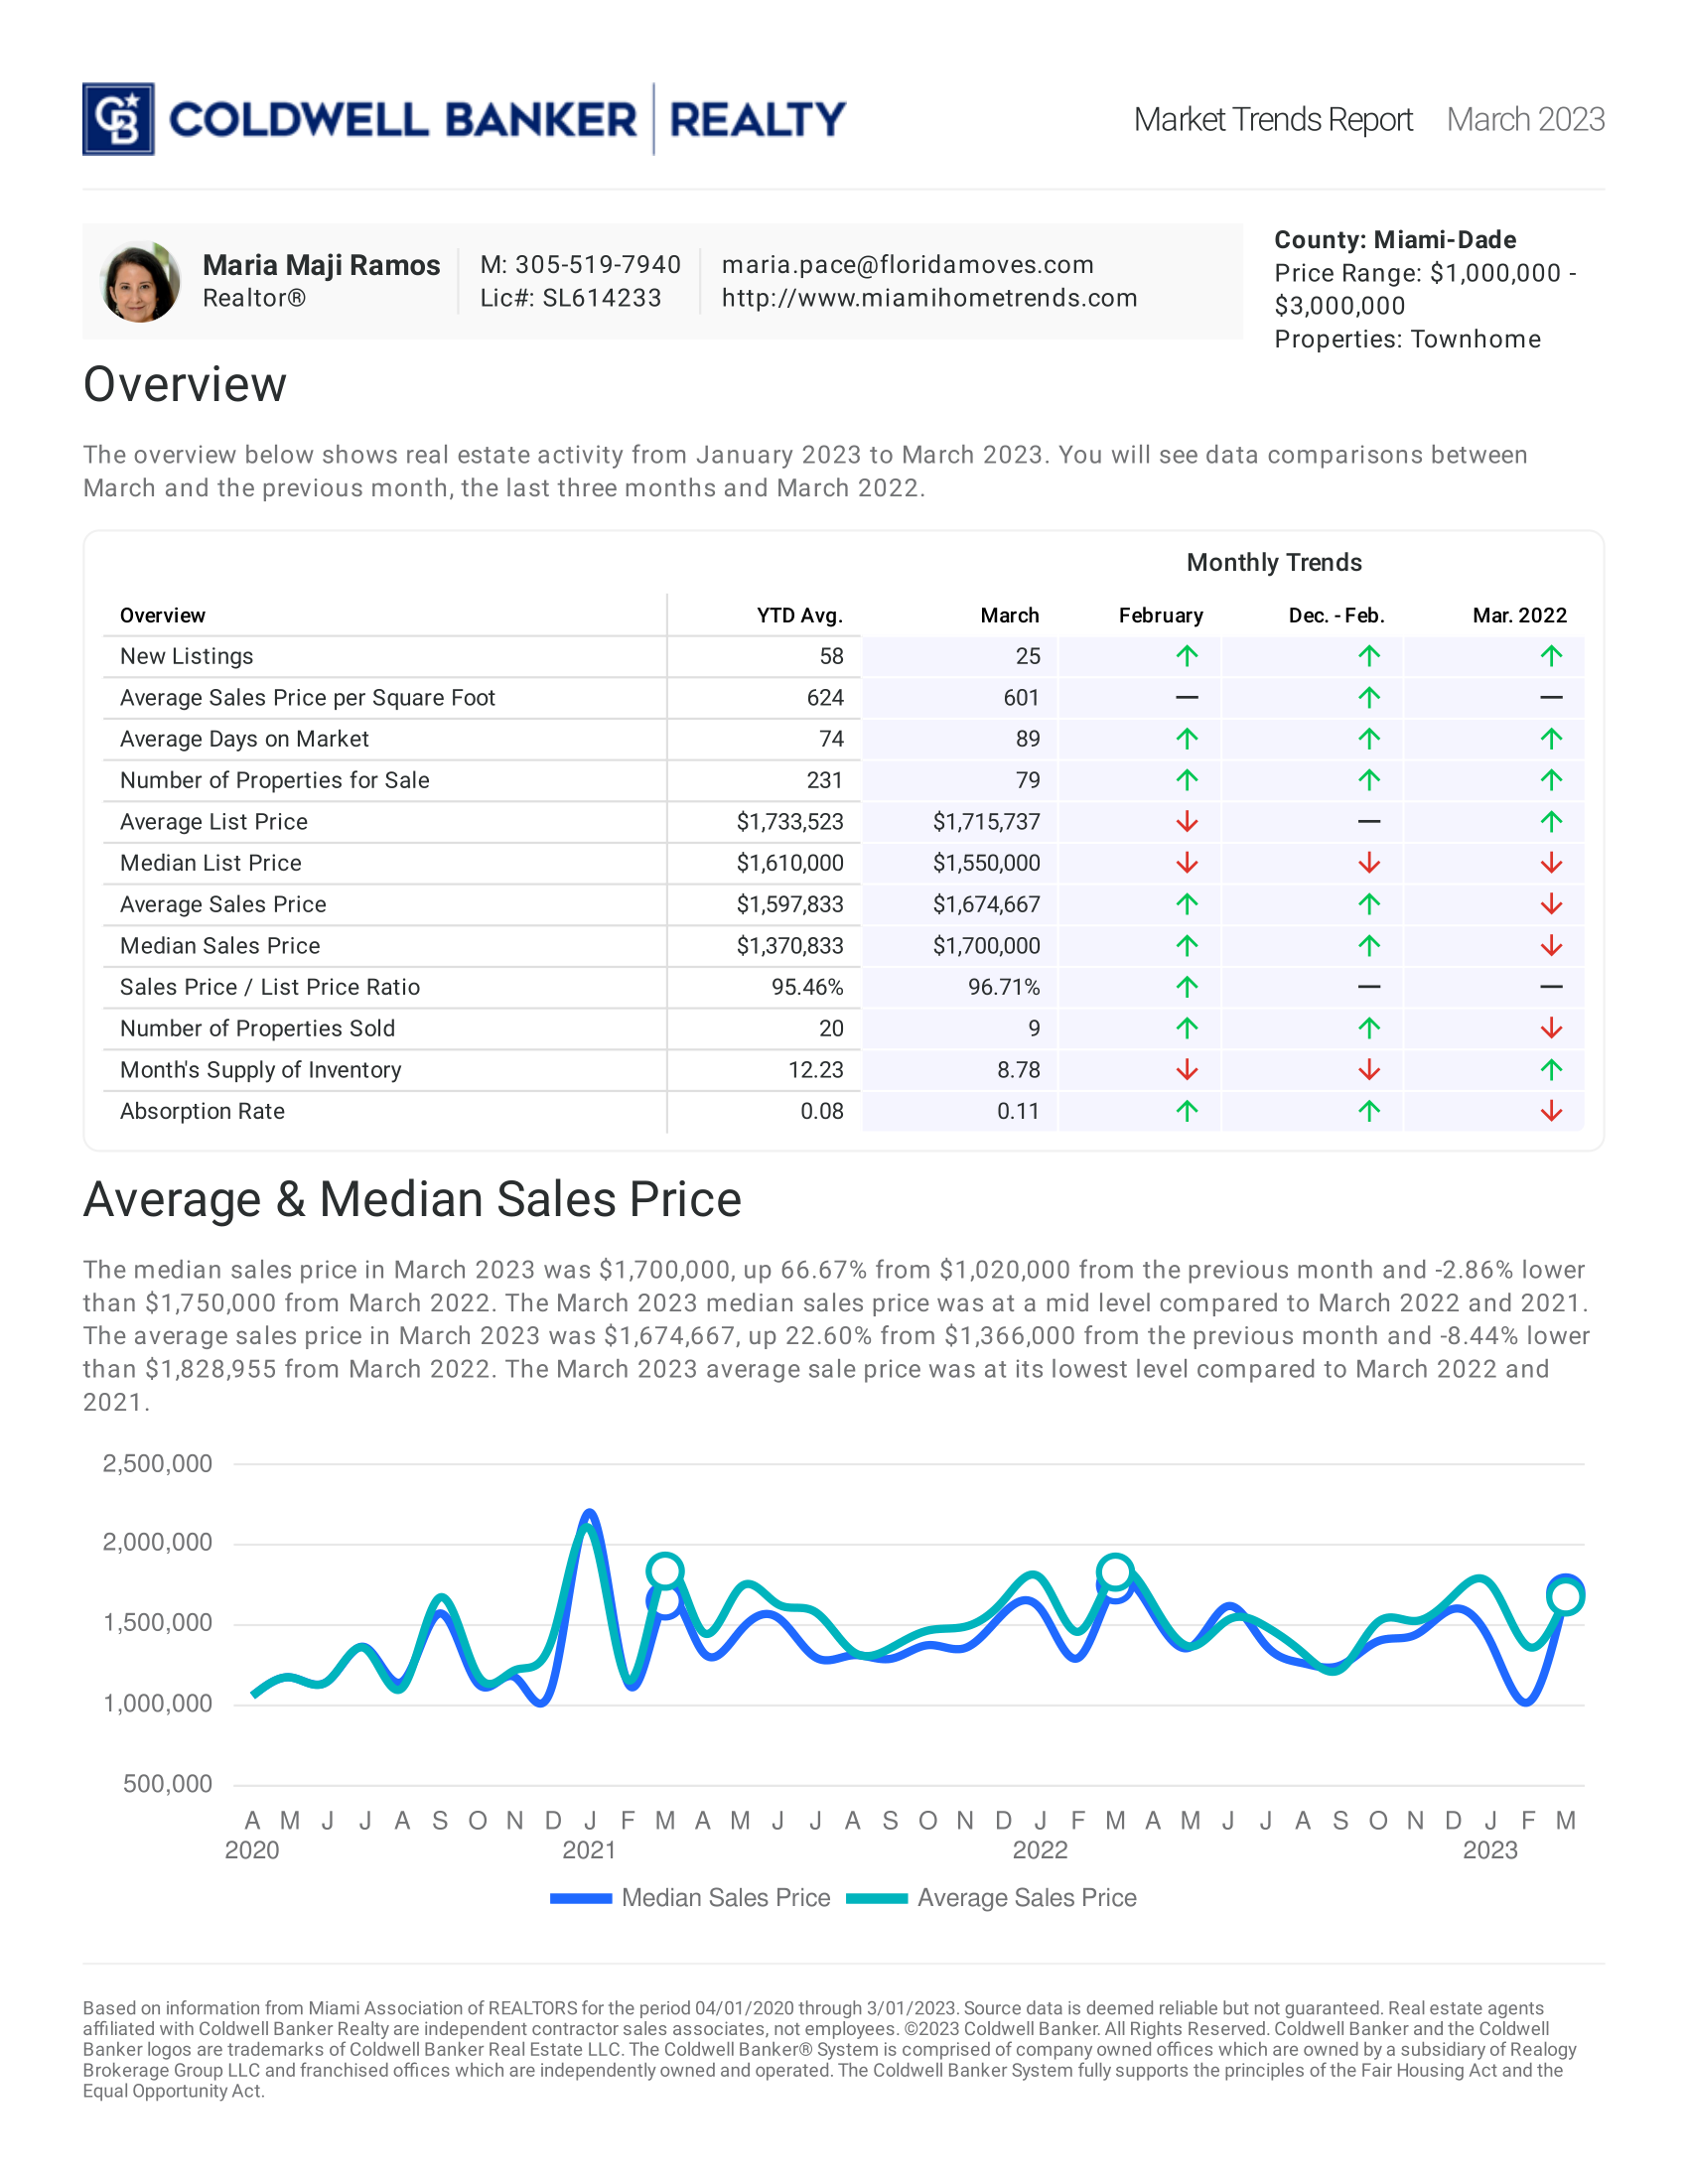
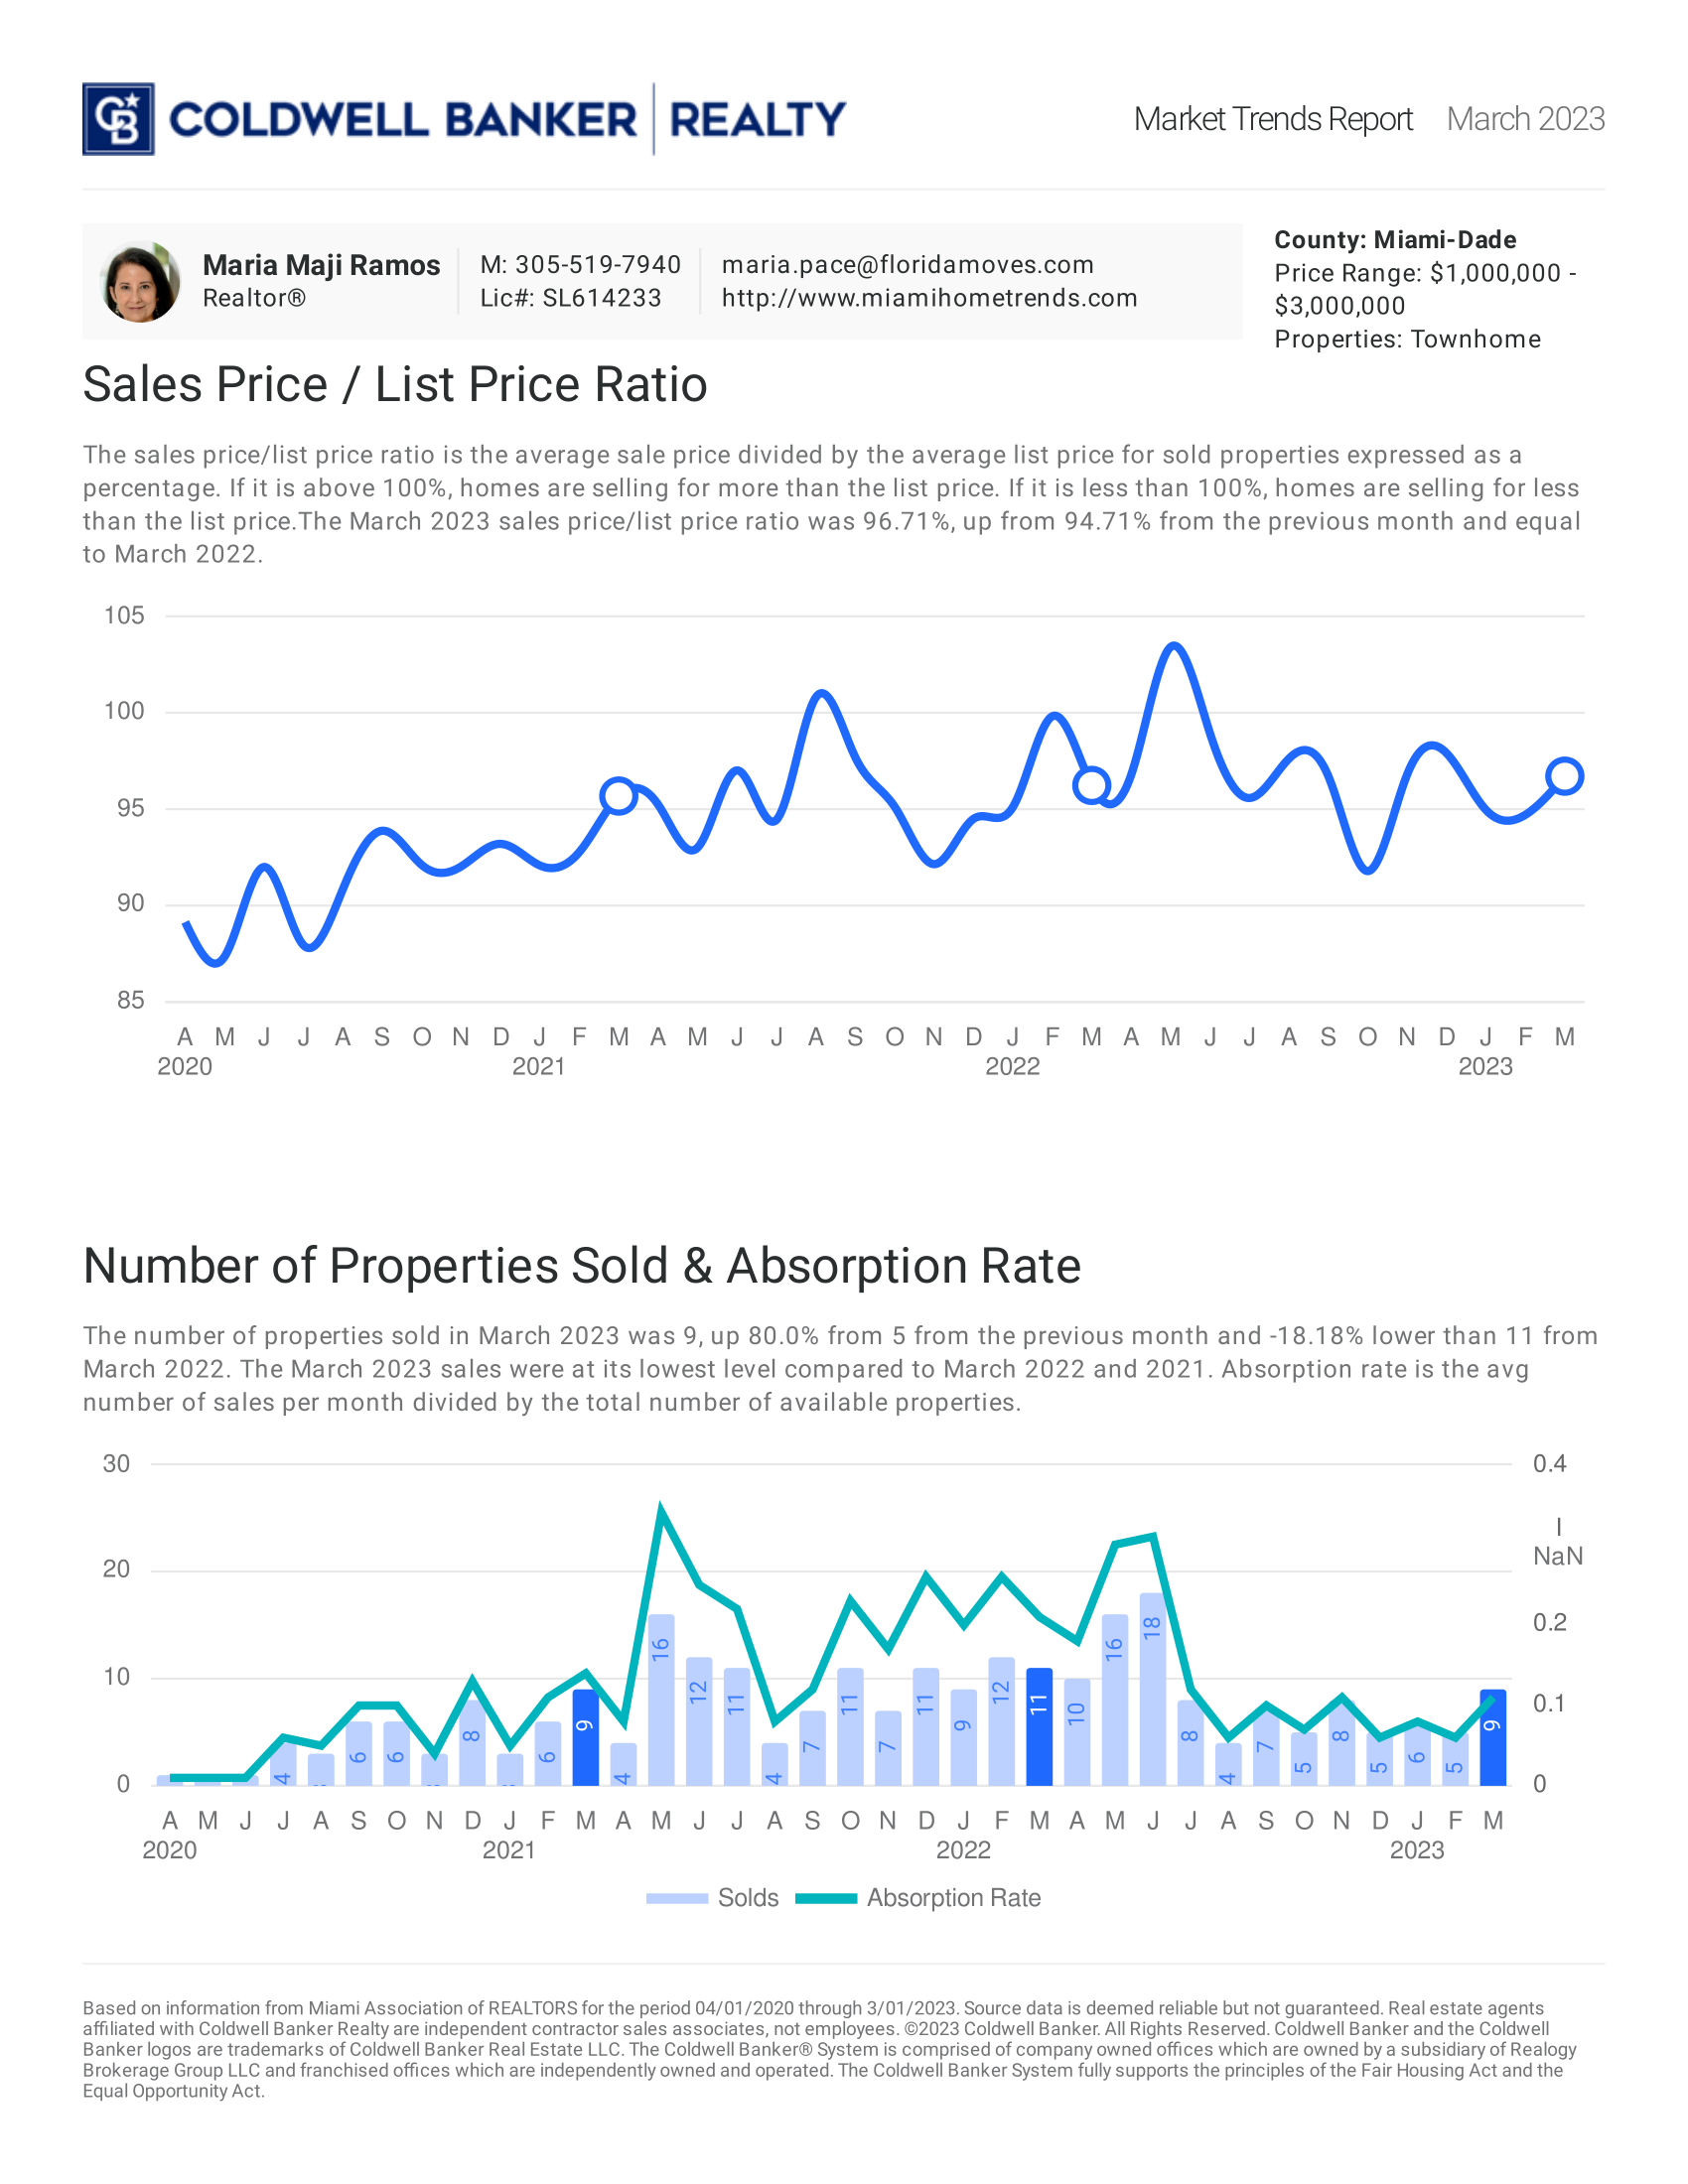
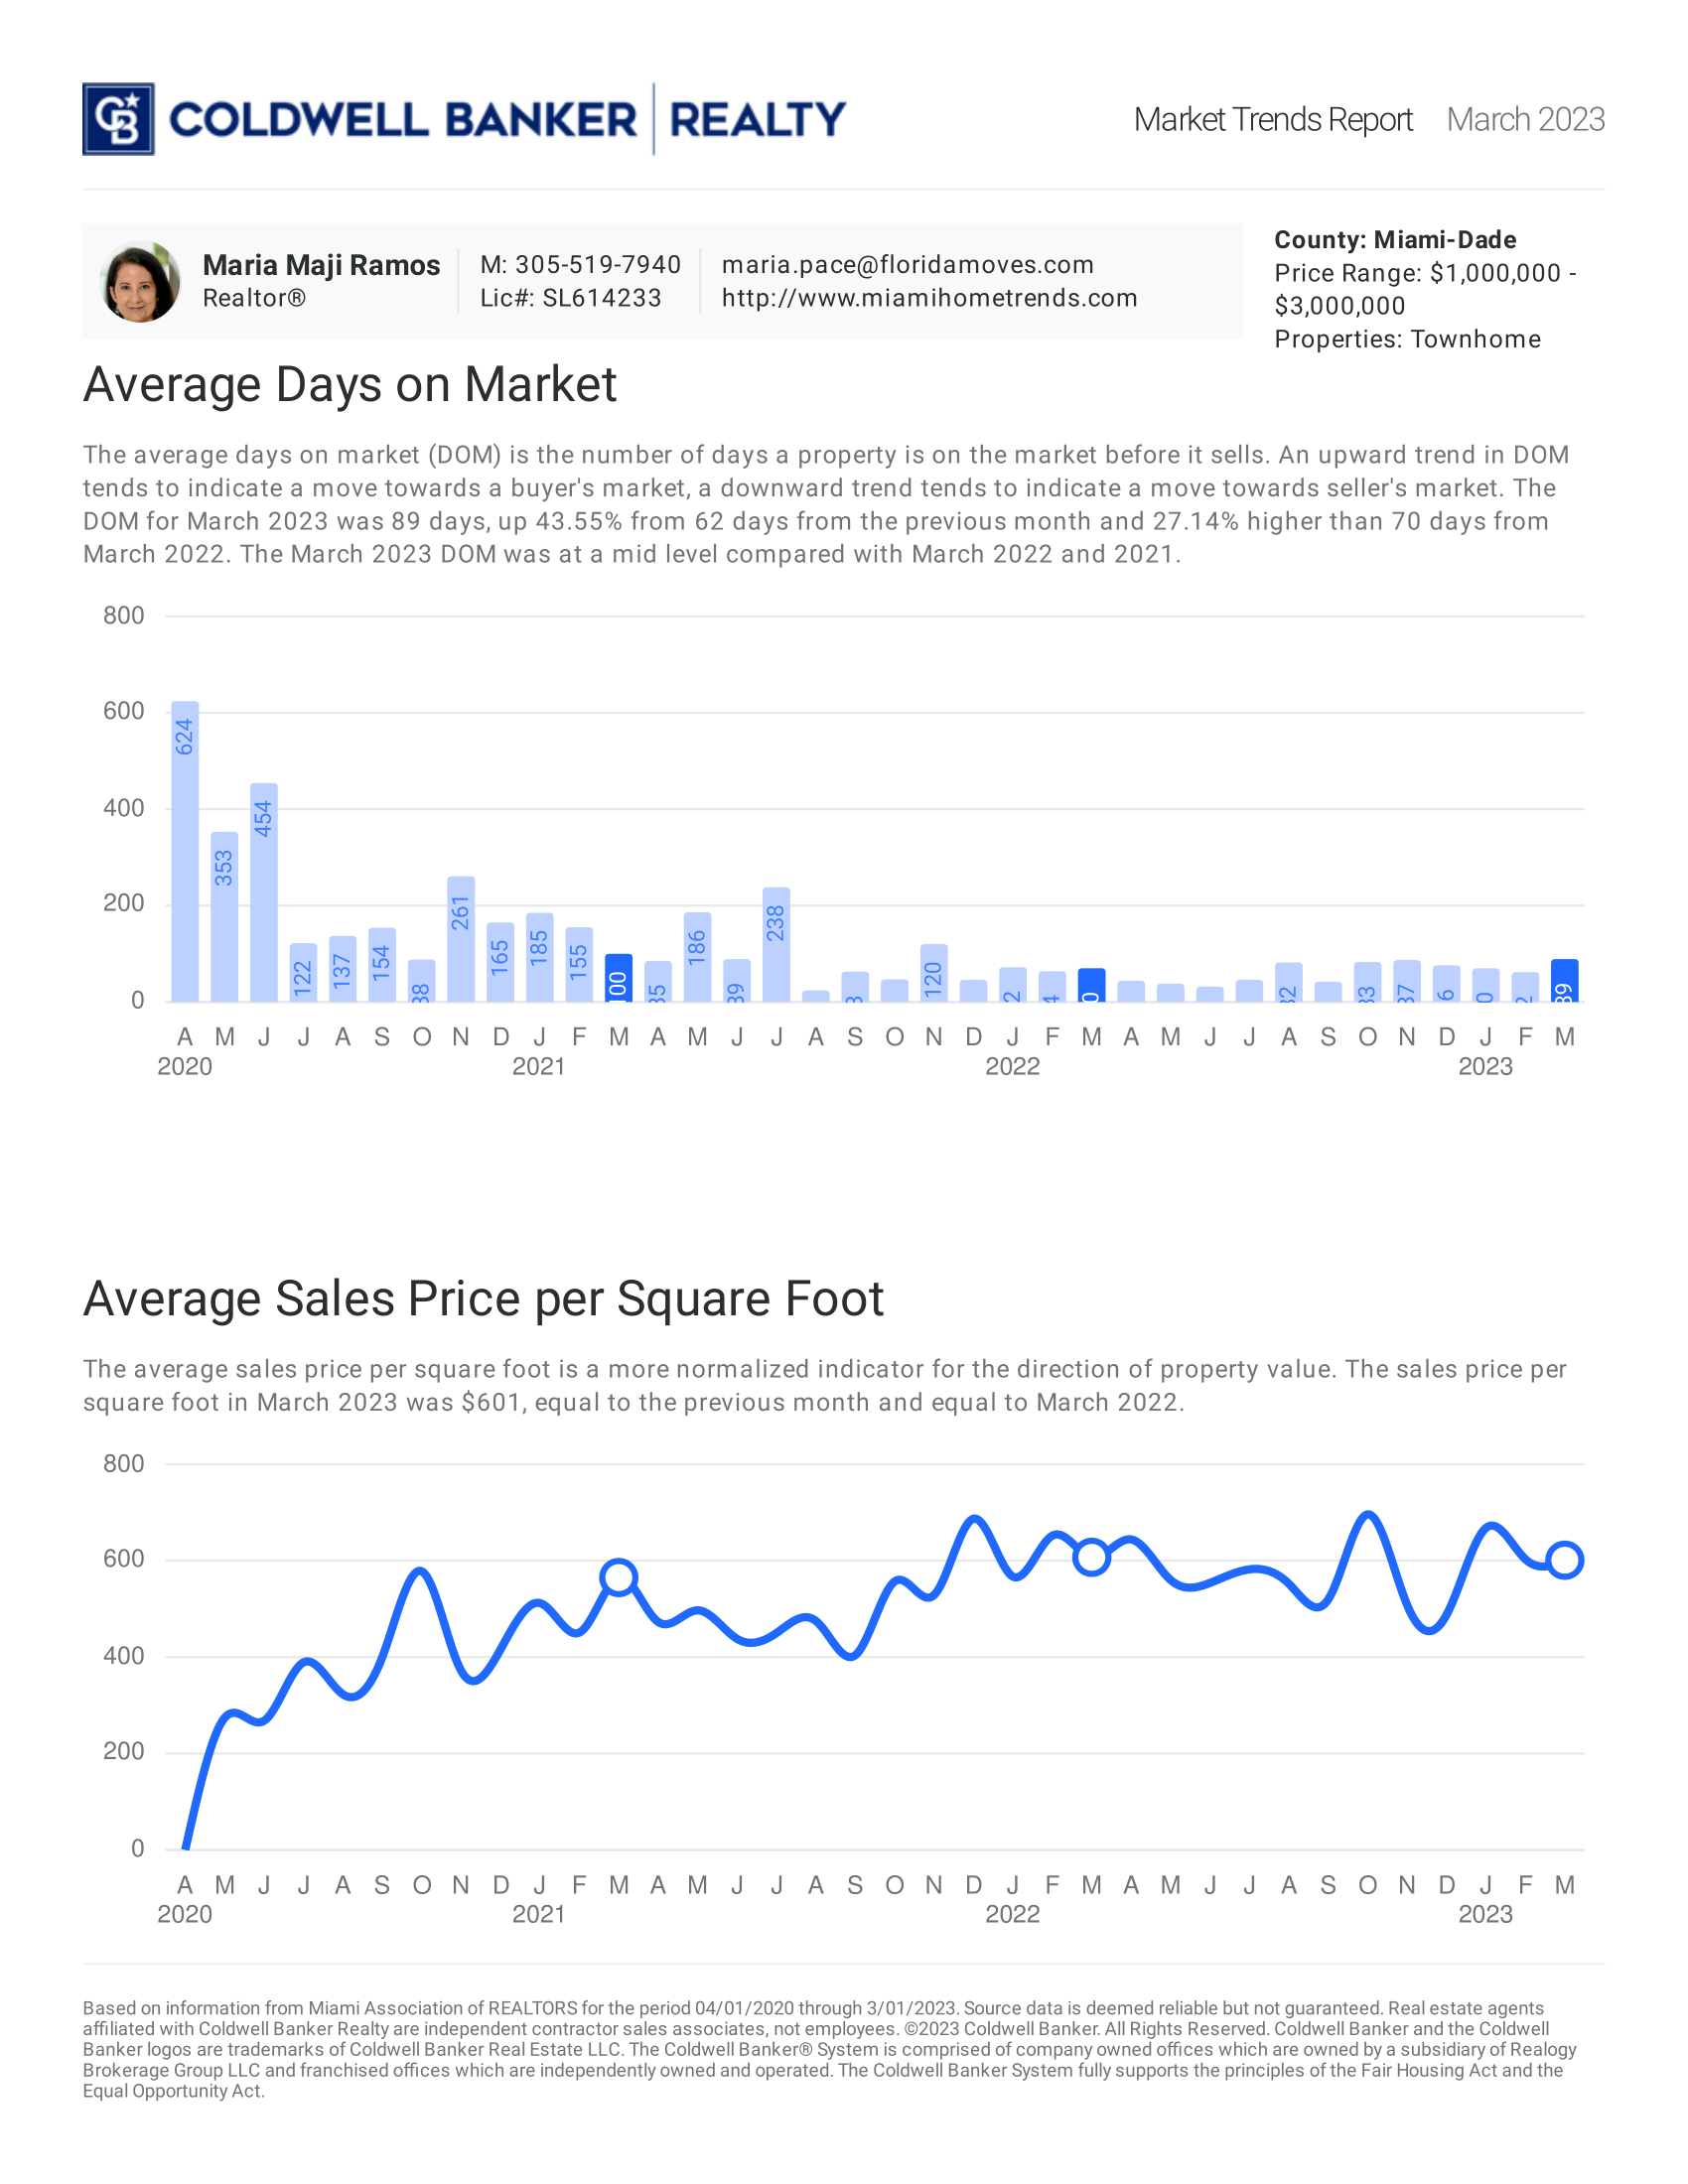
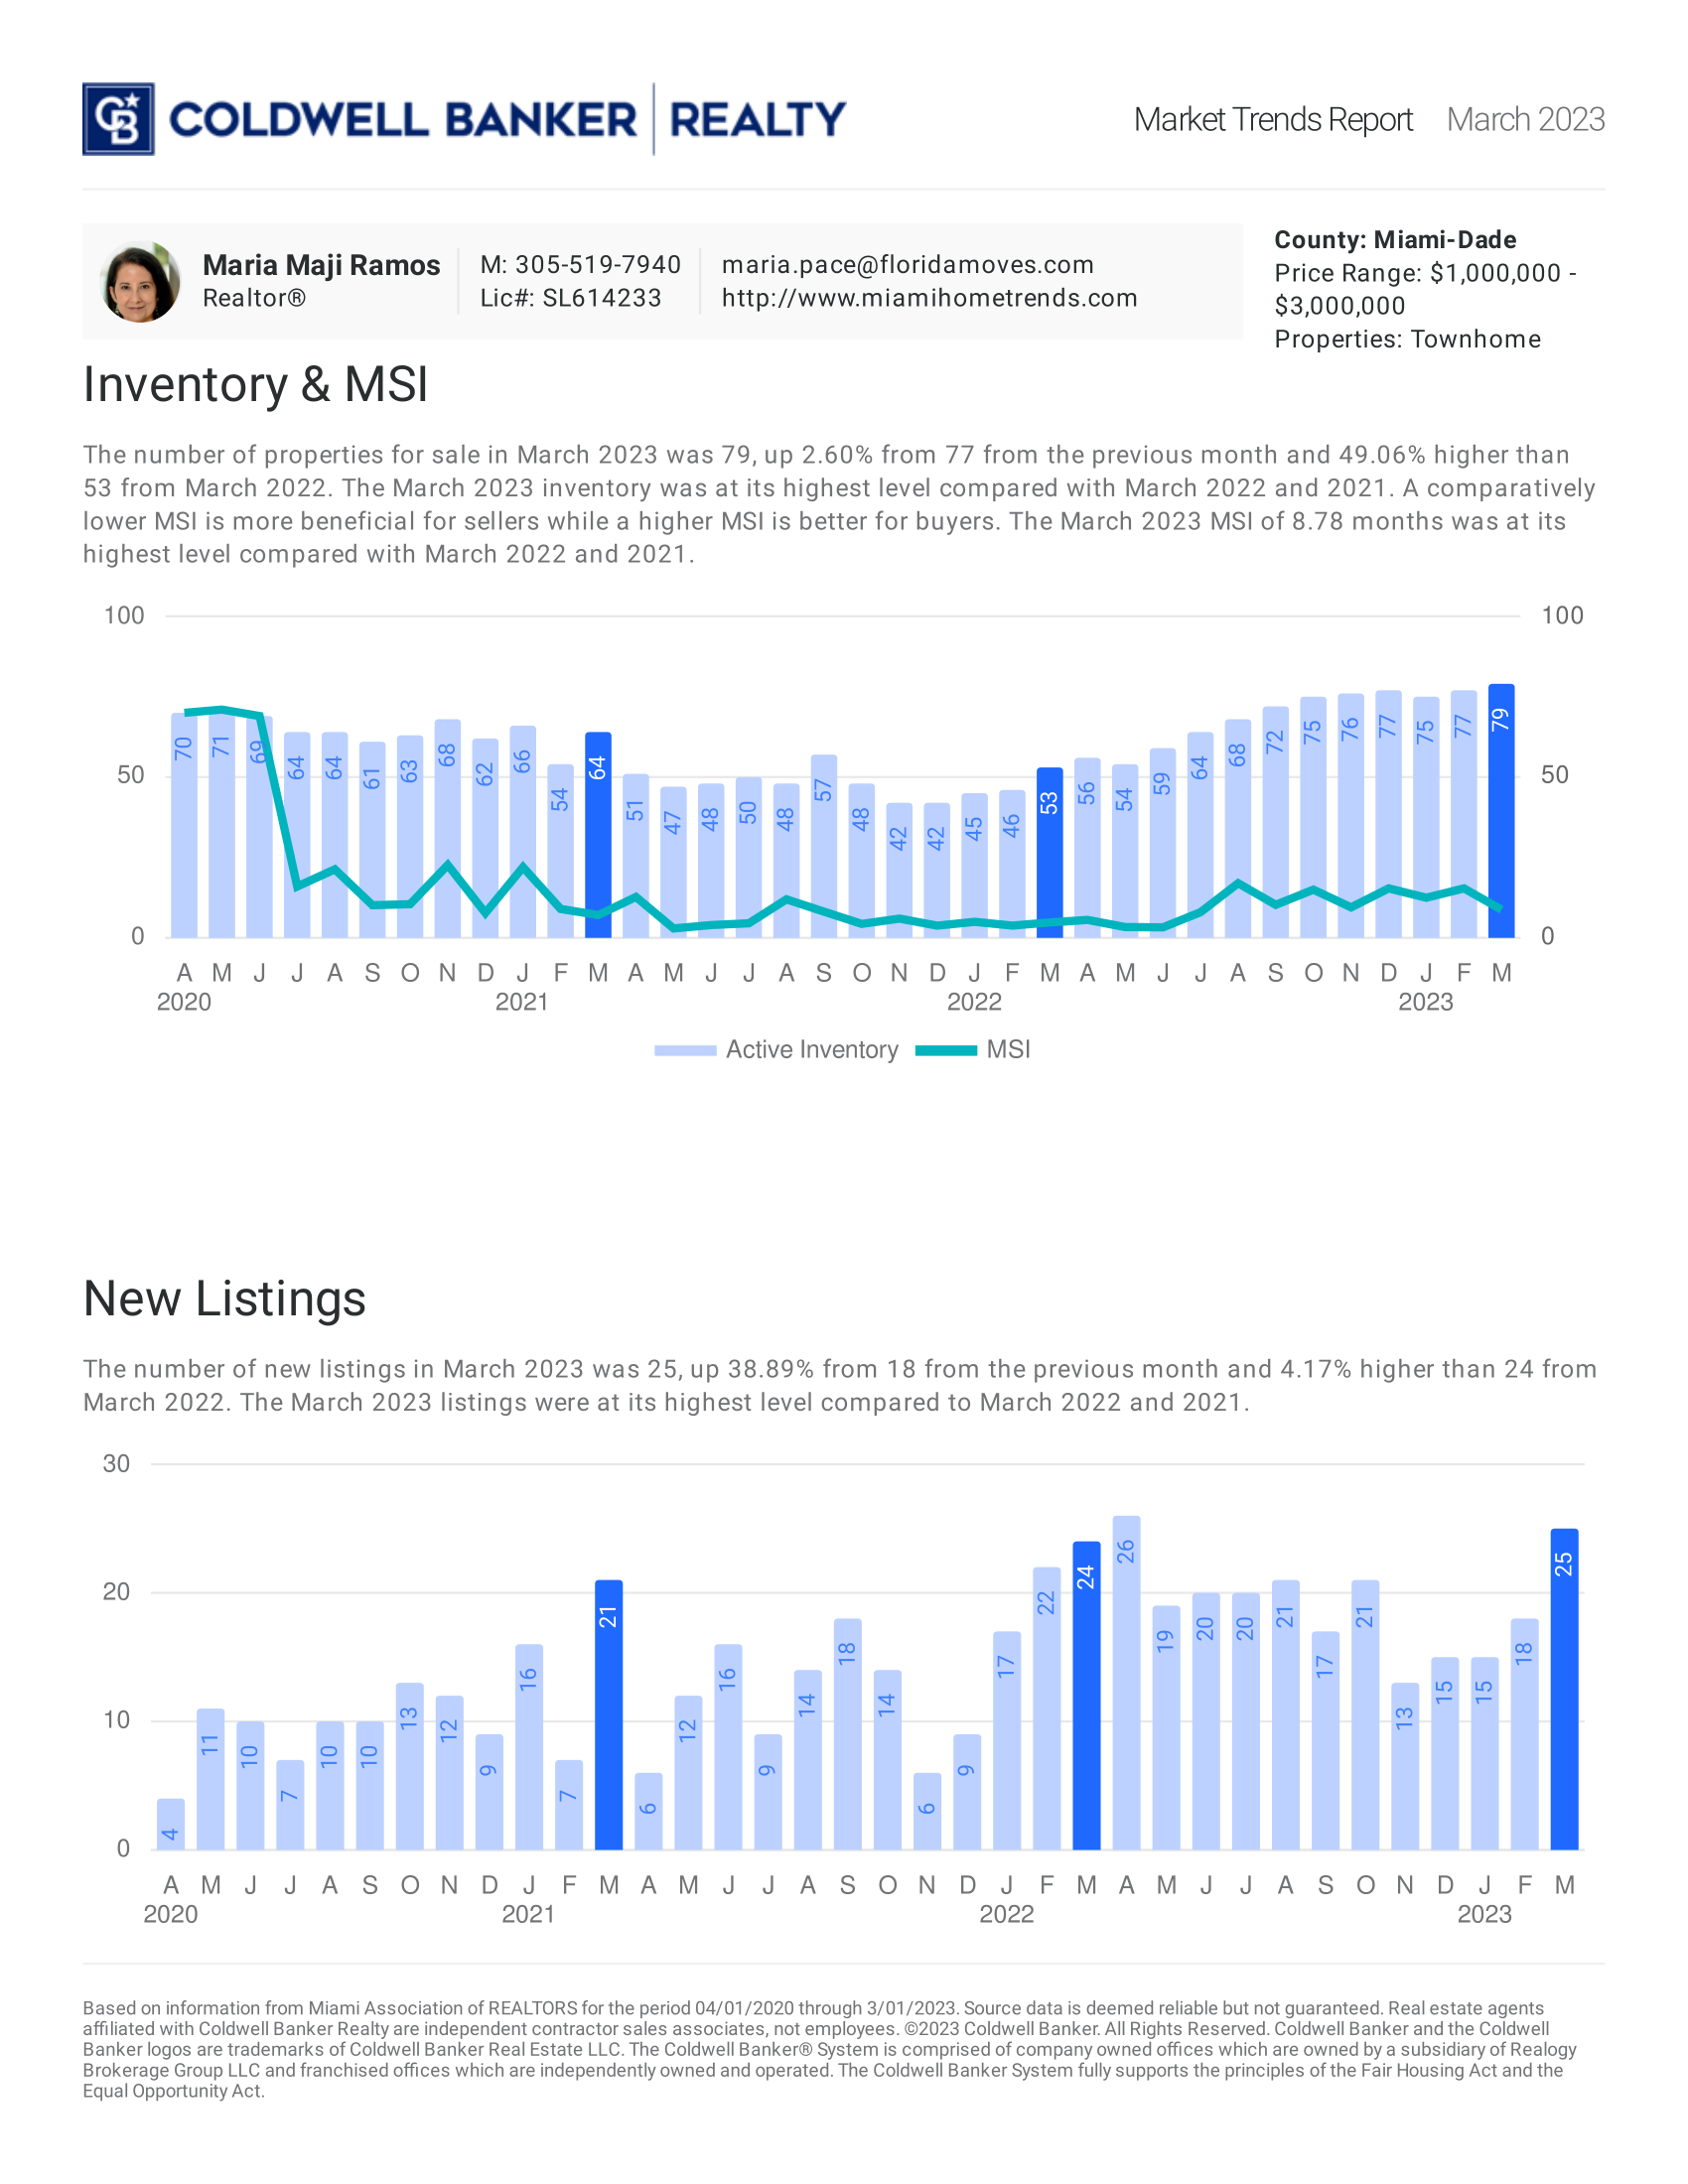
March 2023: Single Family


March 2023: Townhome

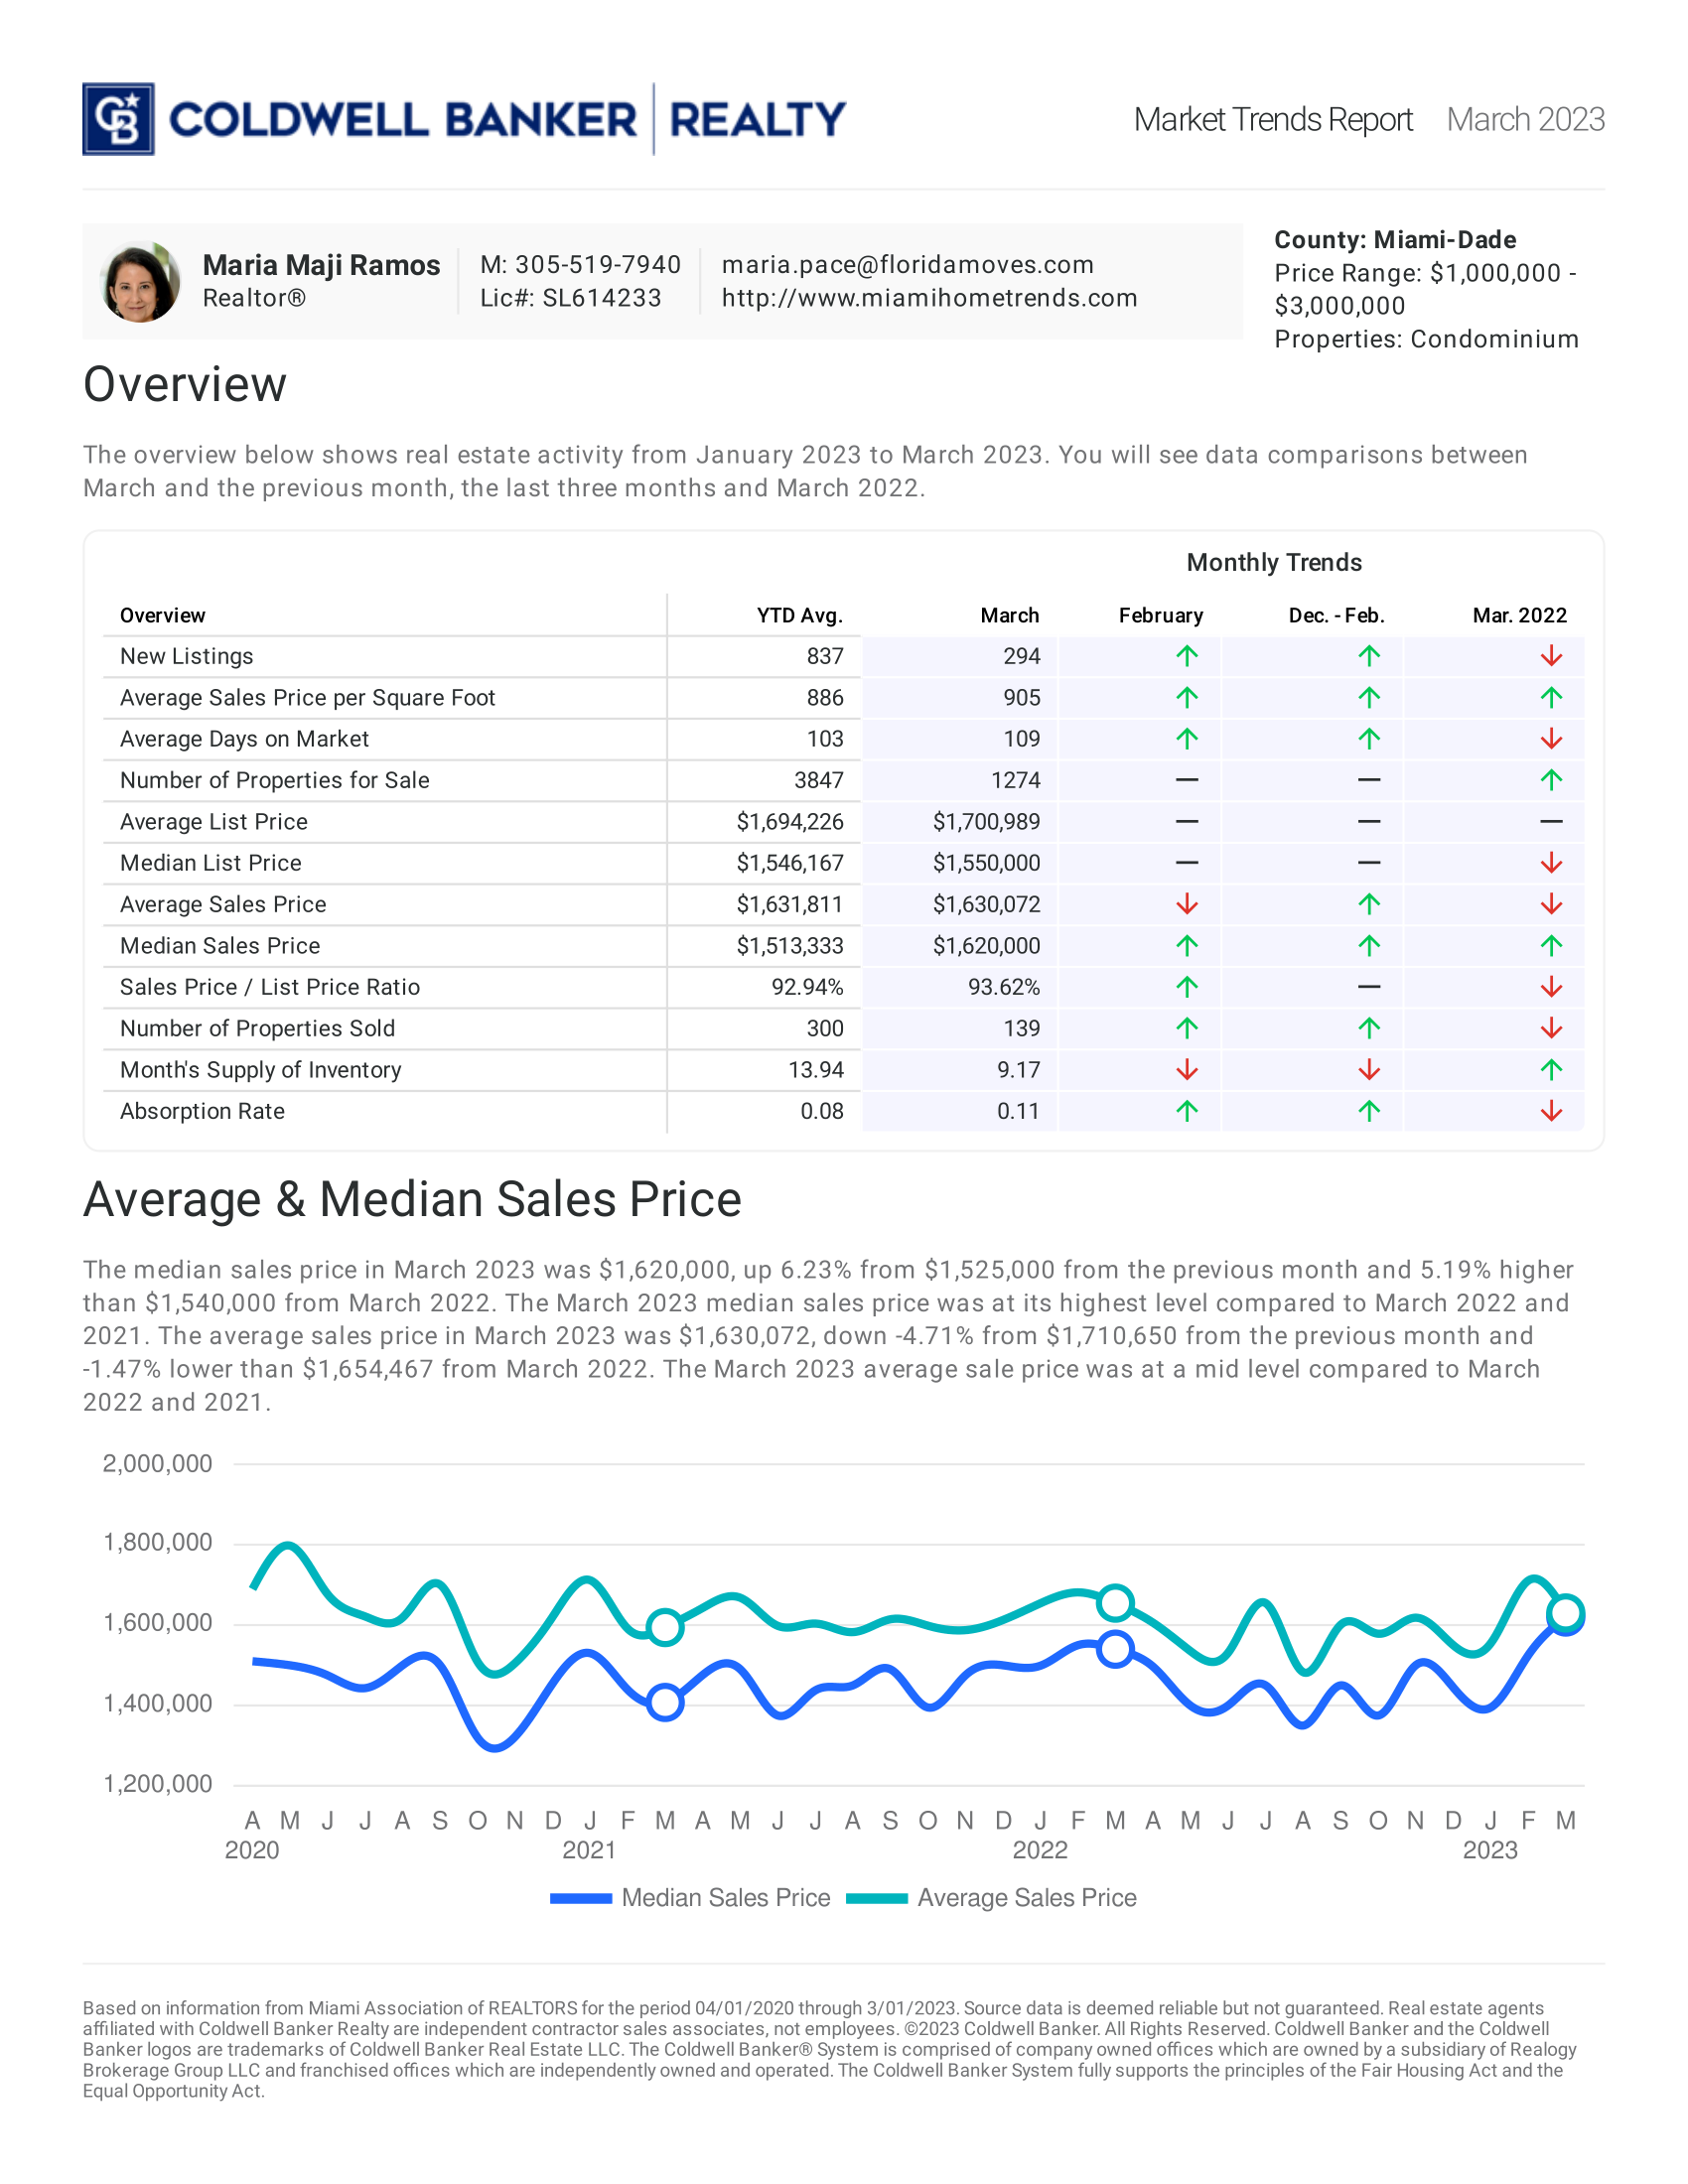
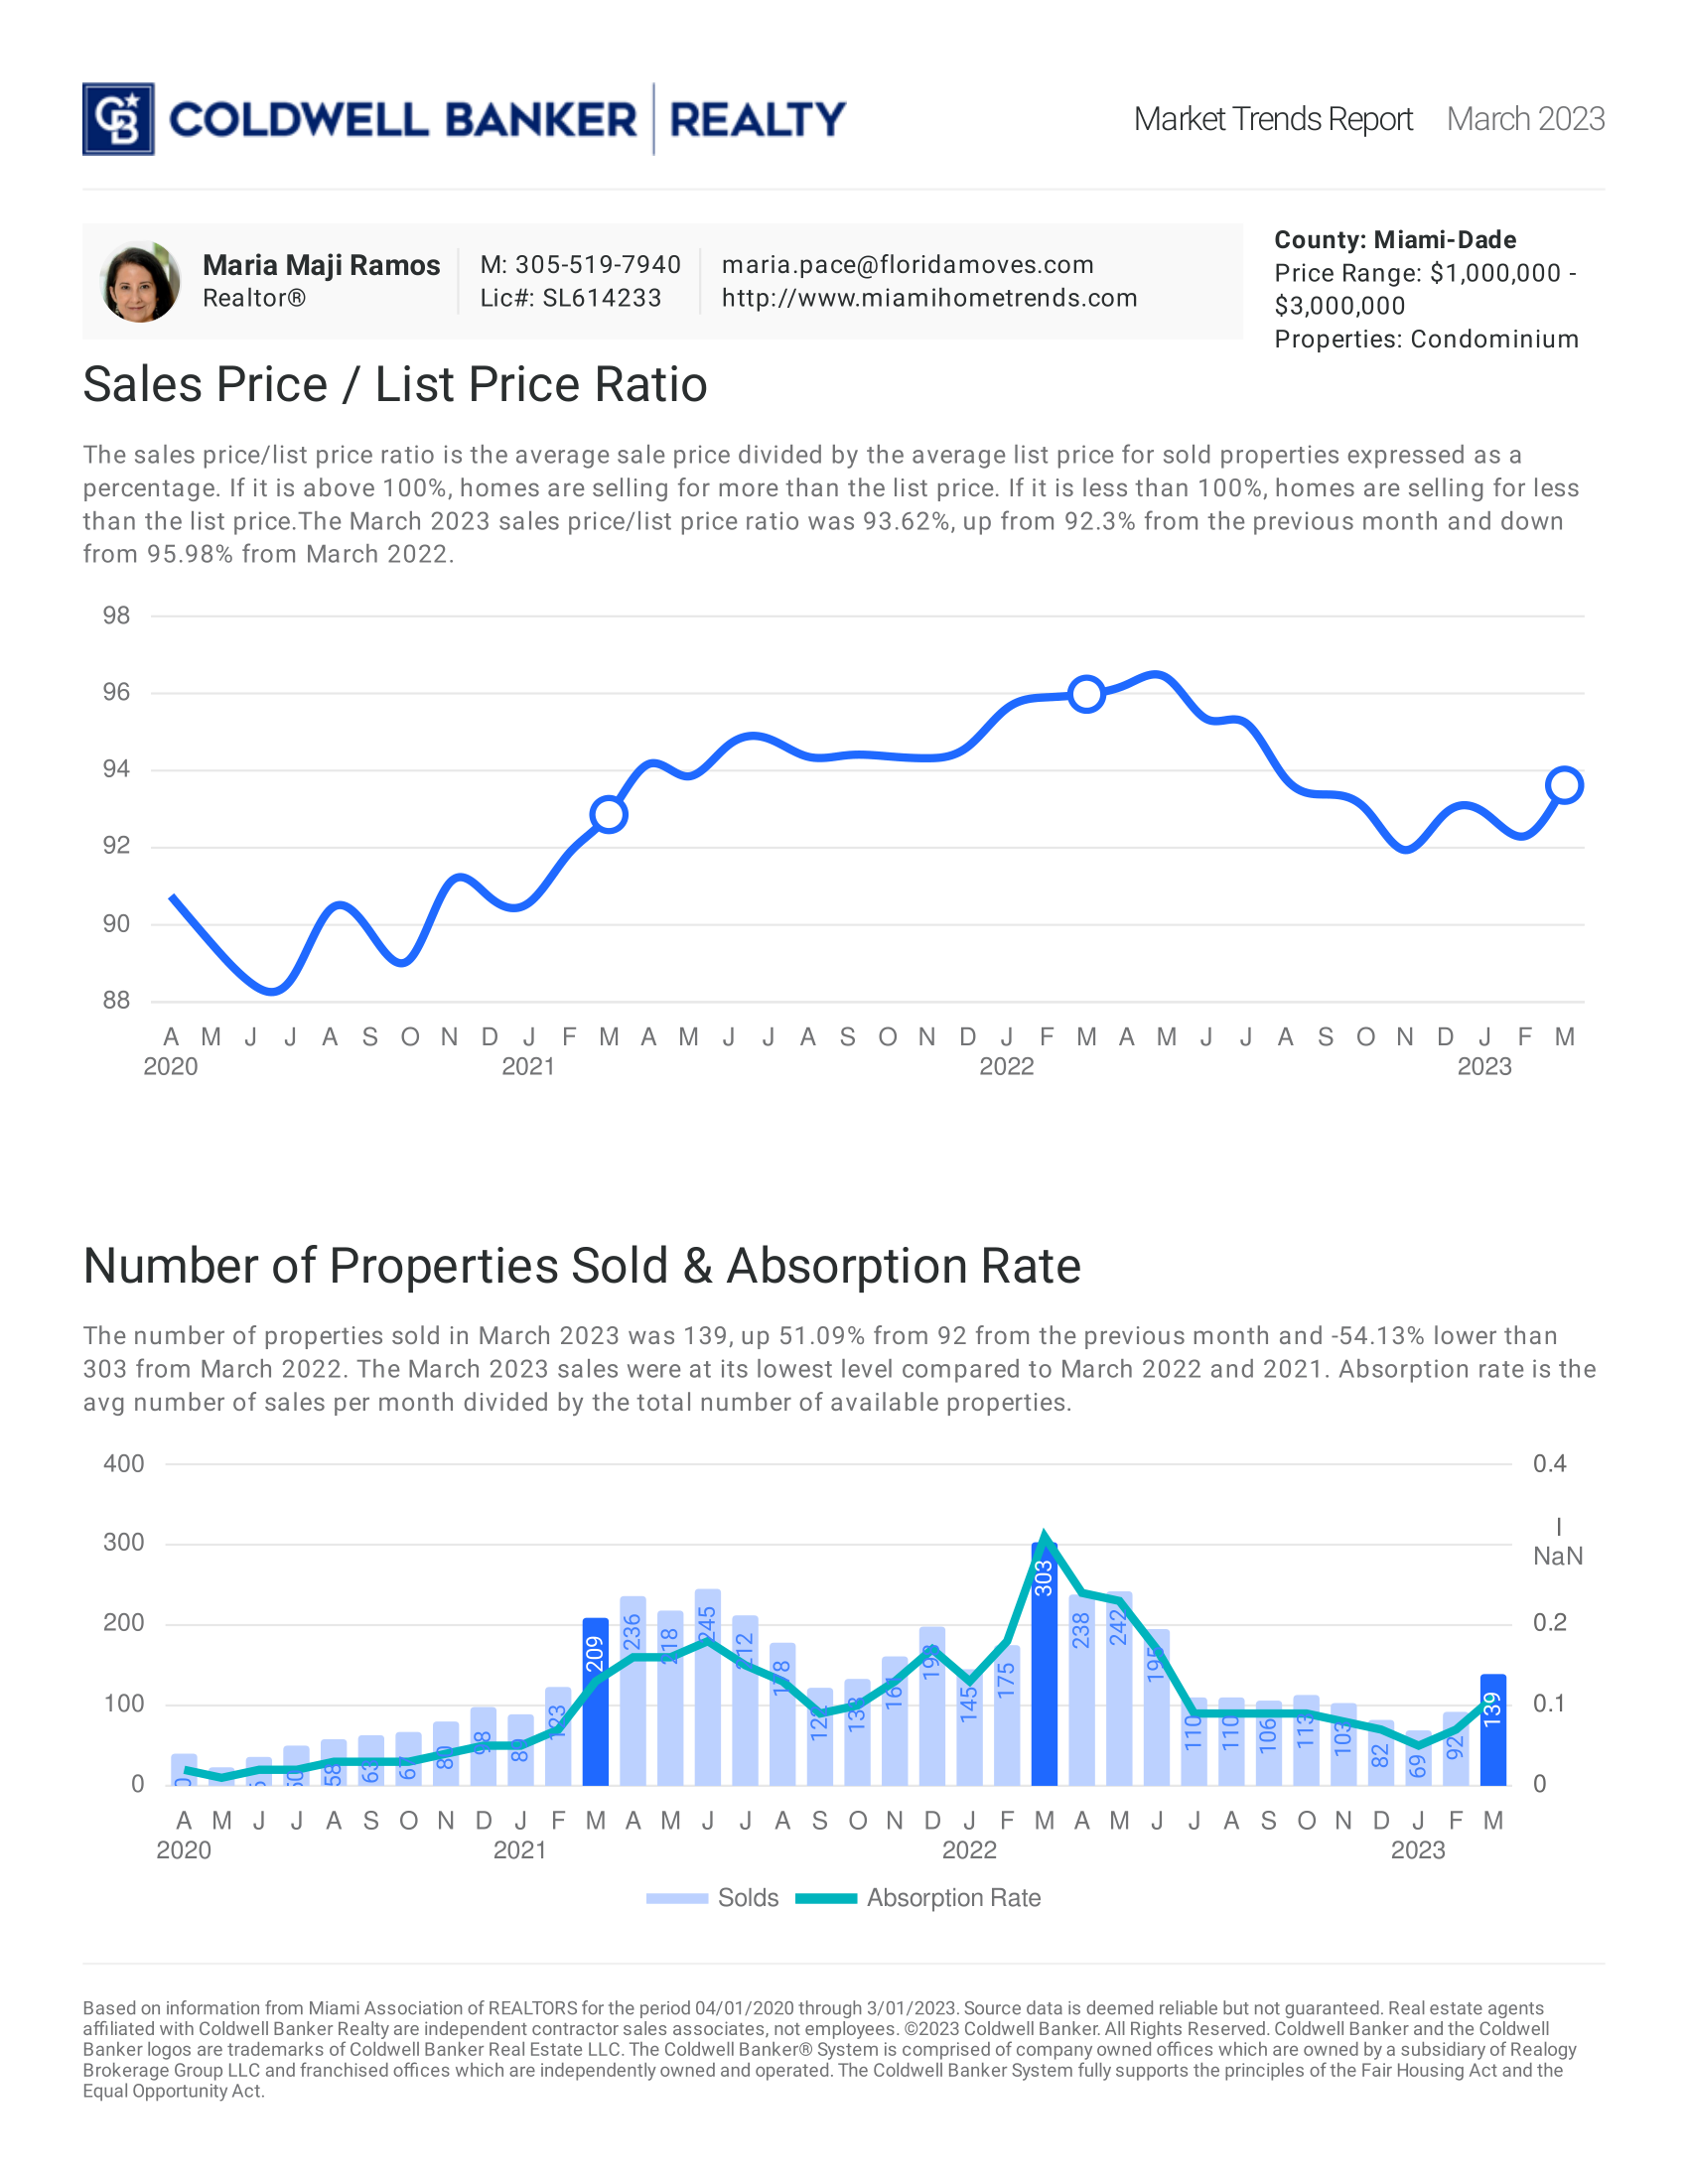
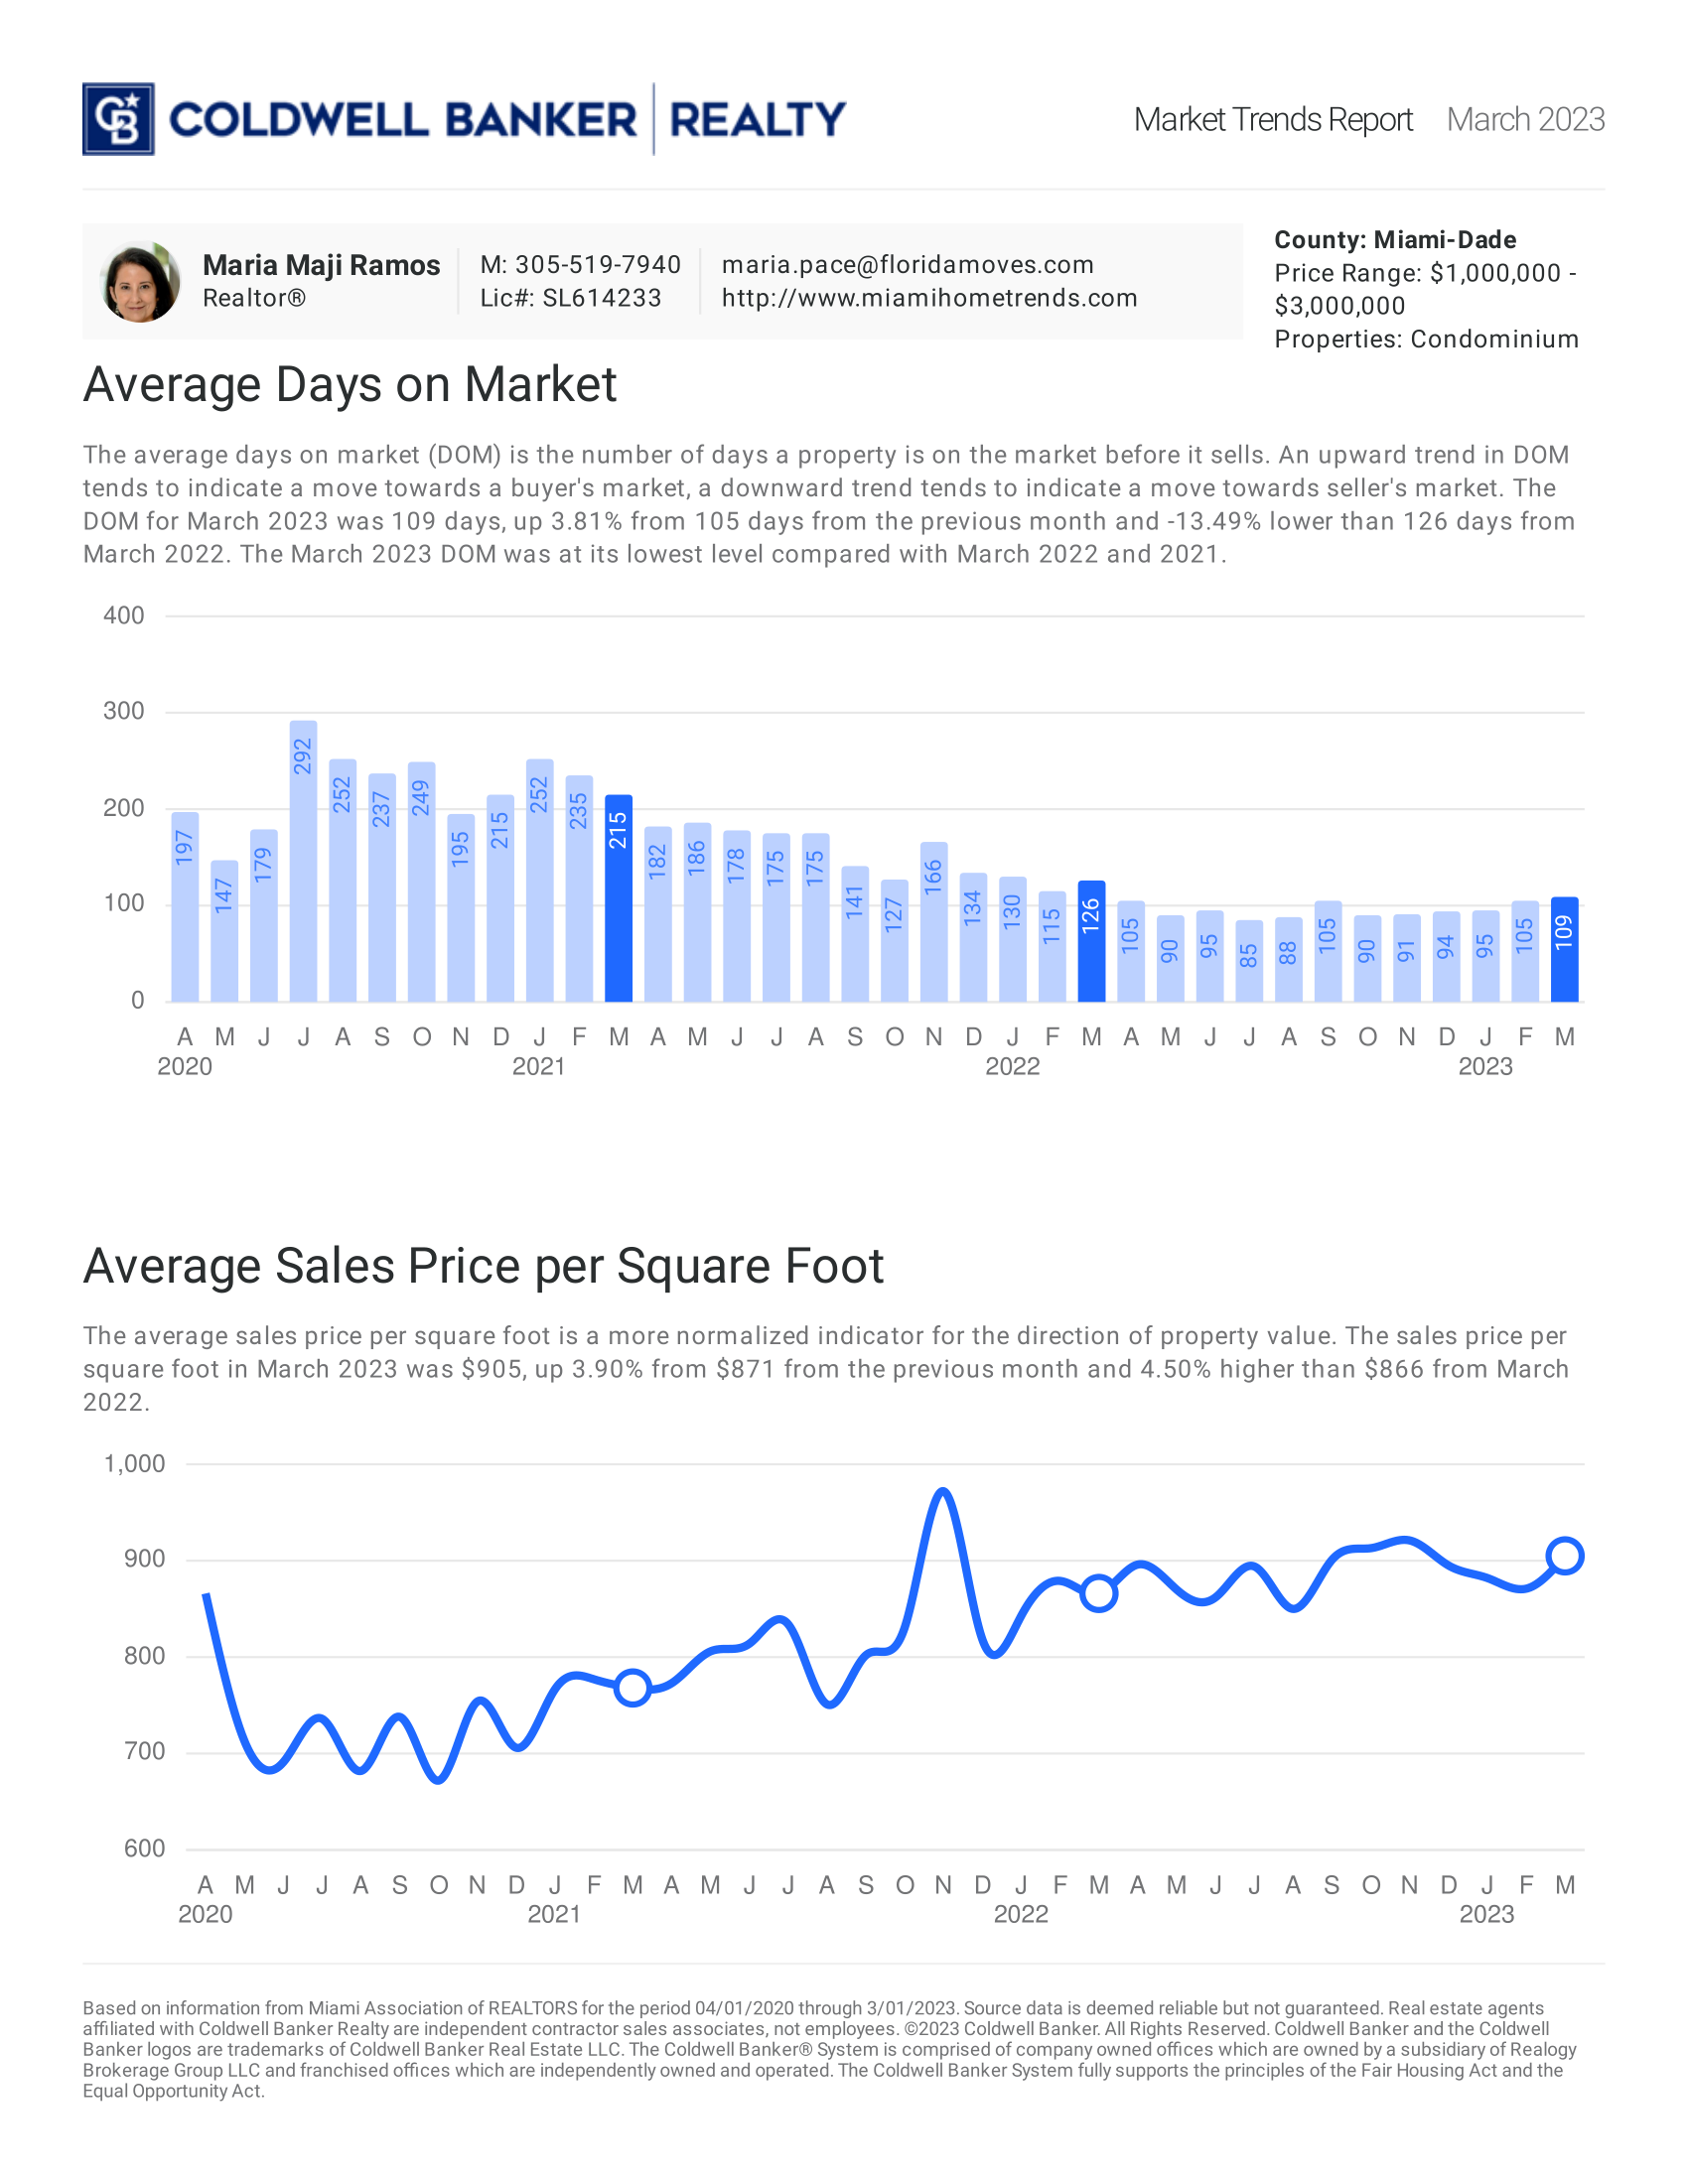
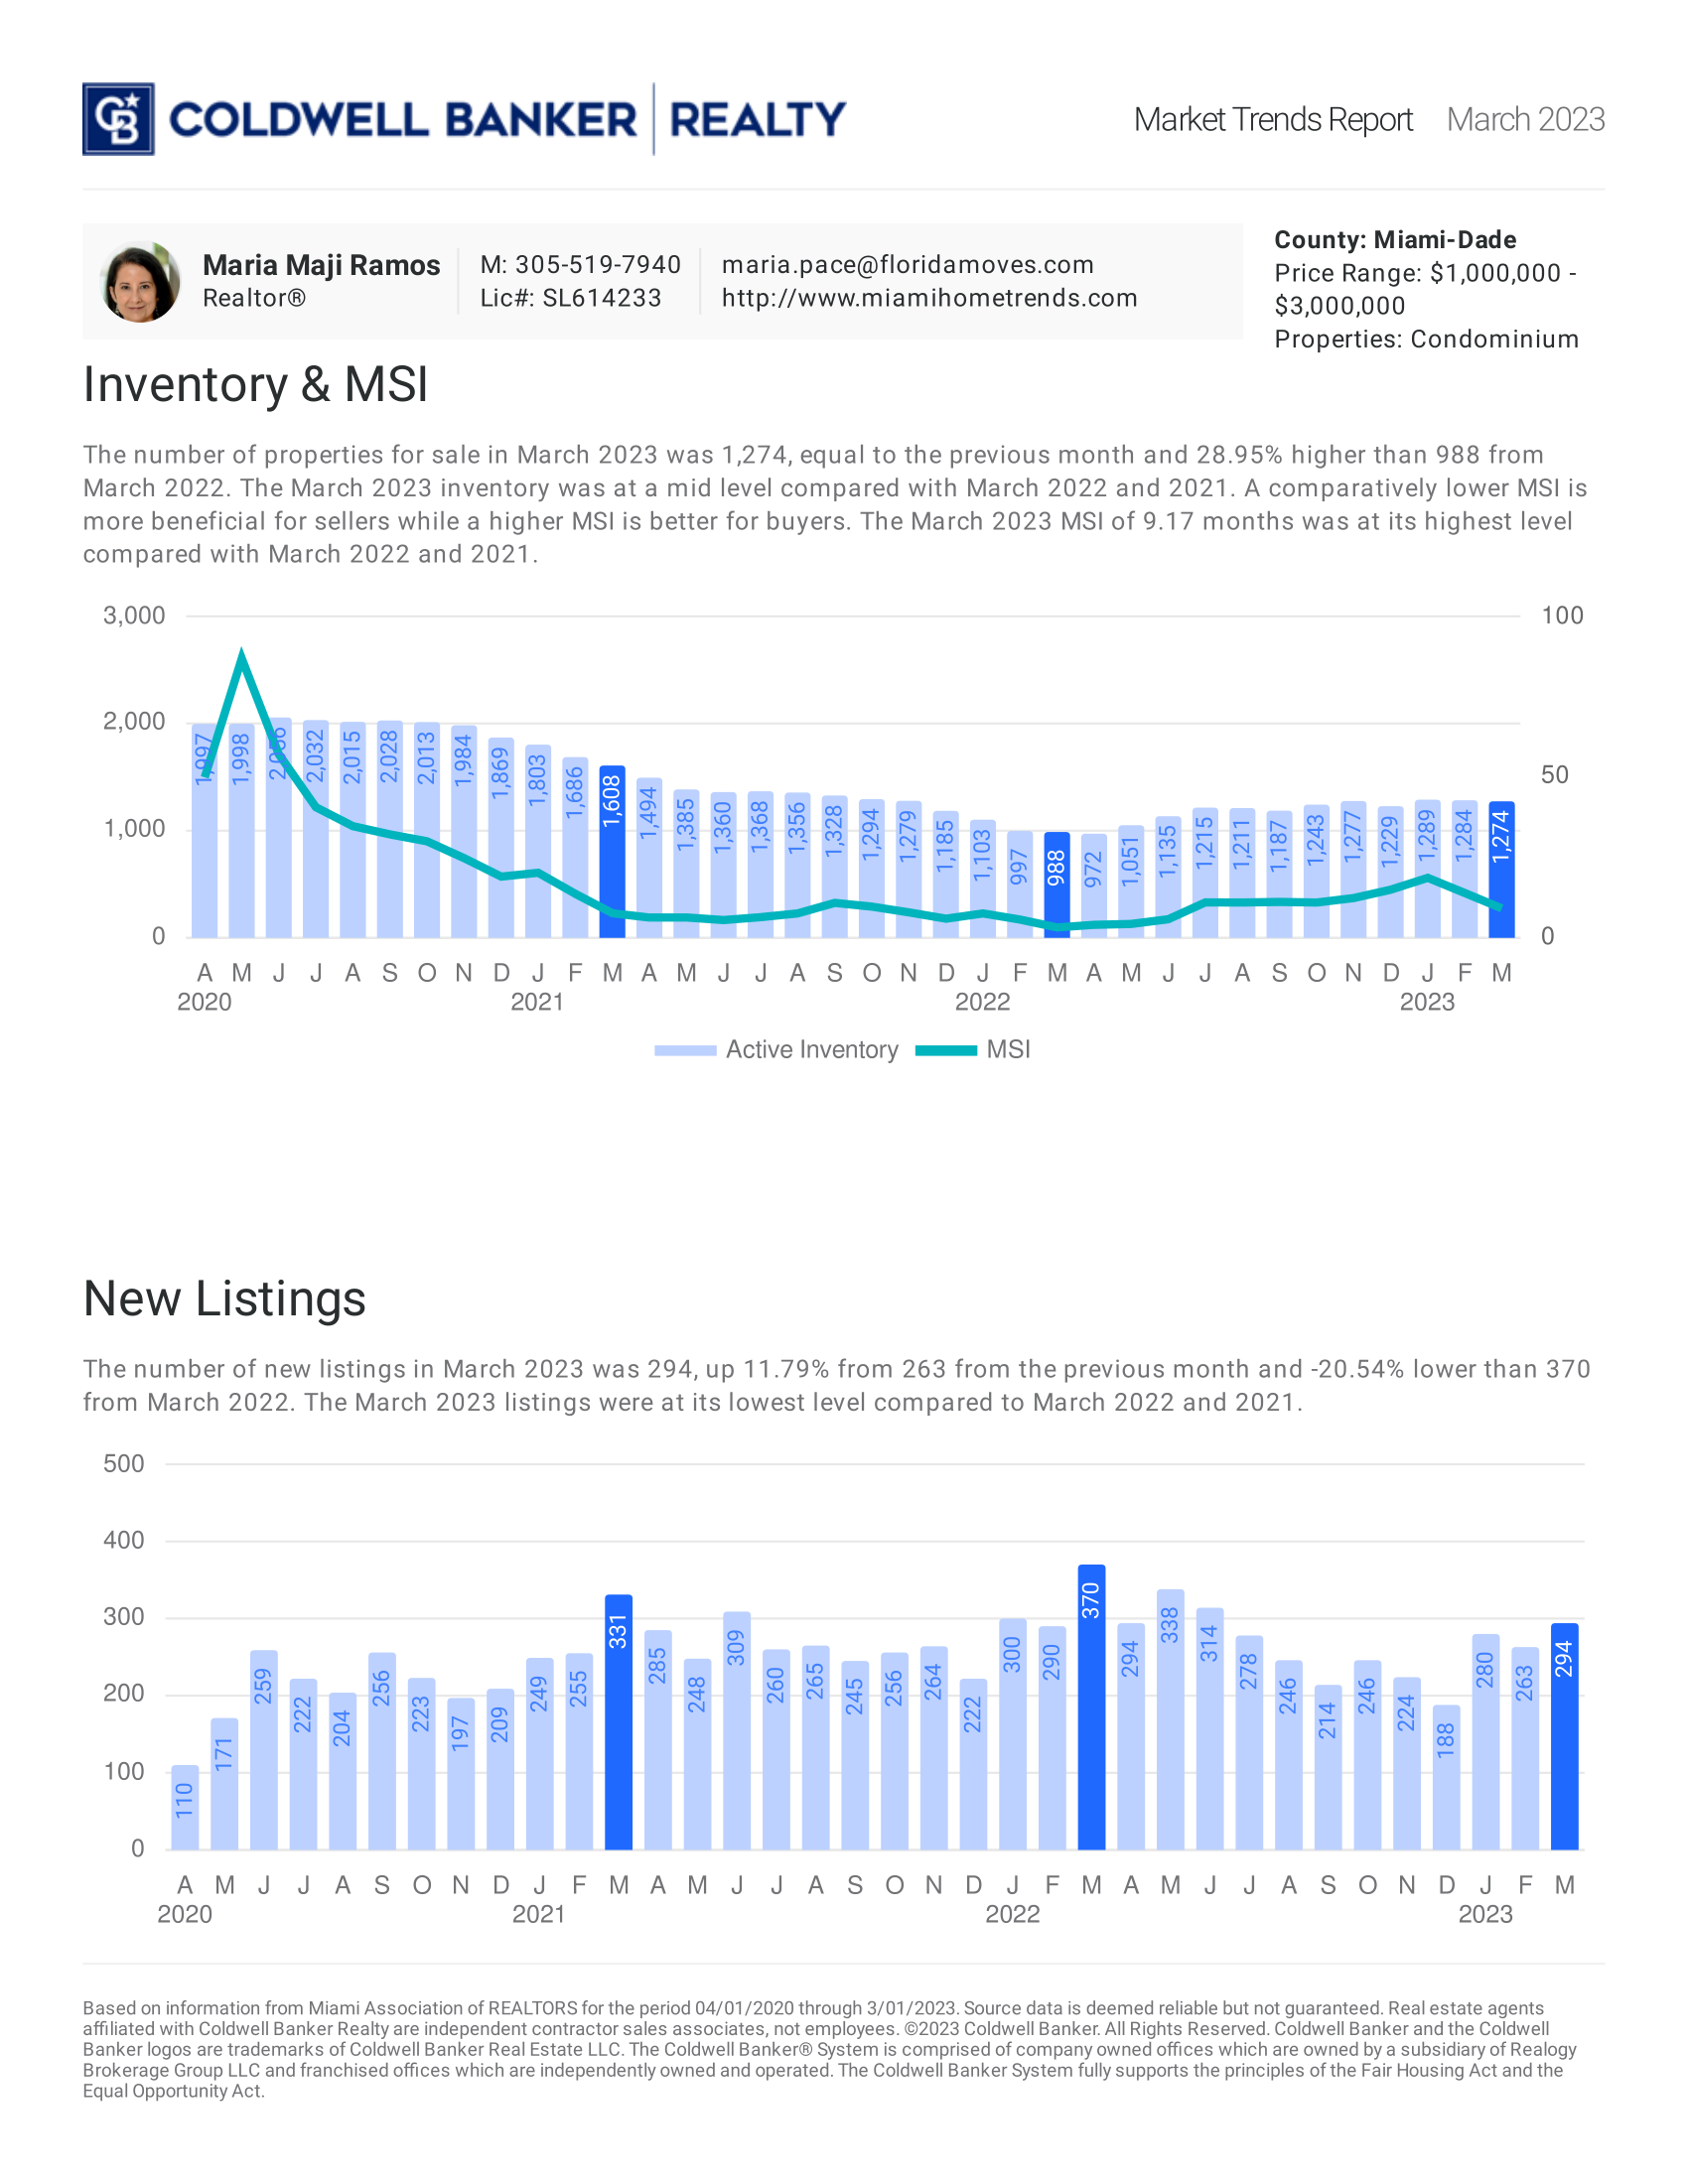
March 2023: Condo

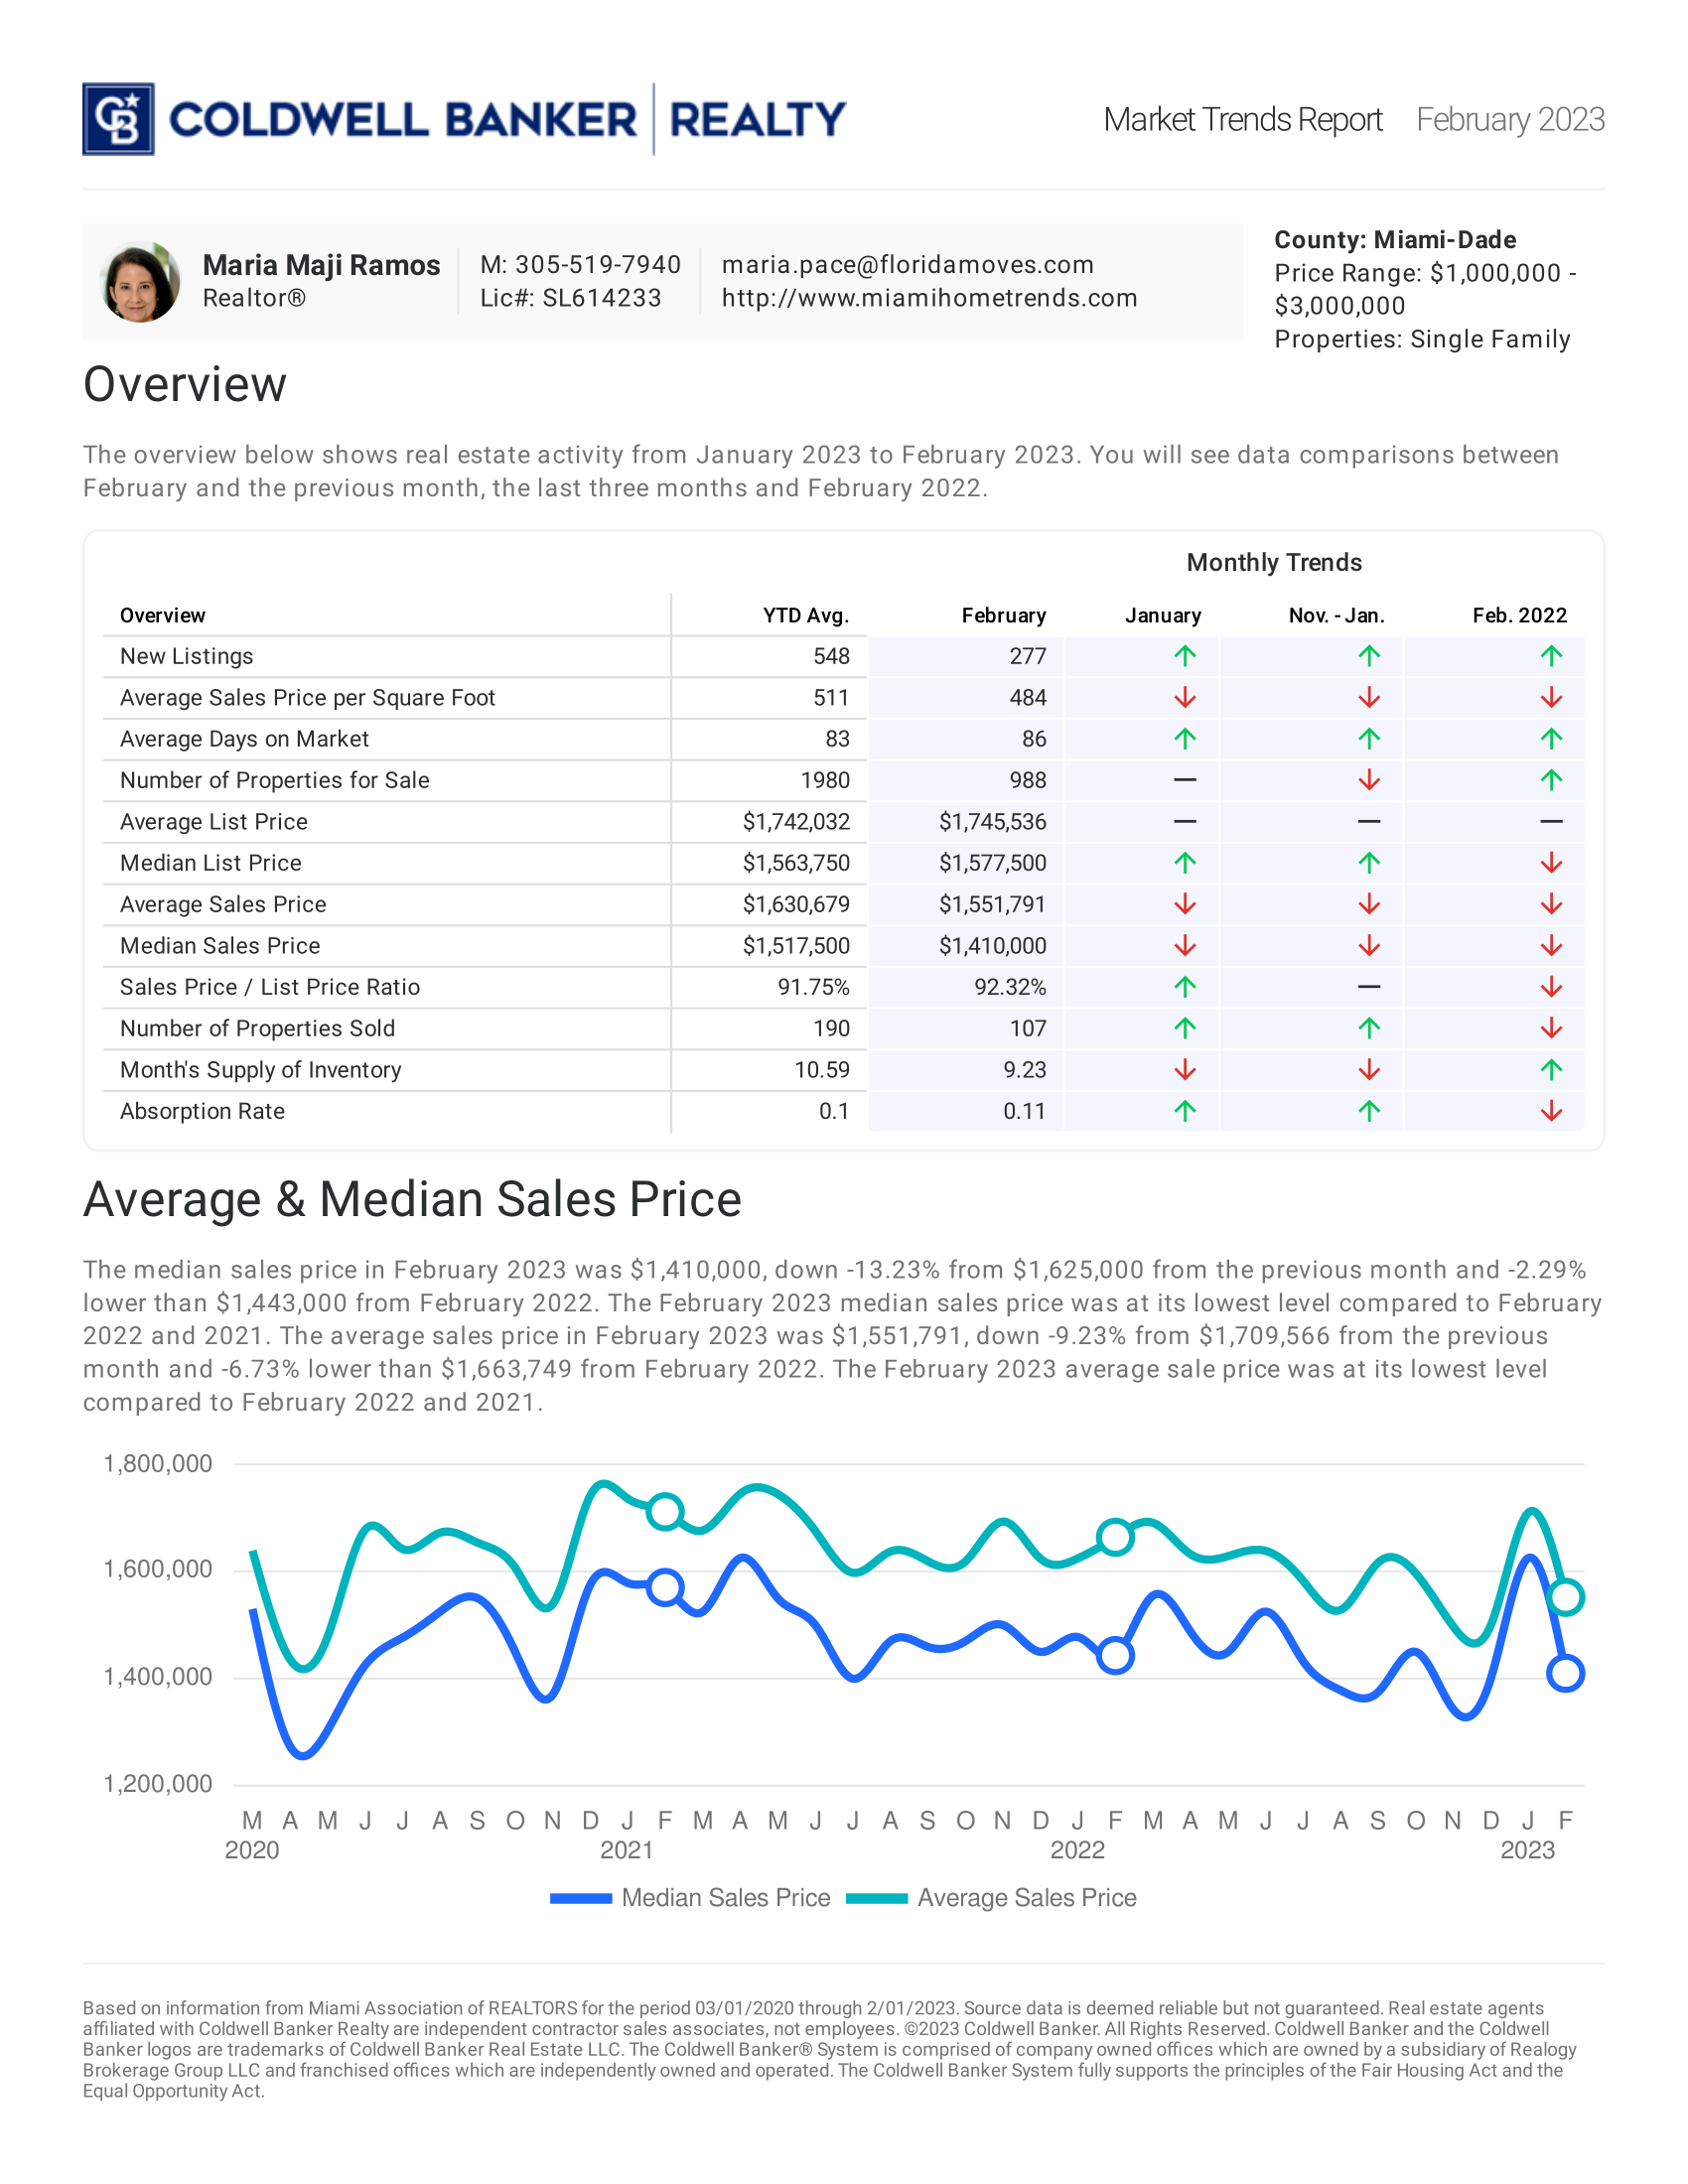
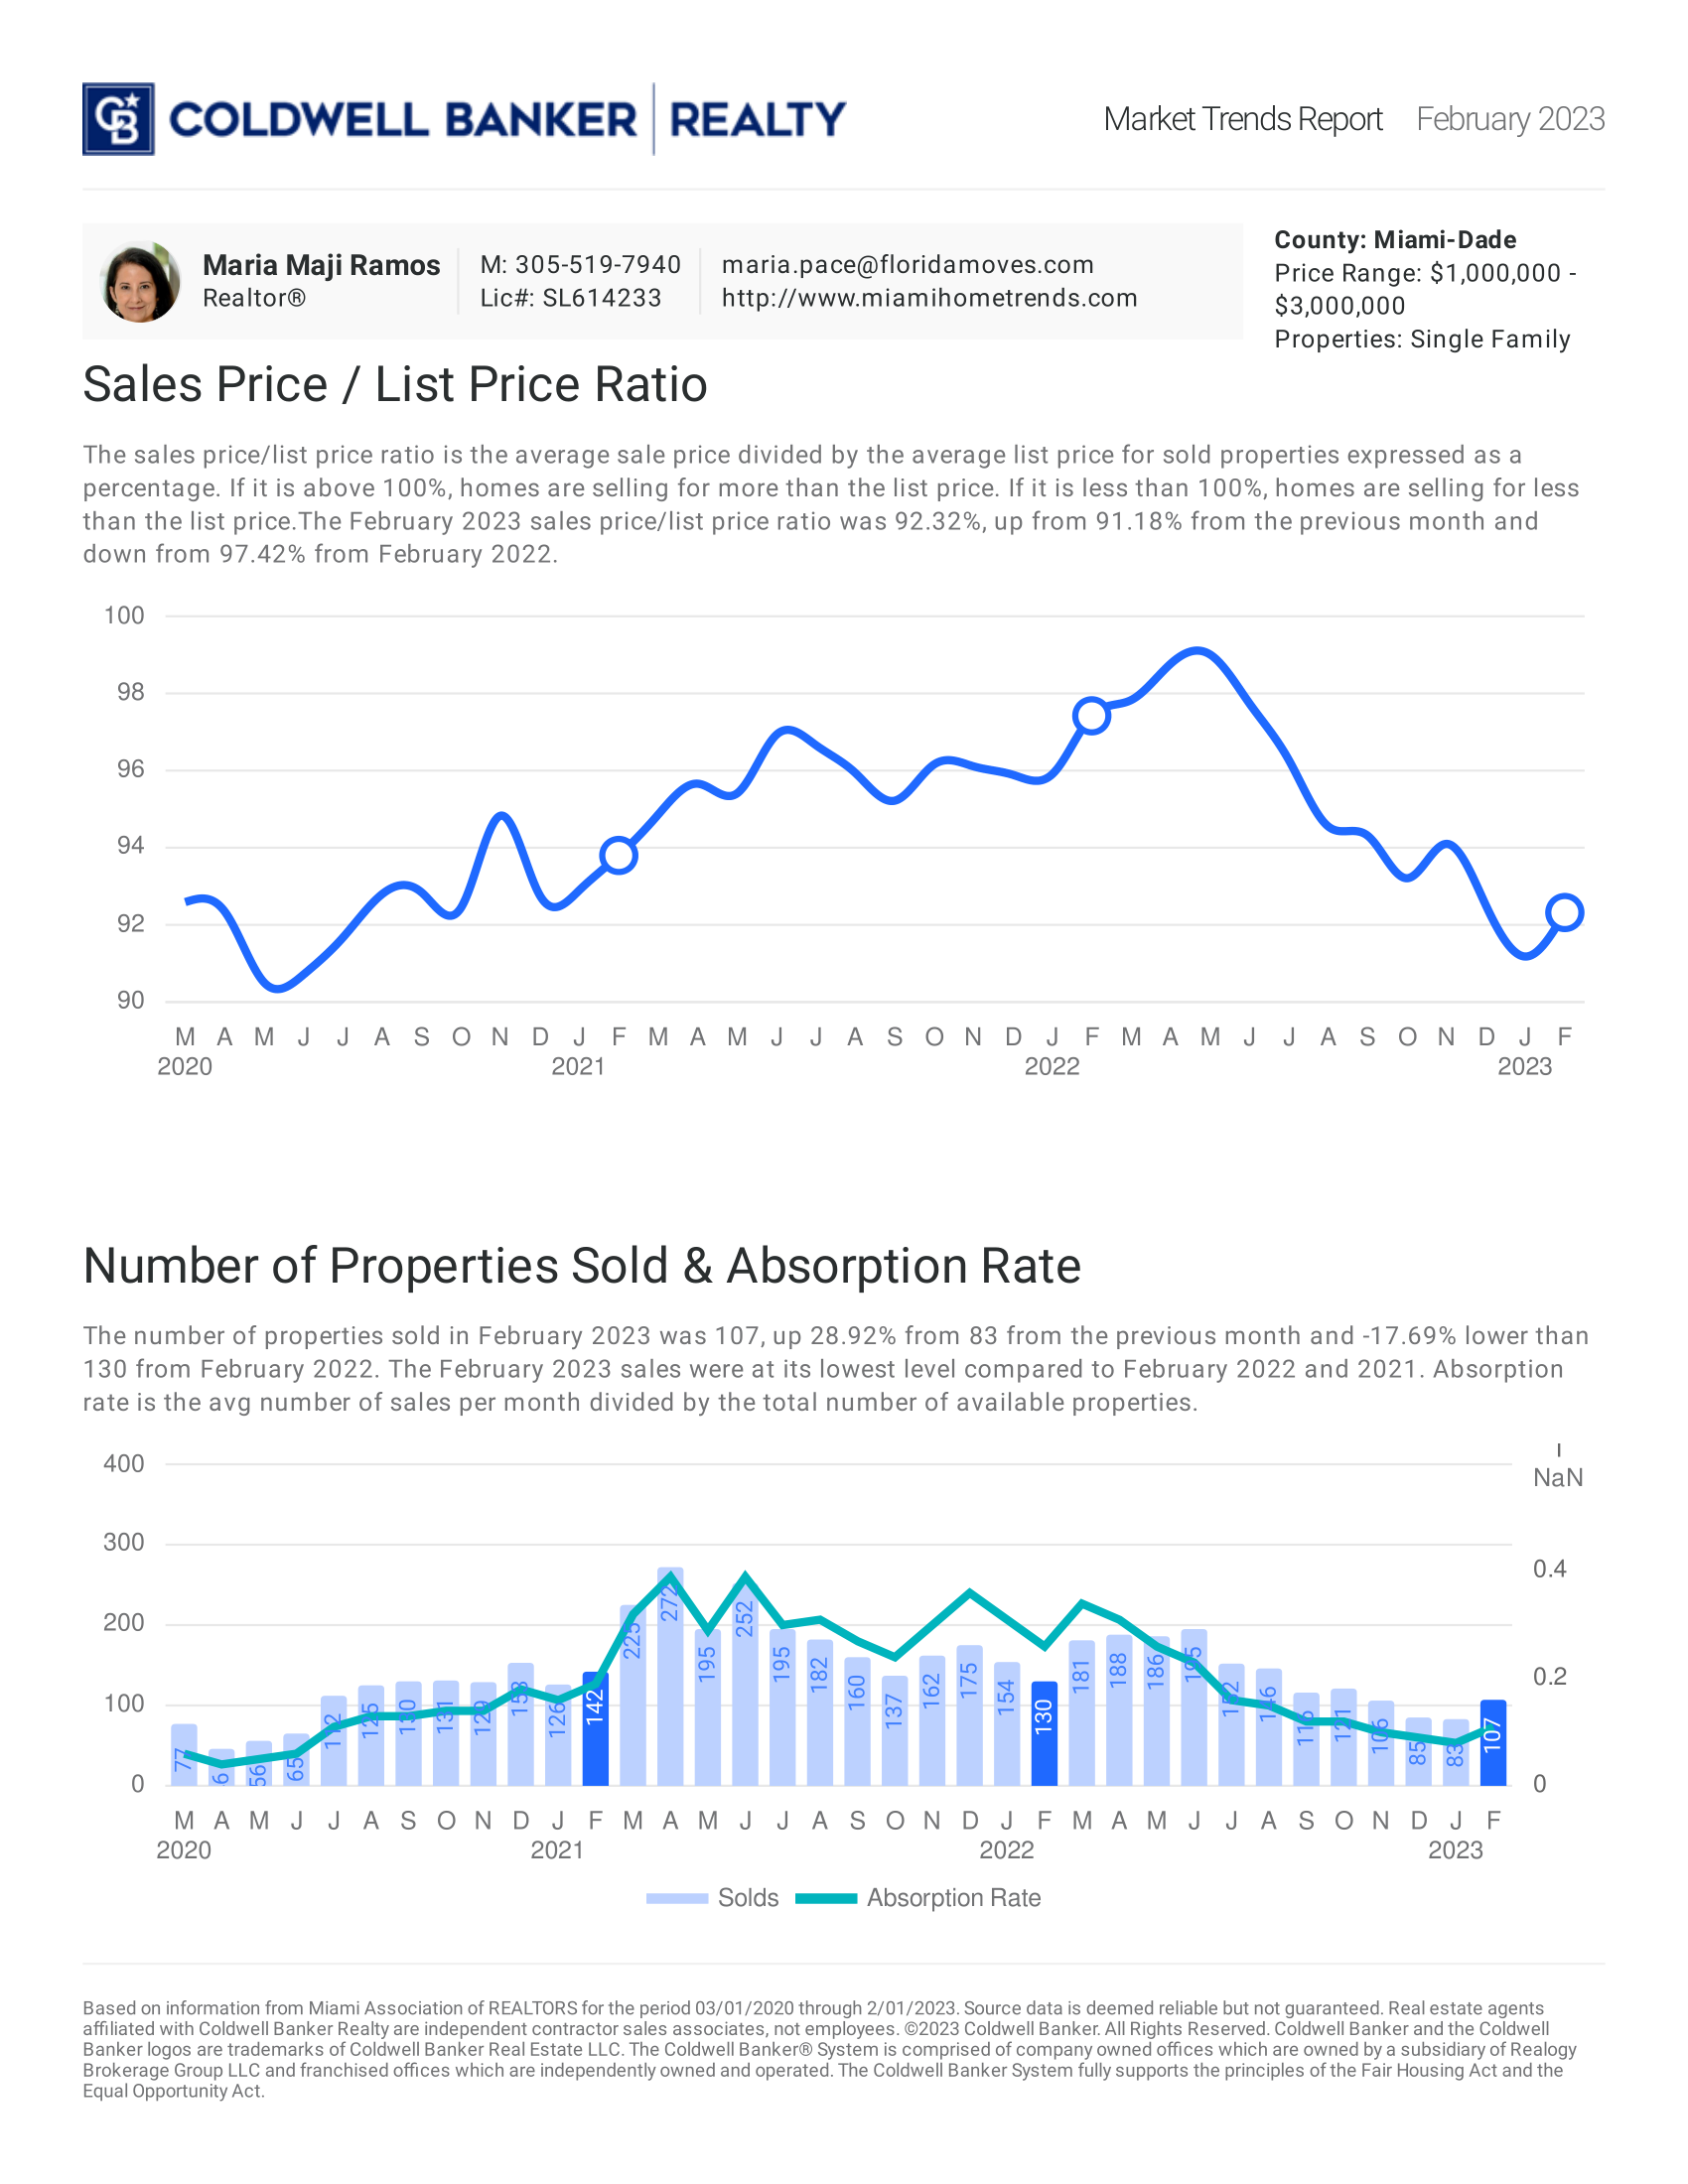
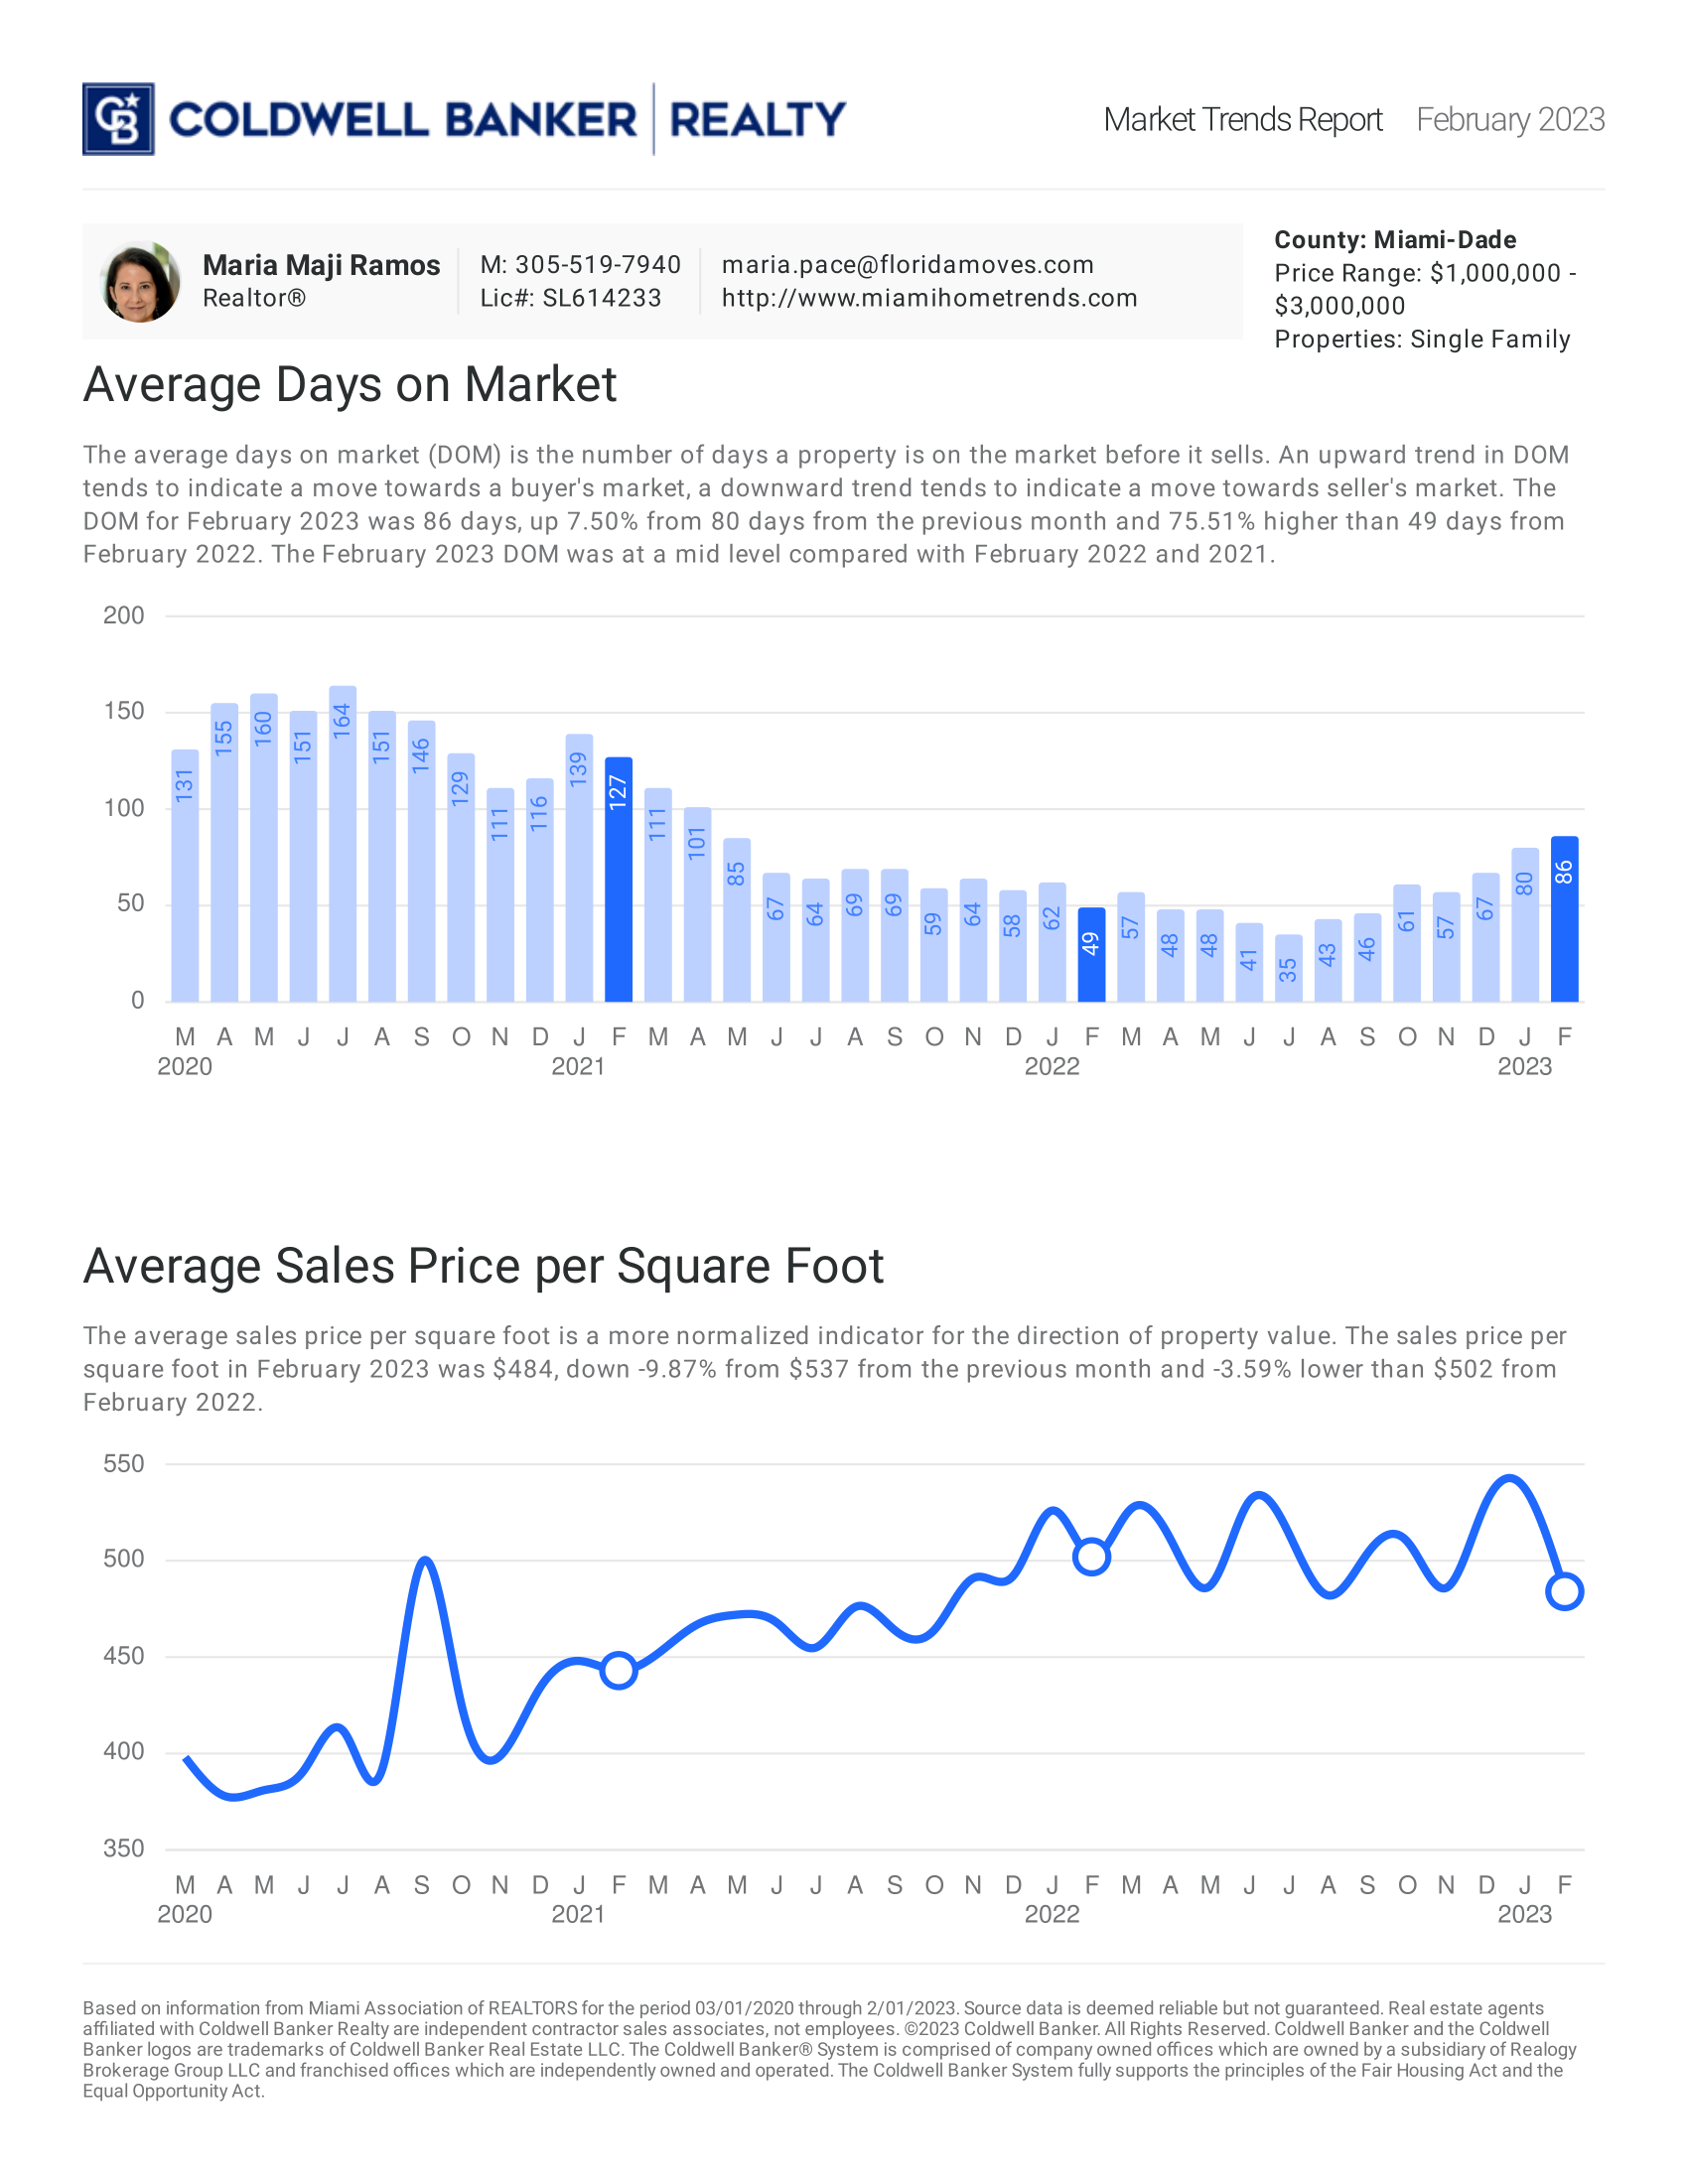
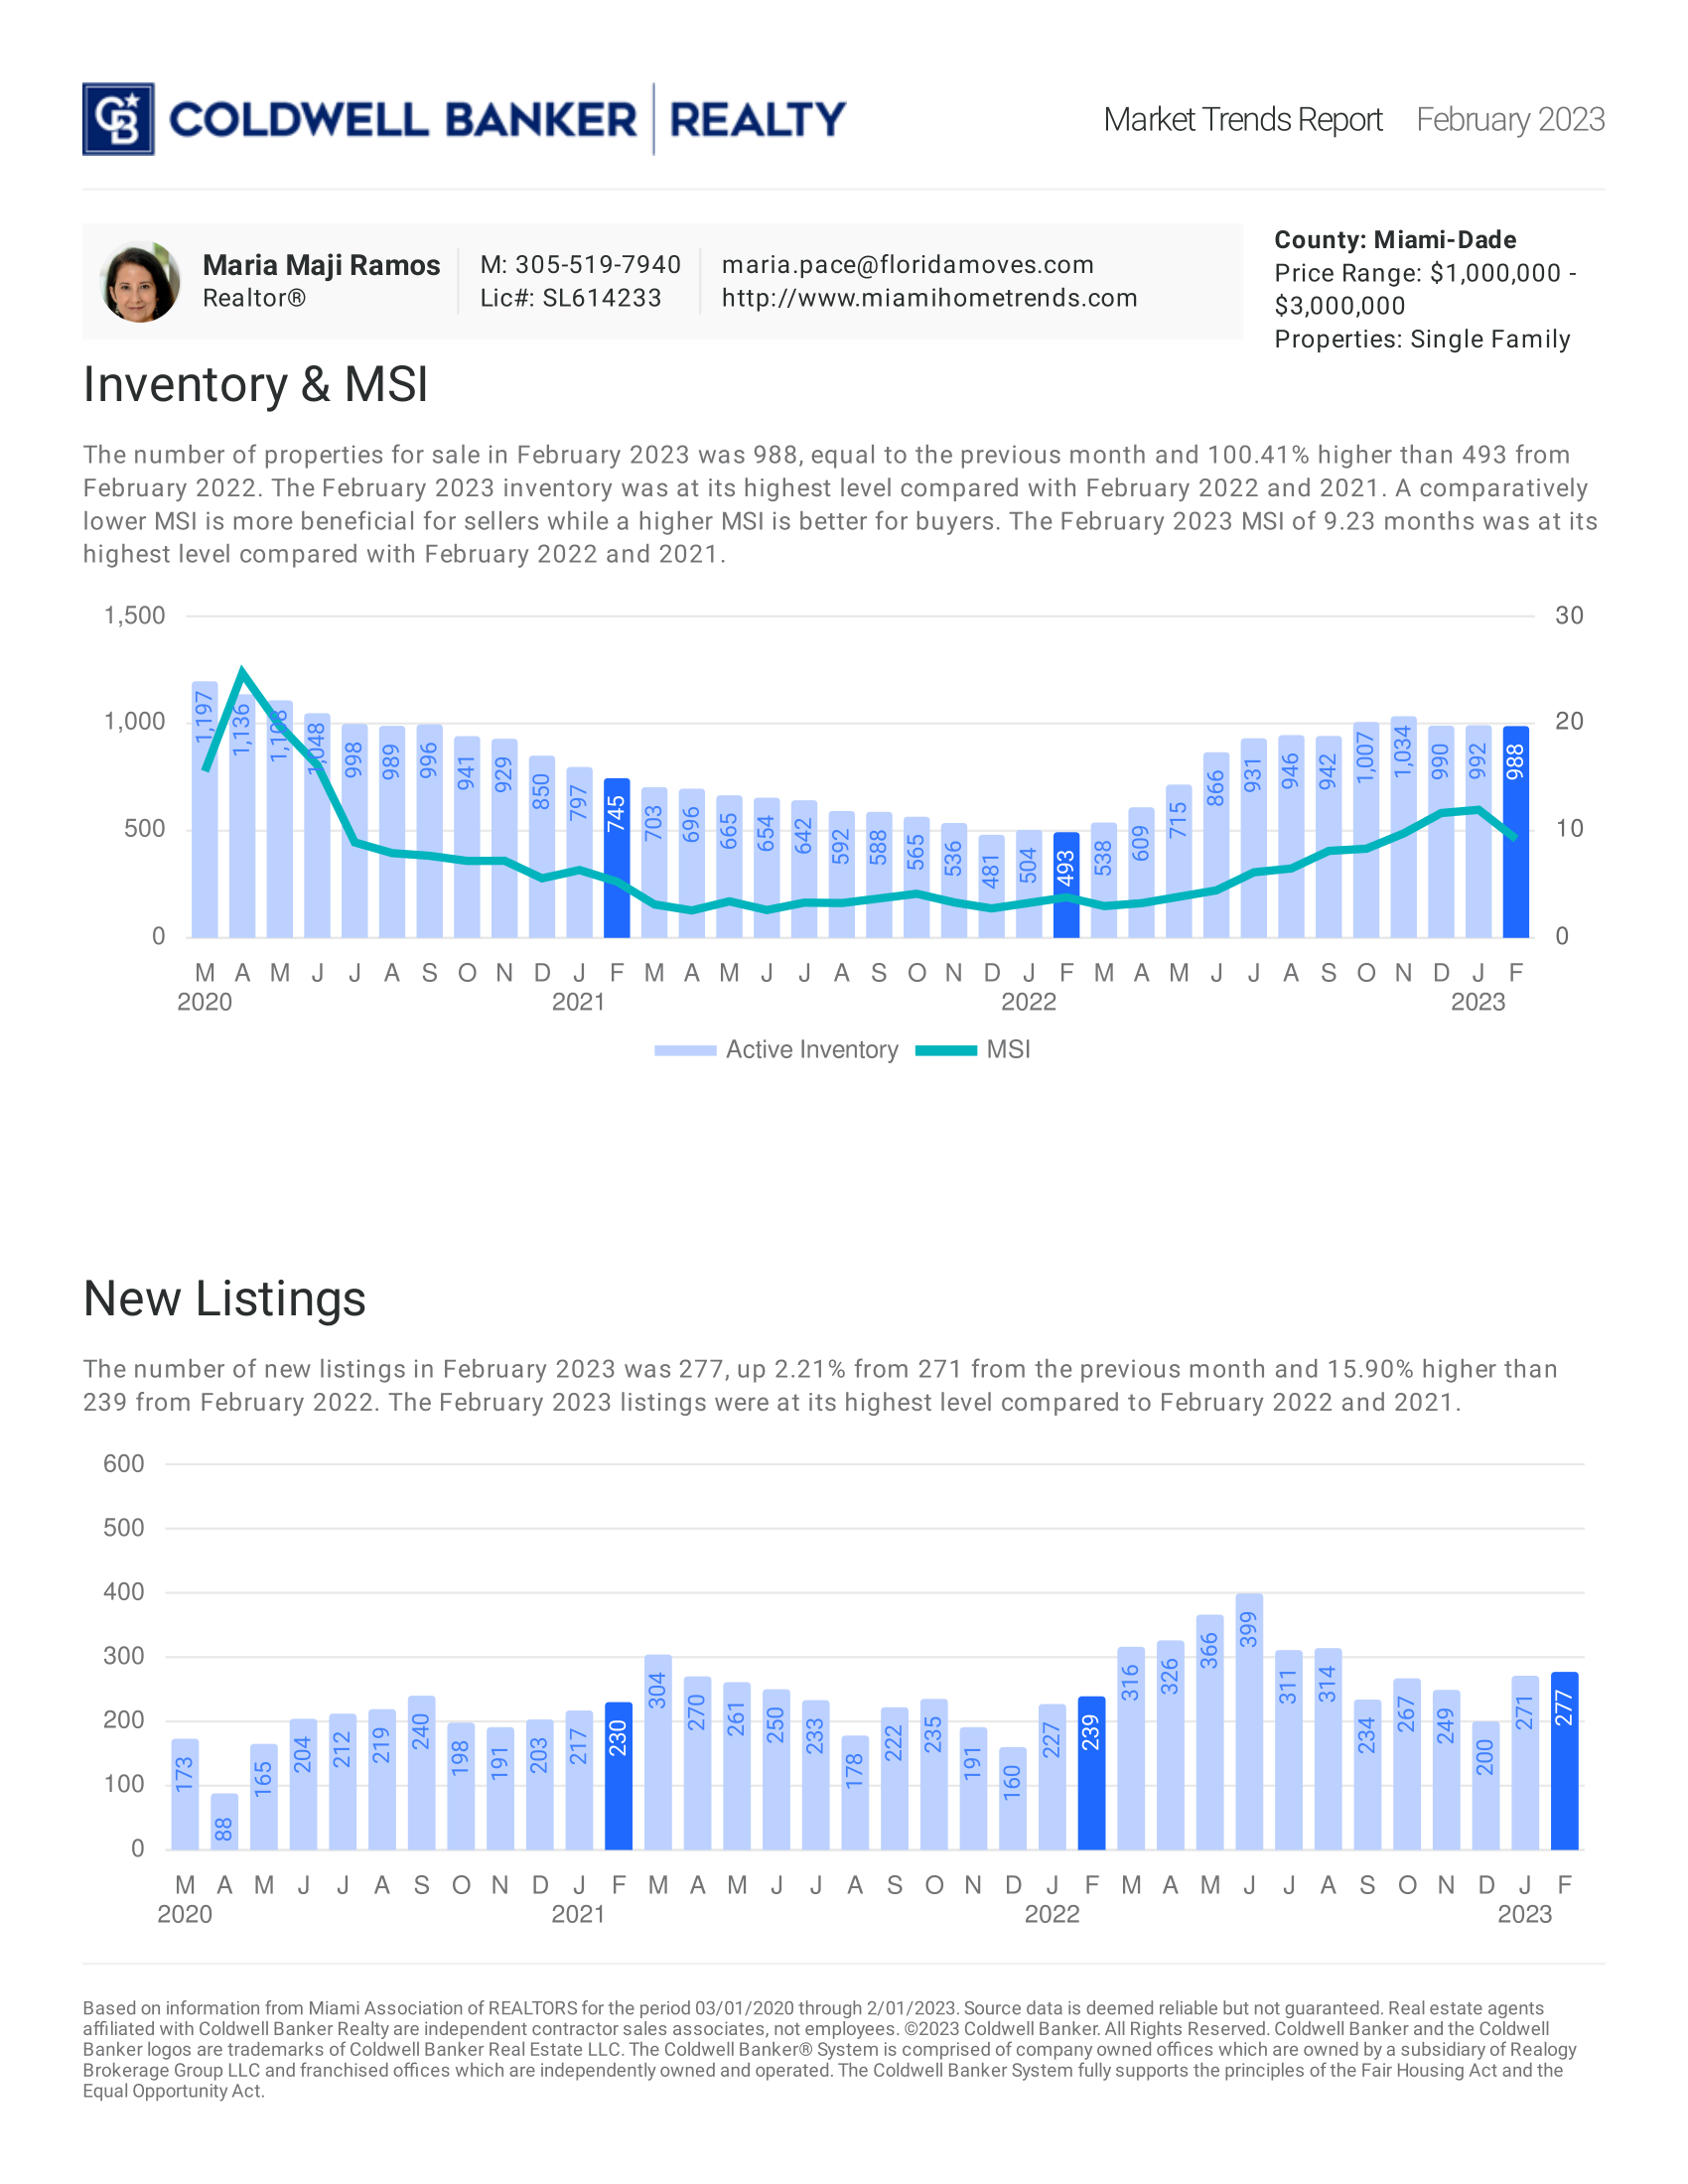
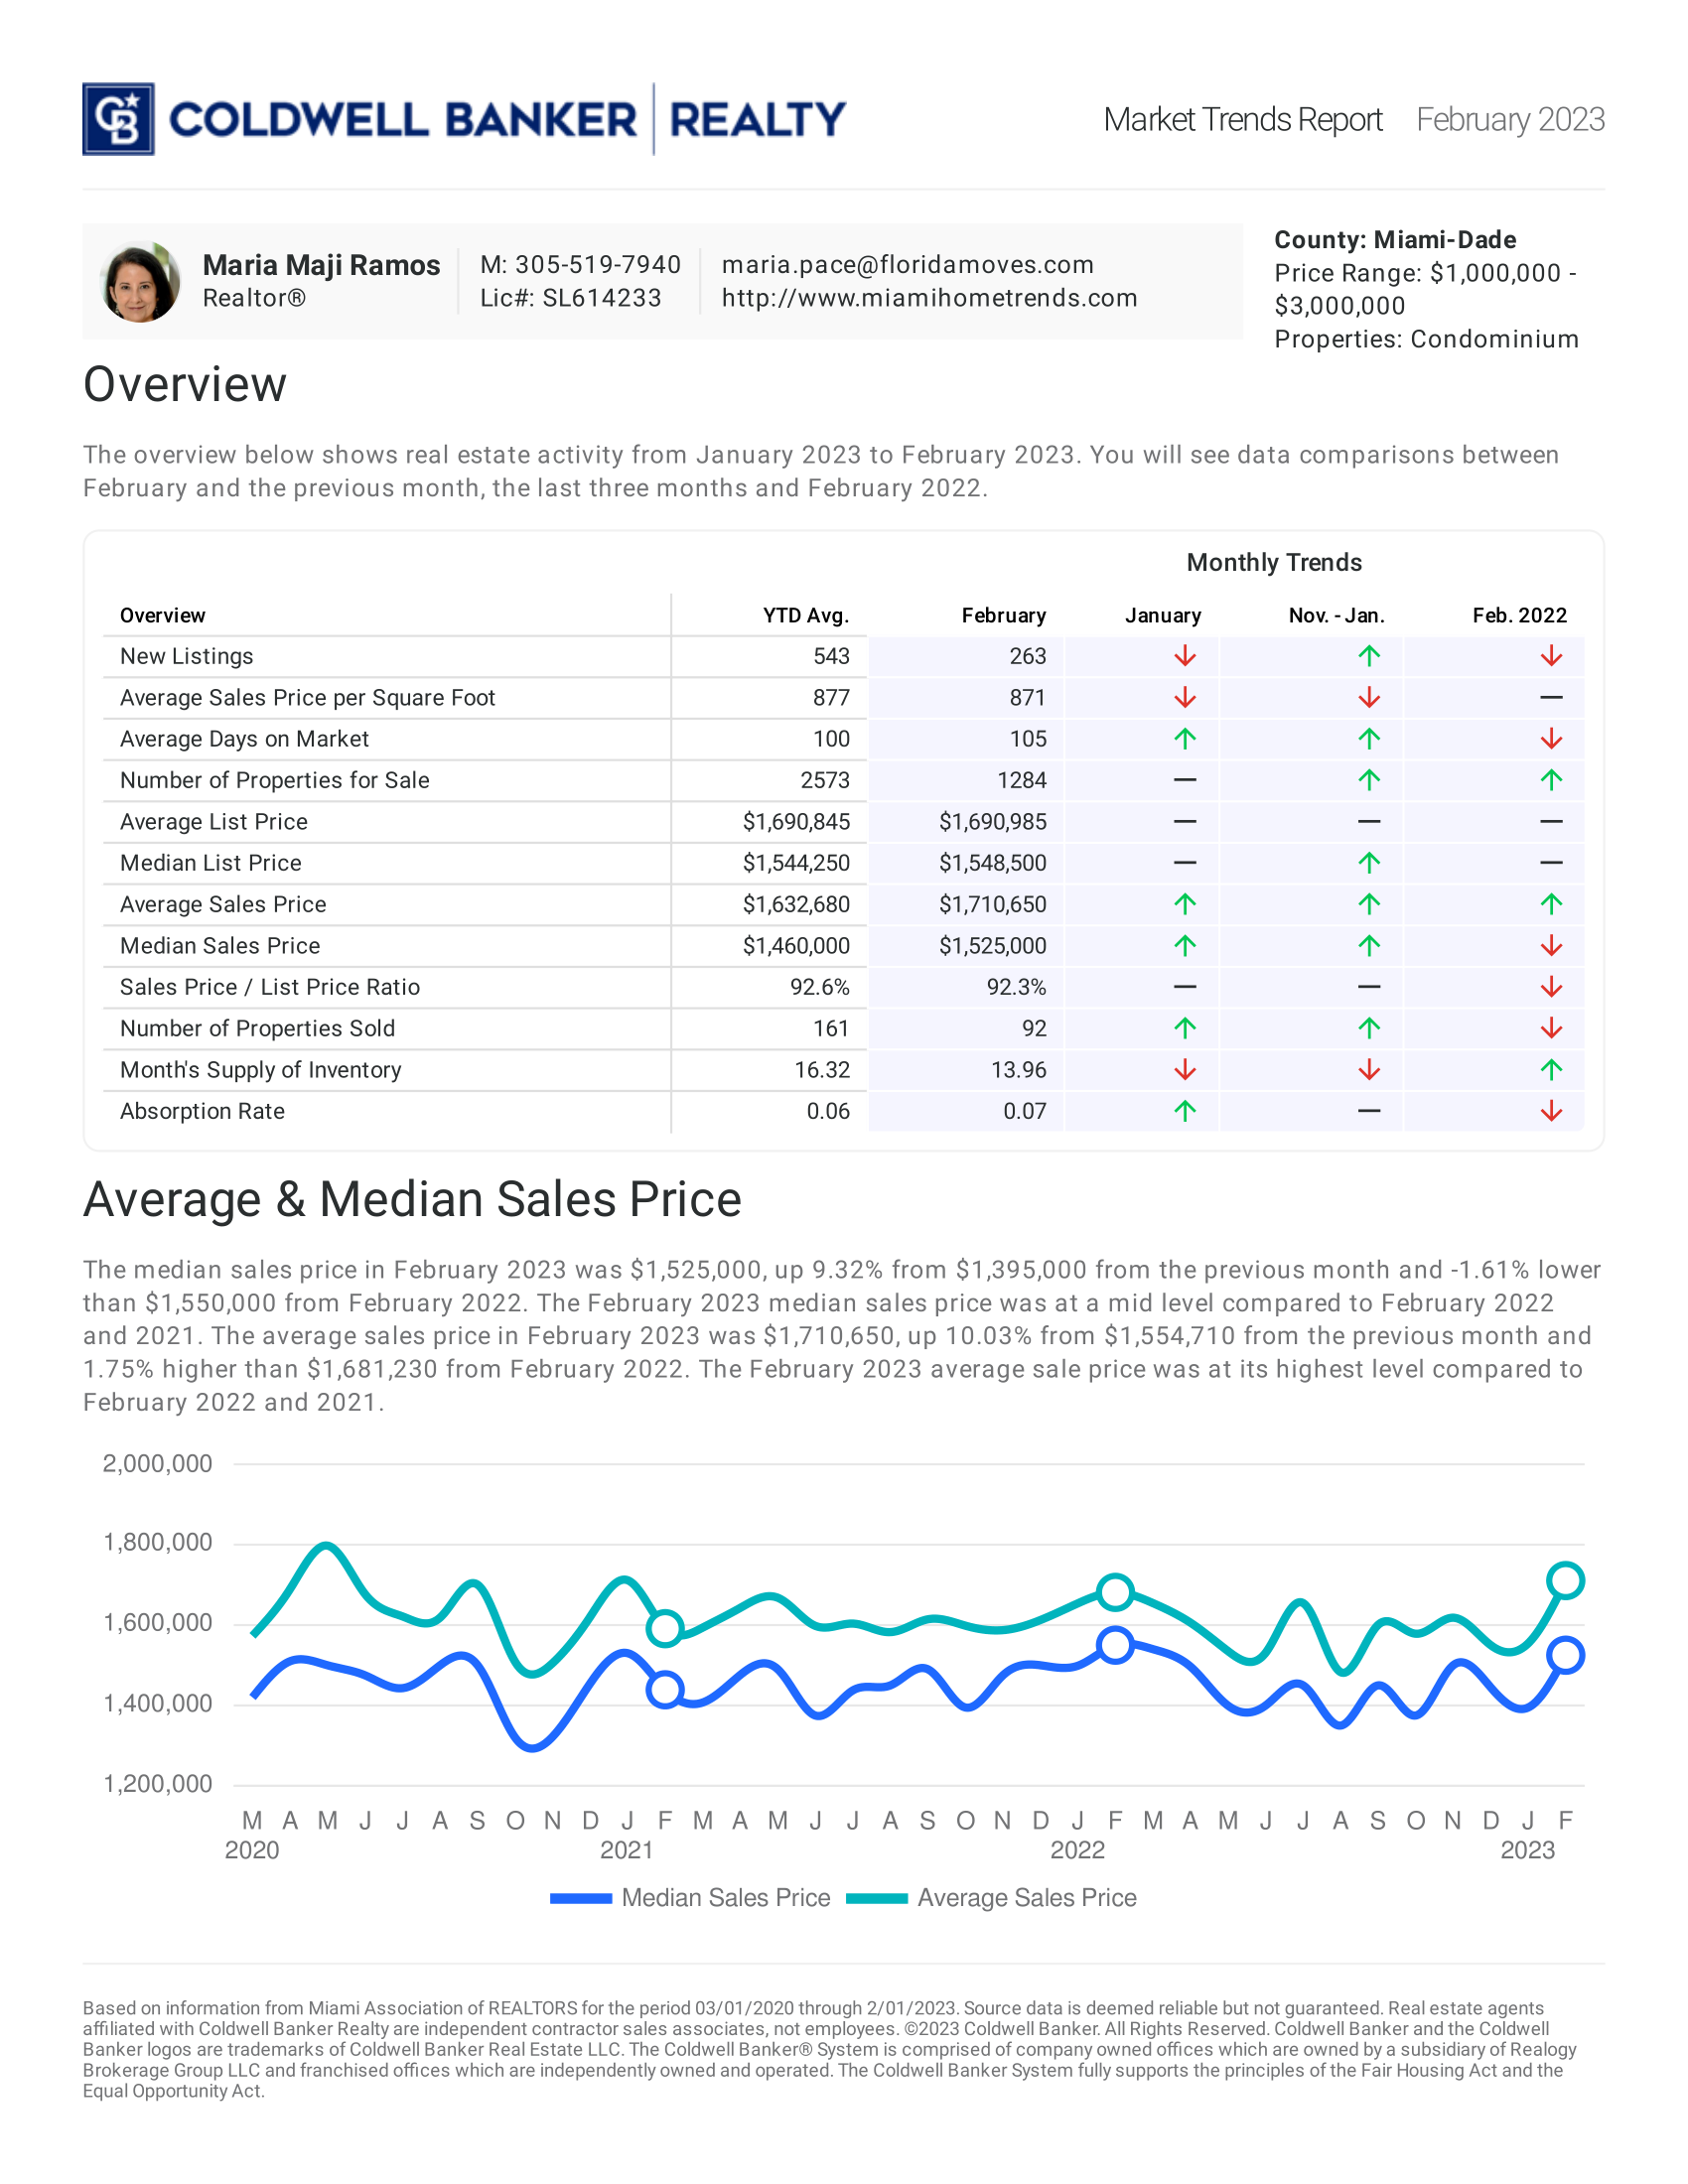
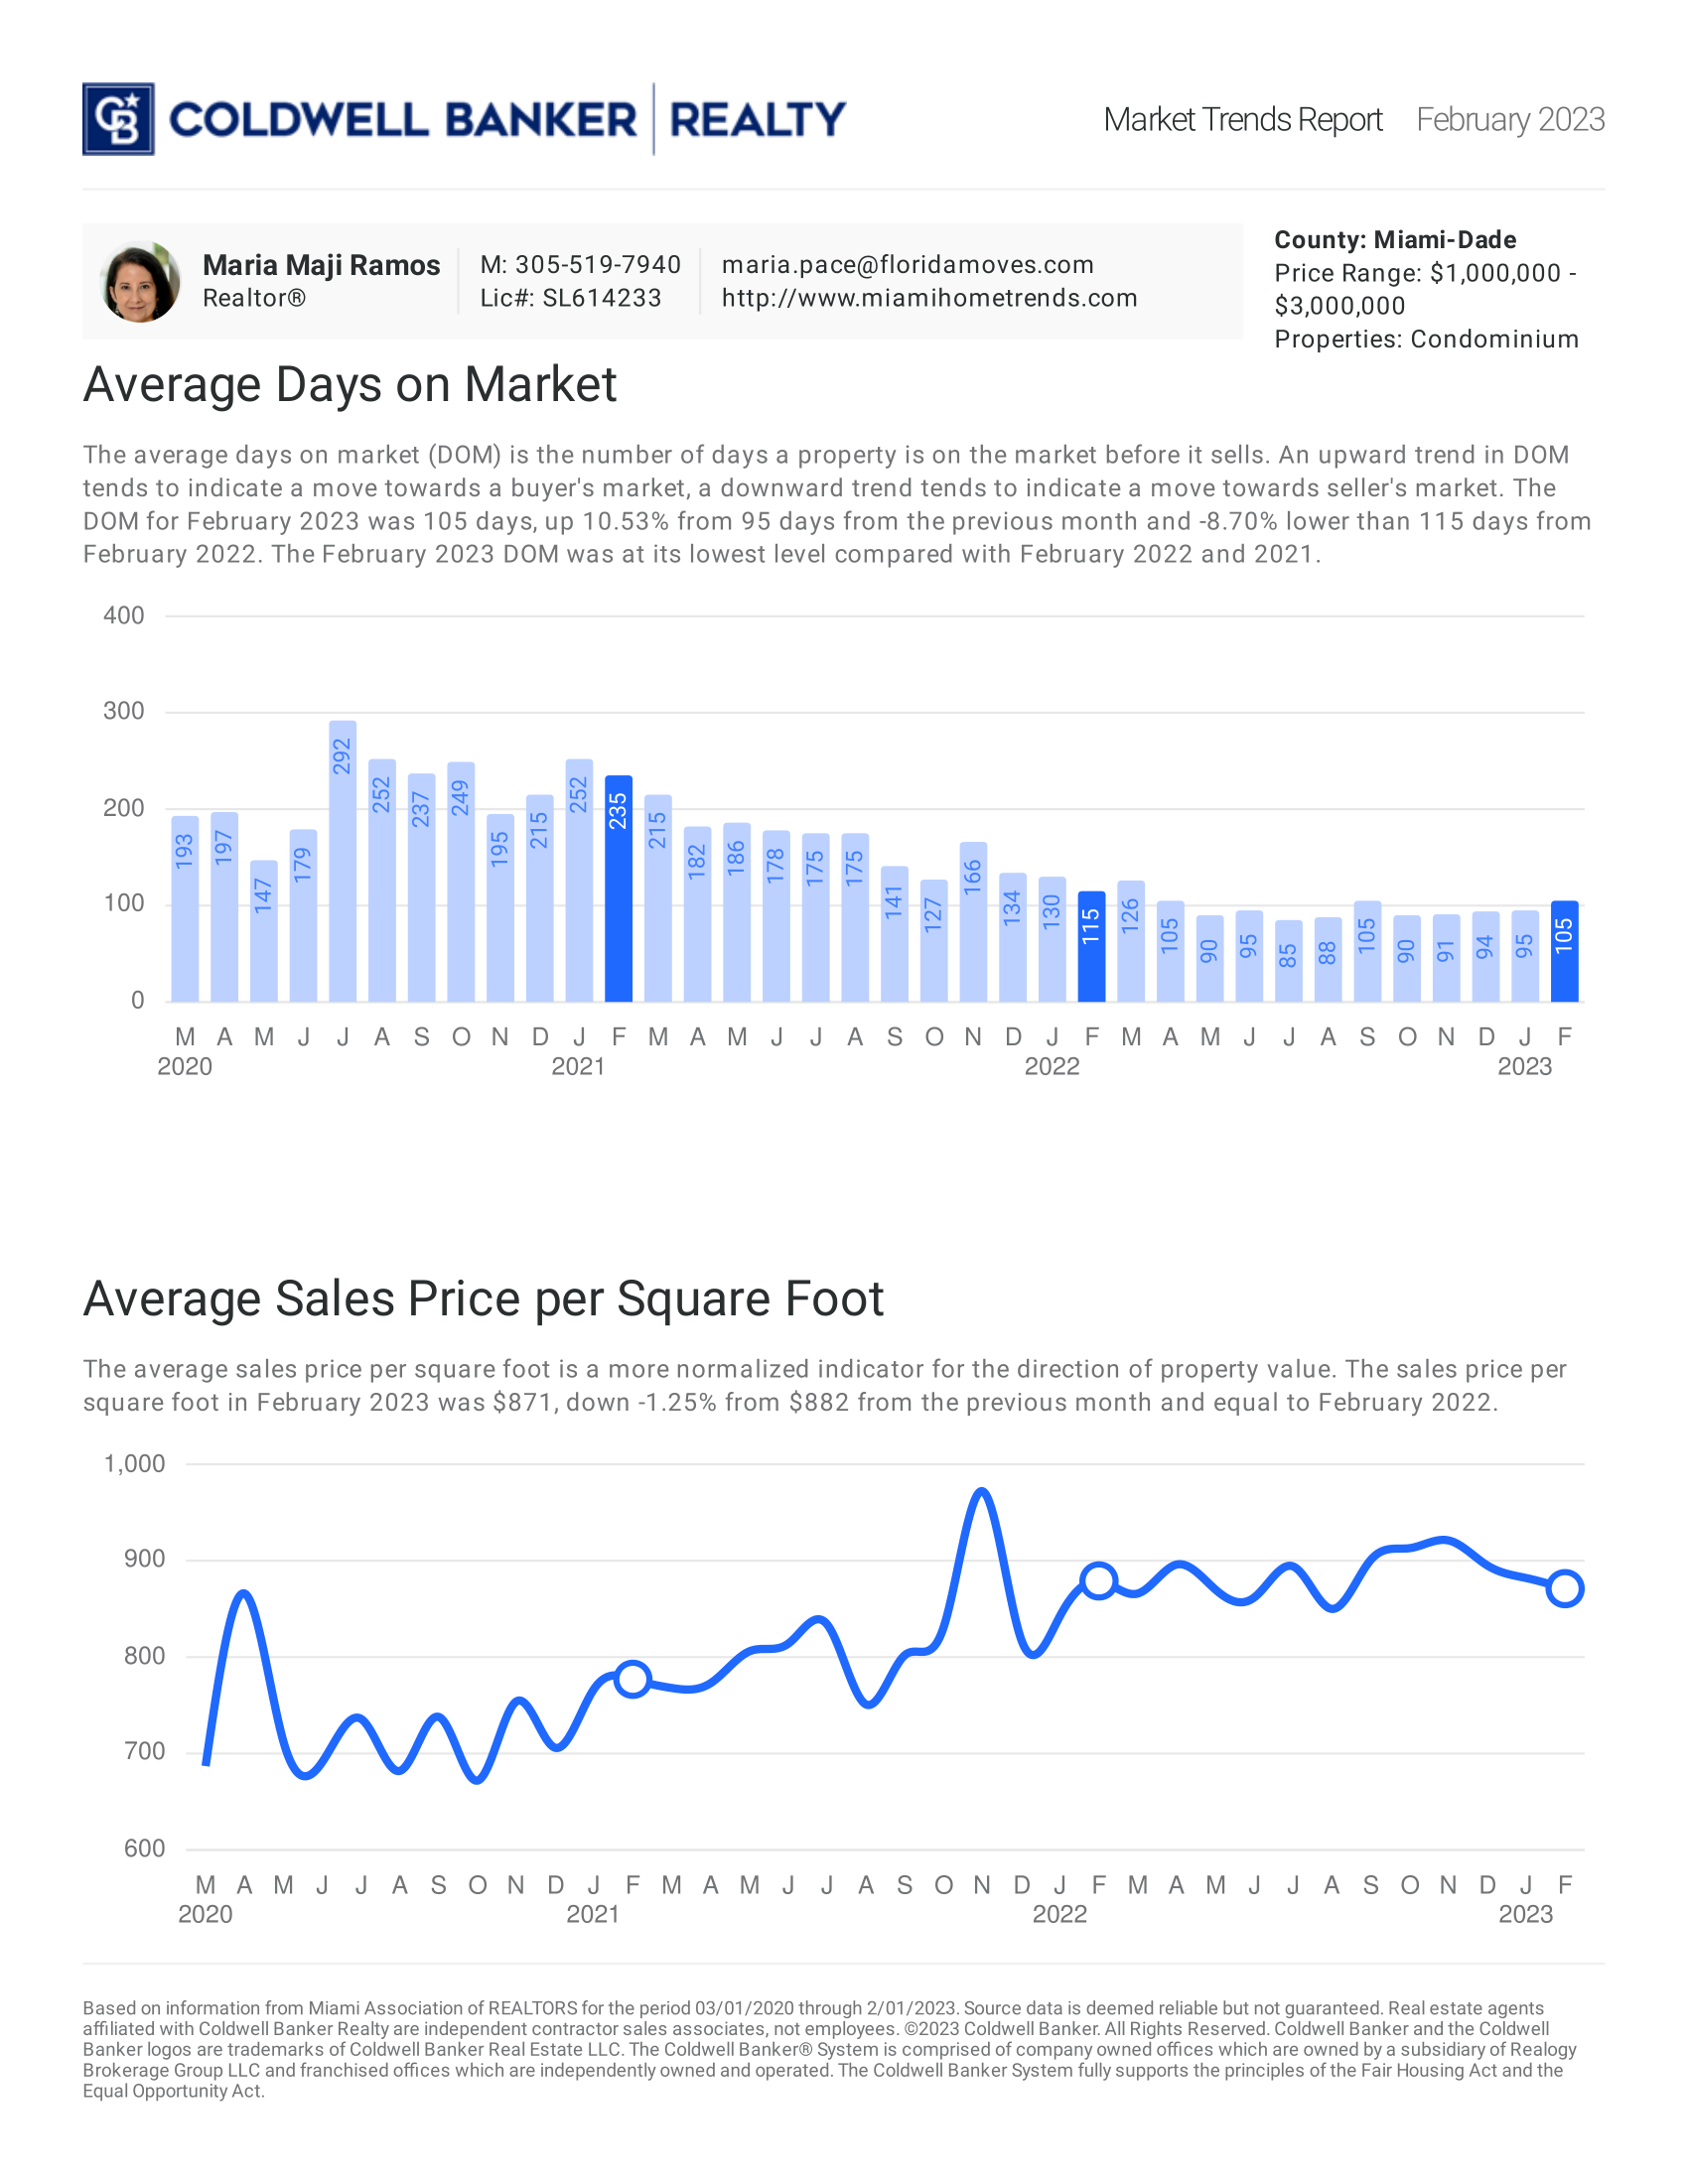
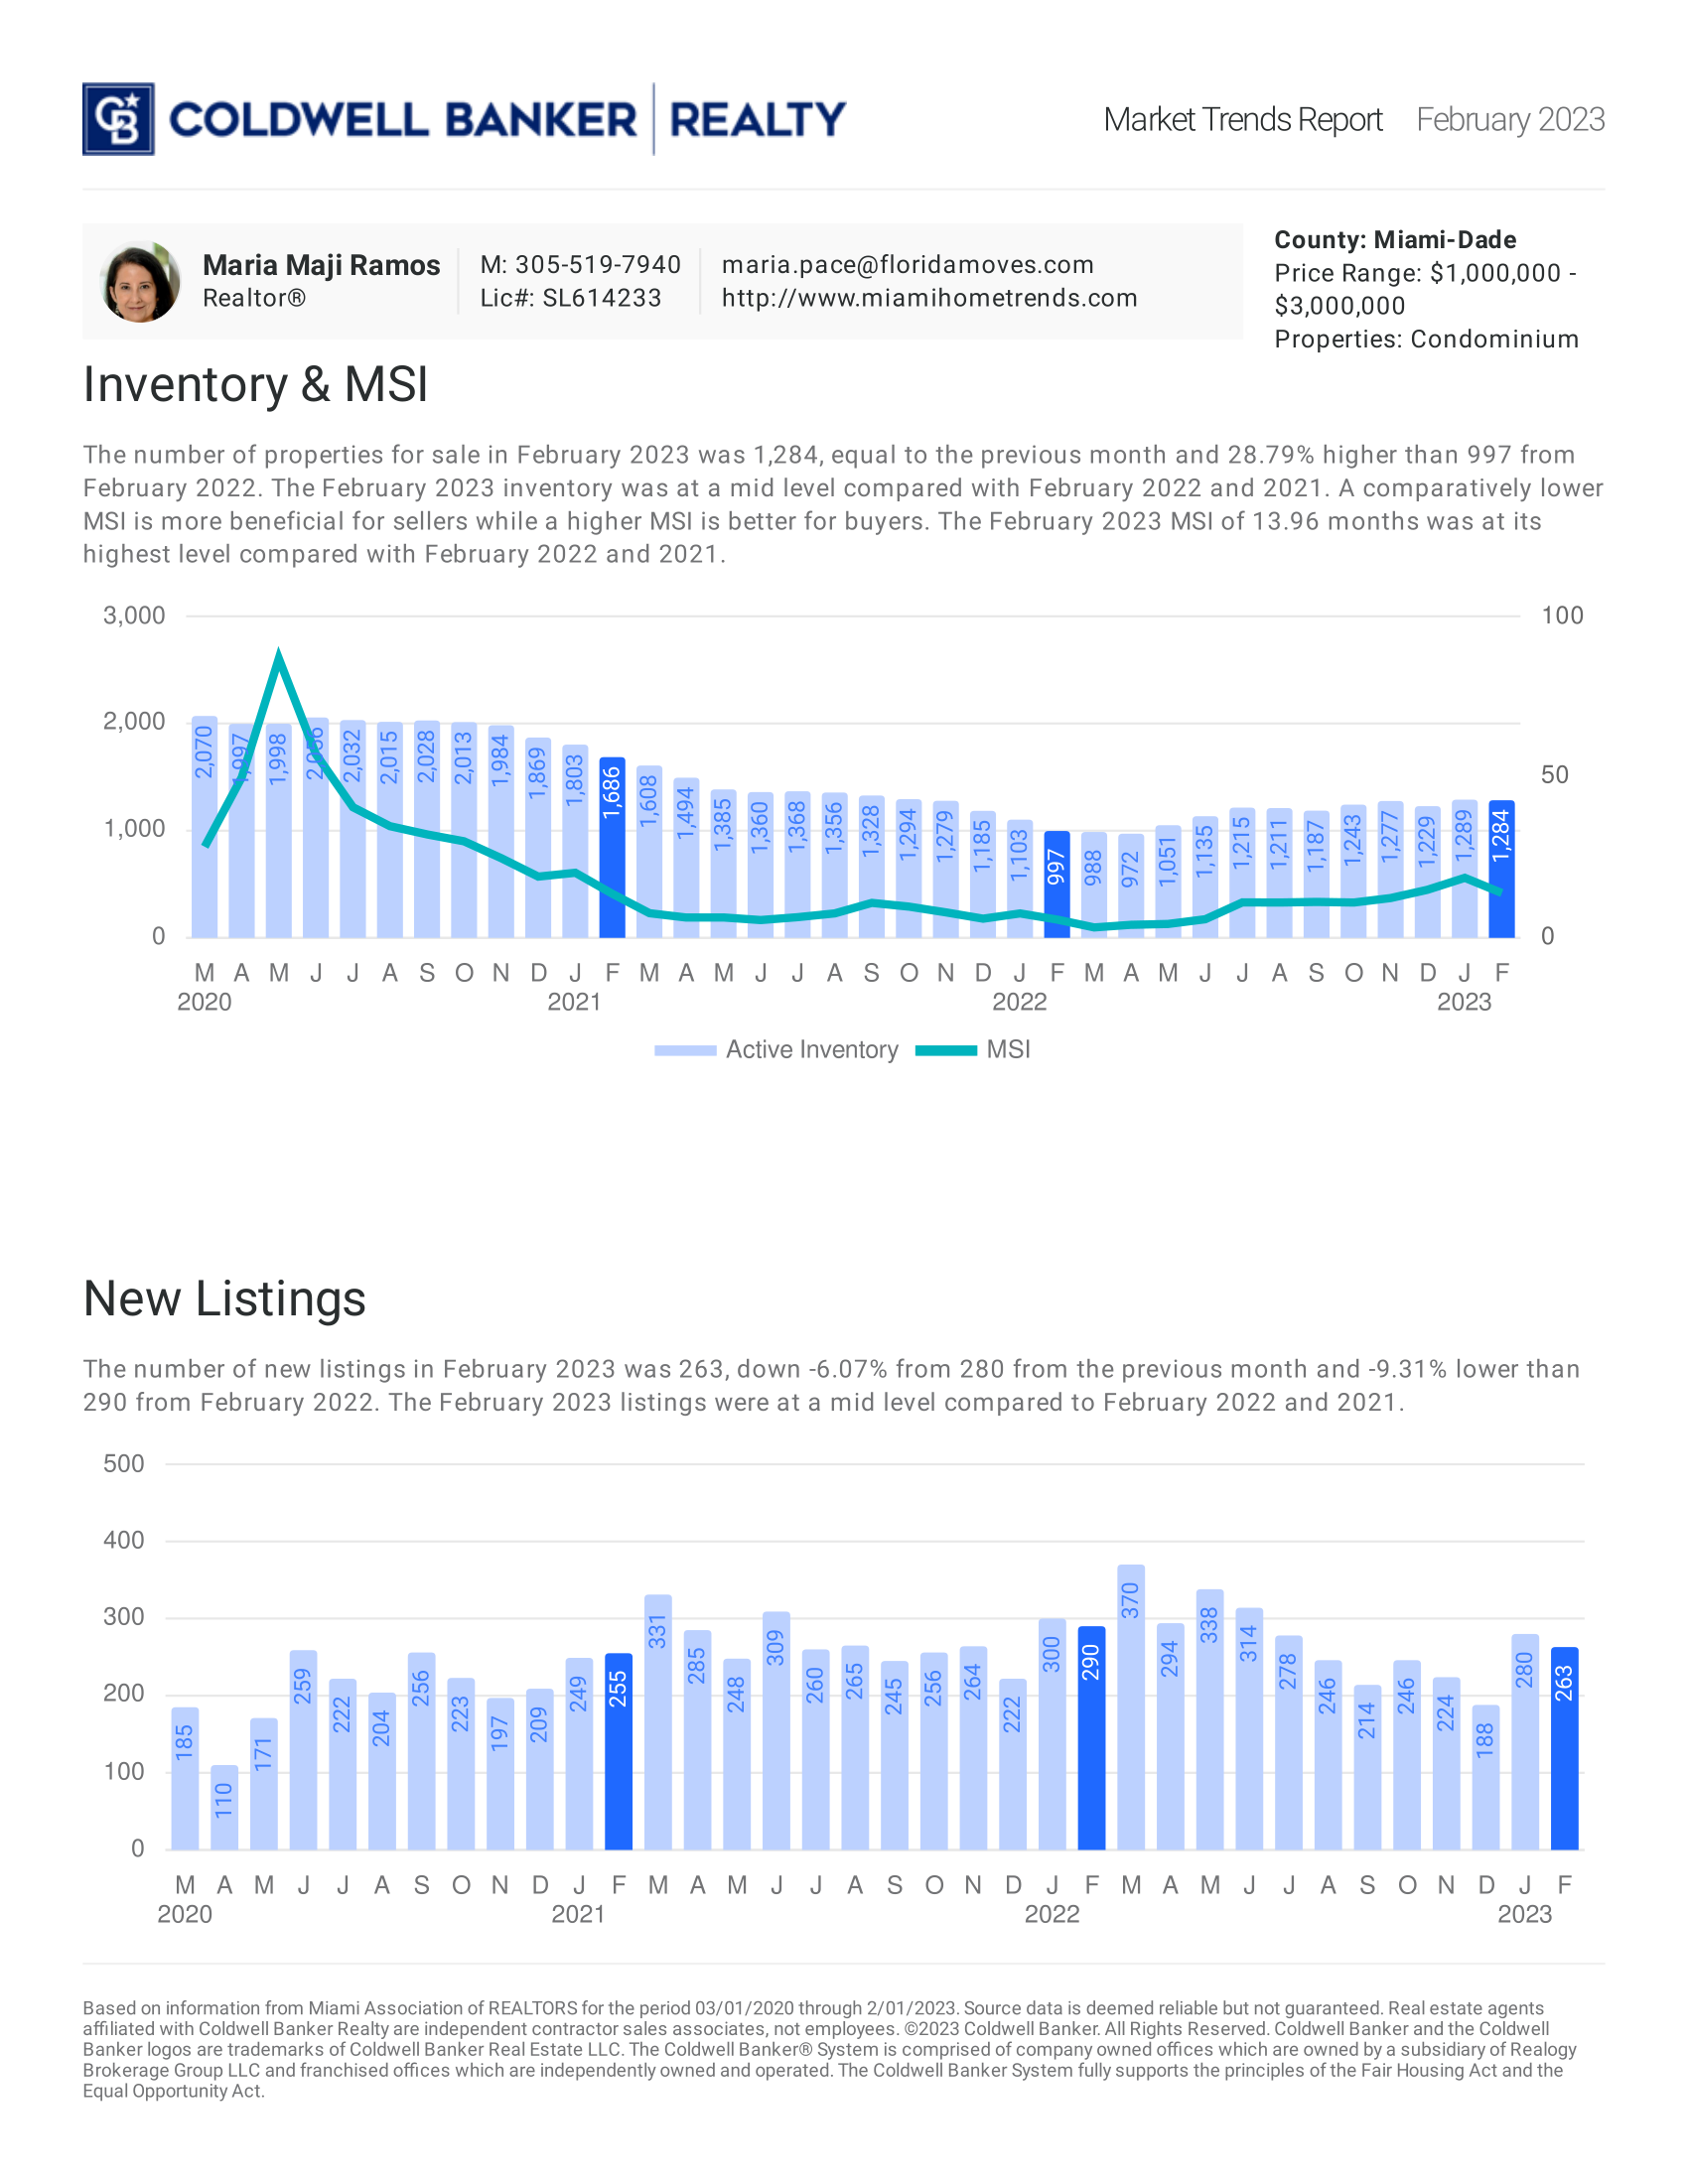
February 2023: Single Family

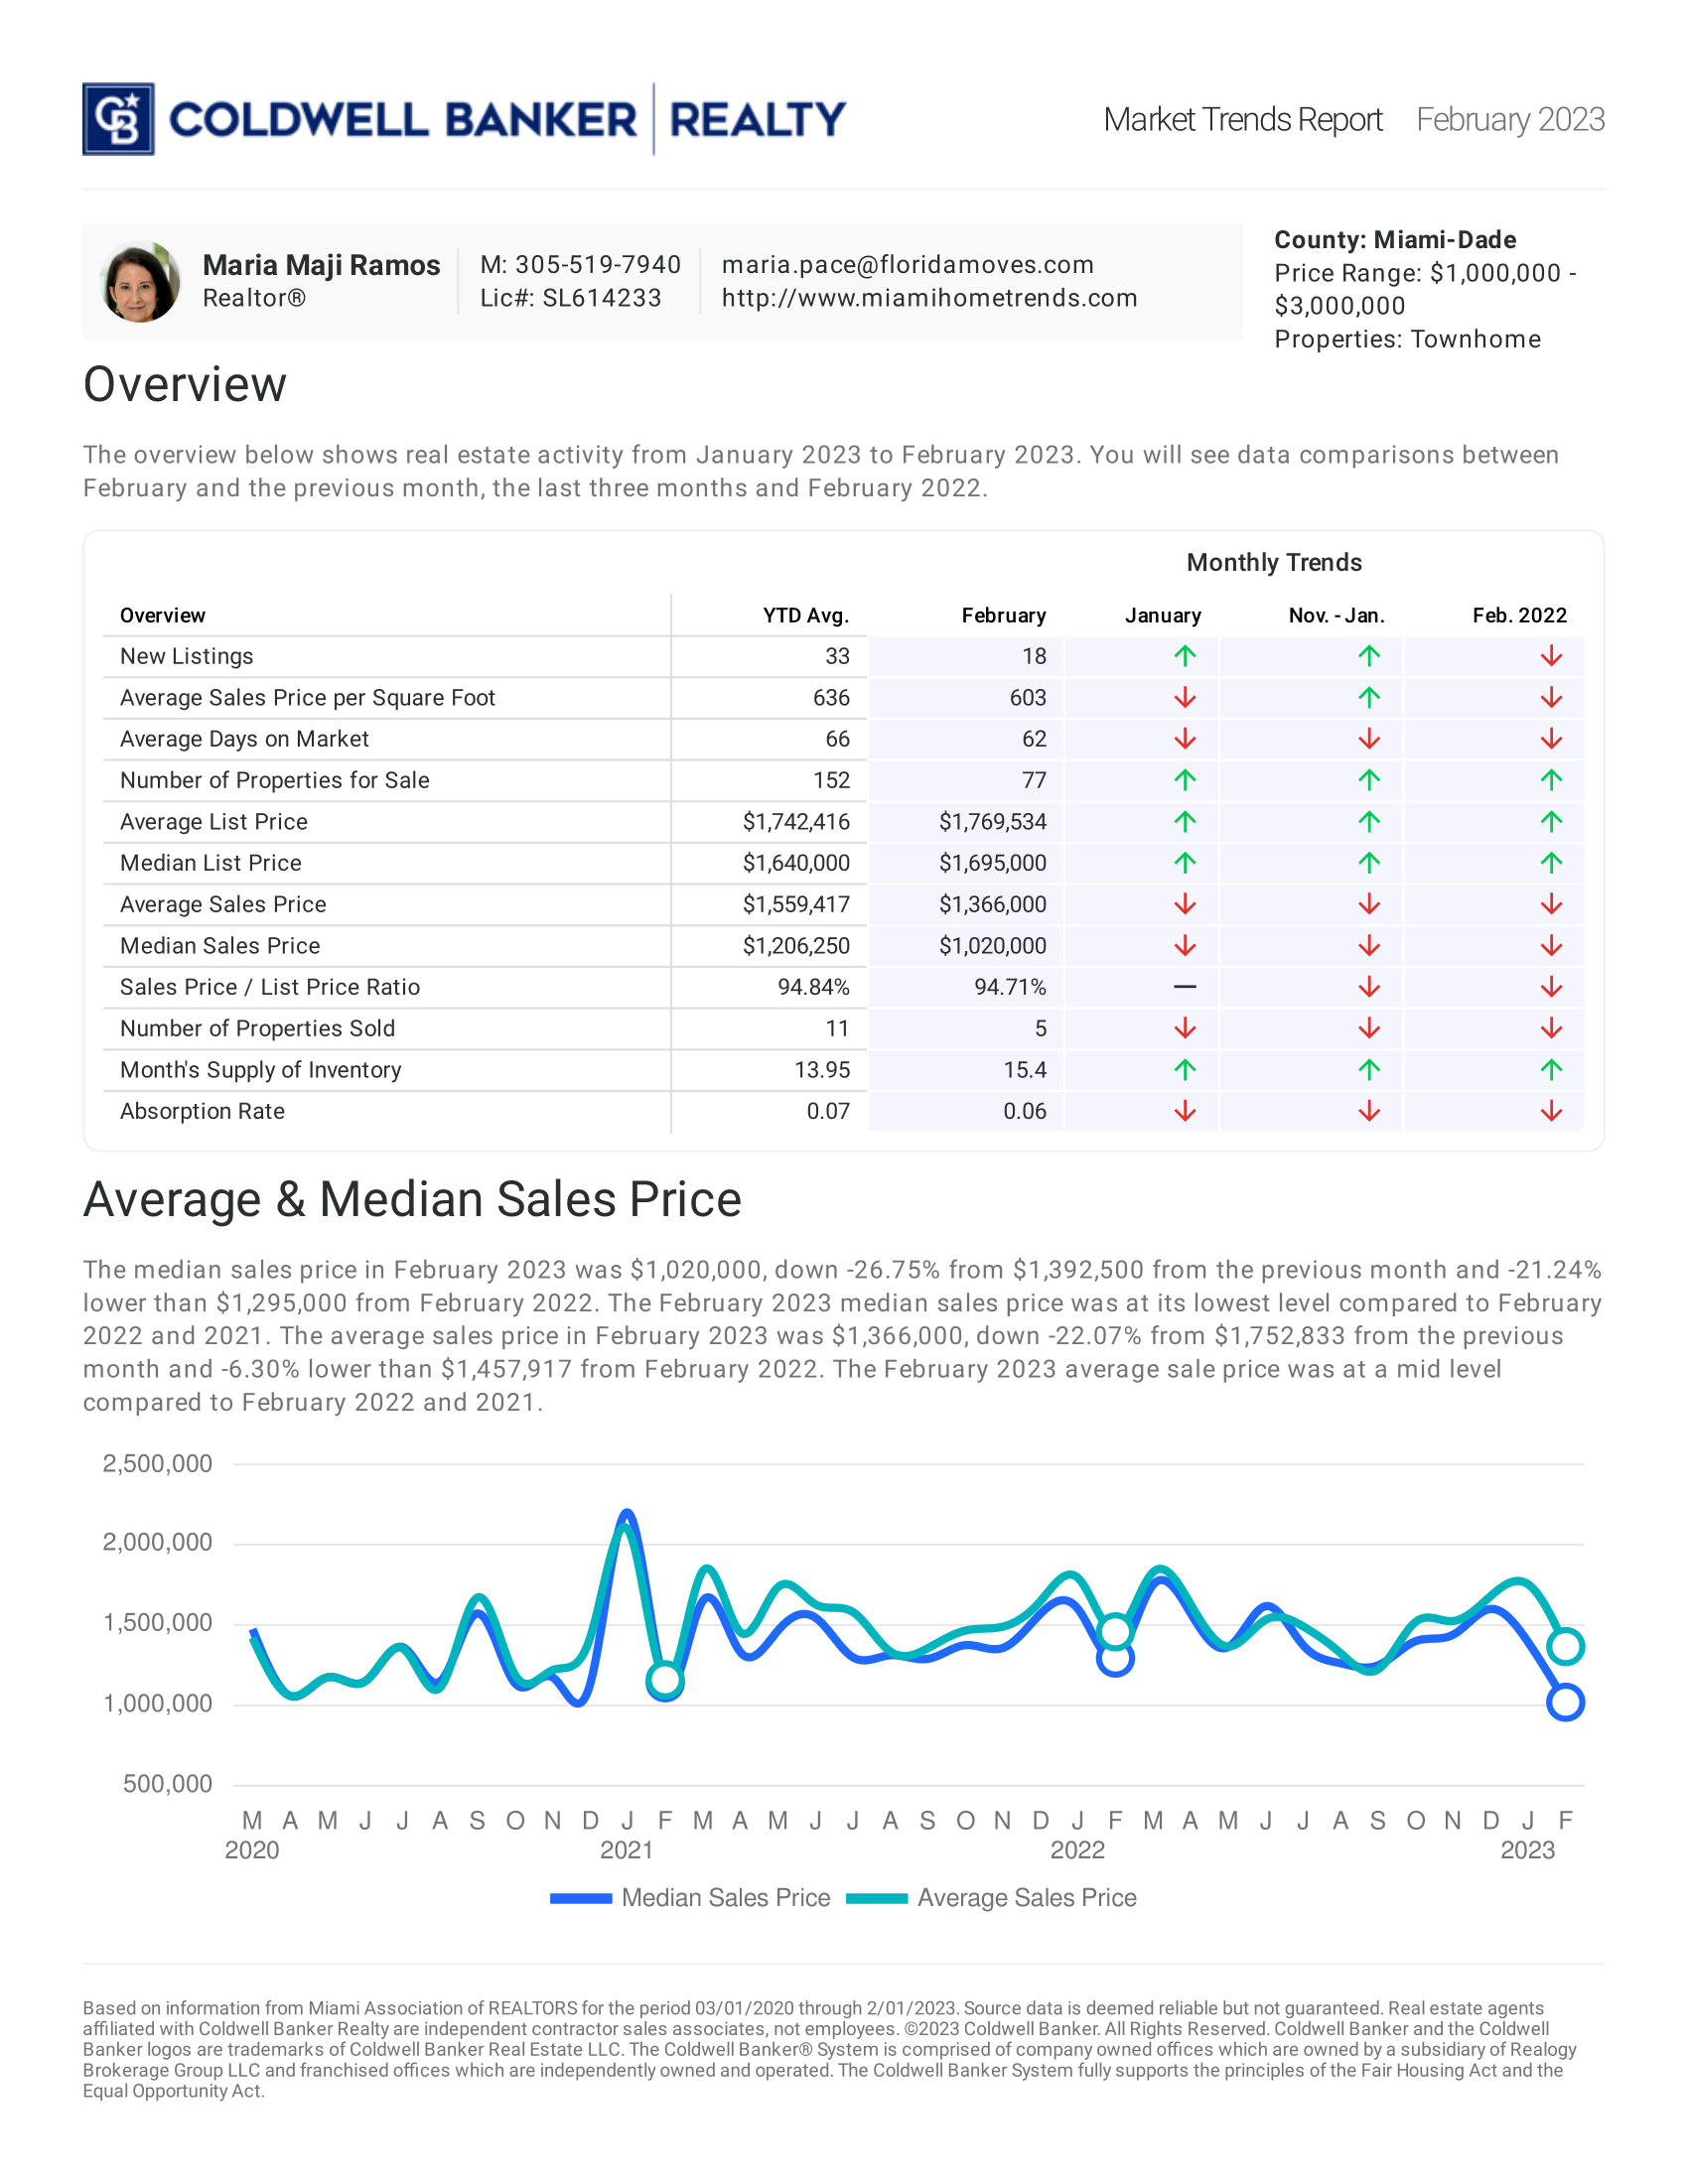
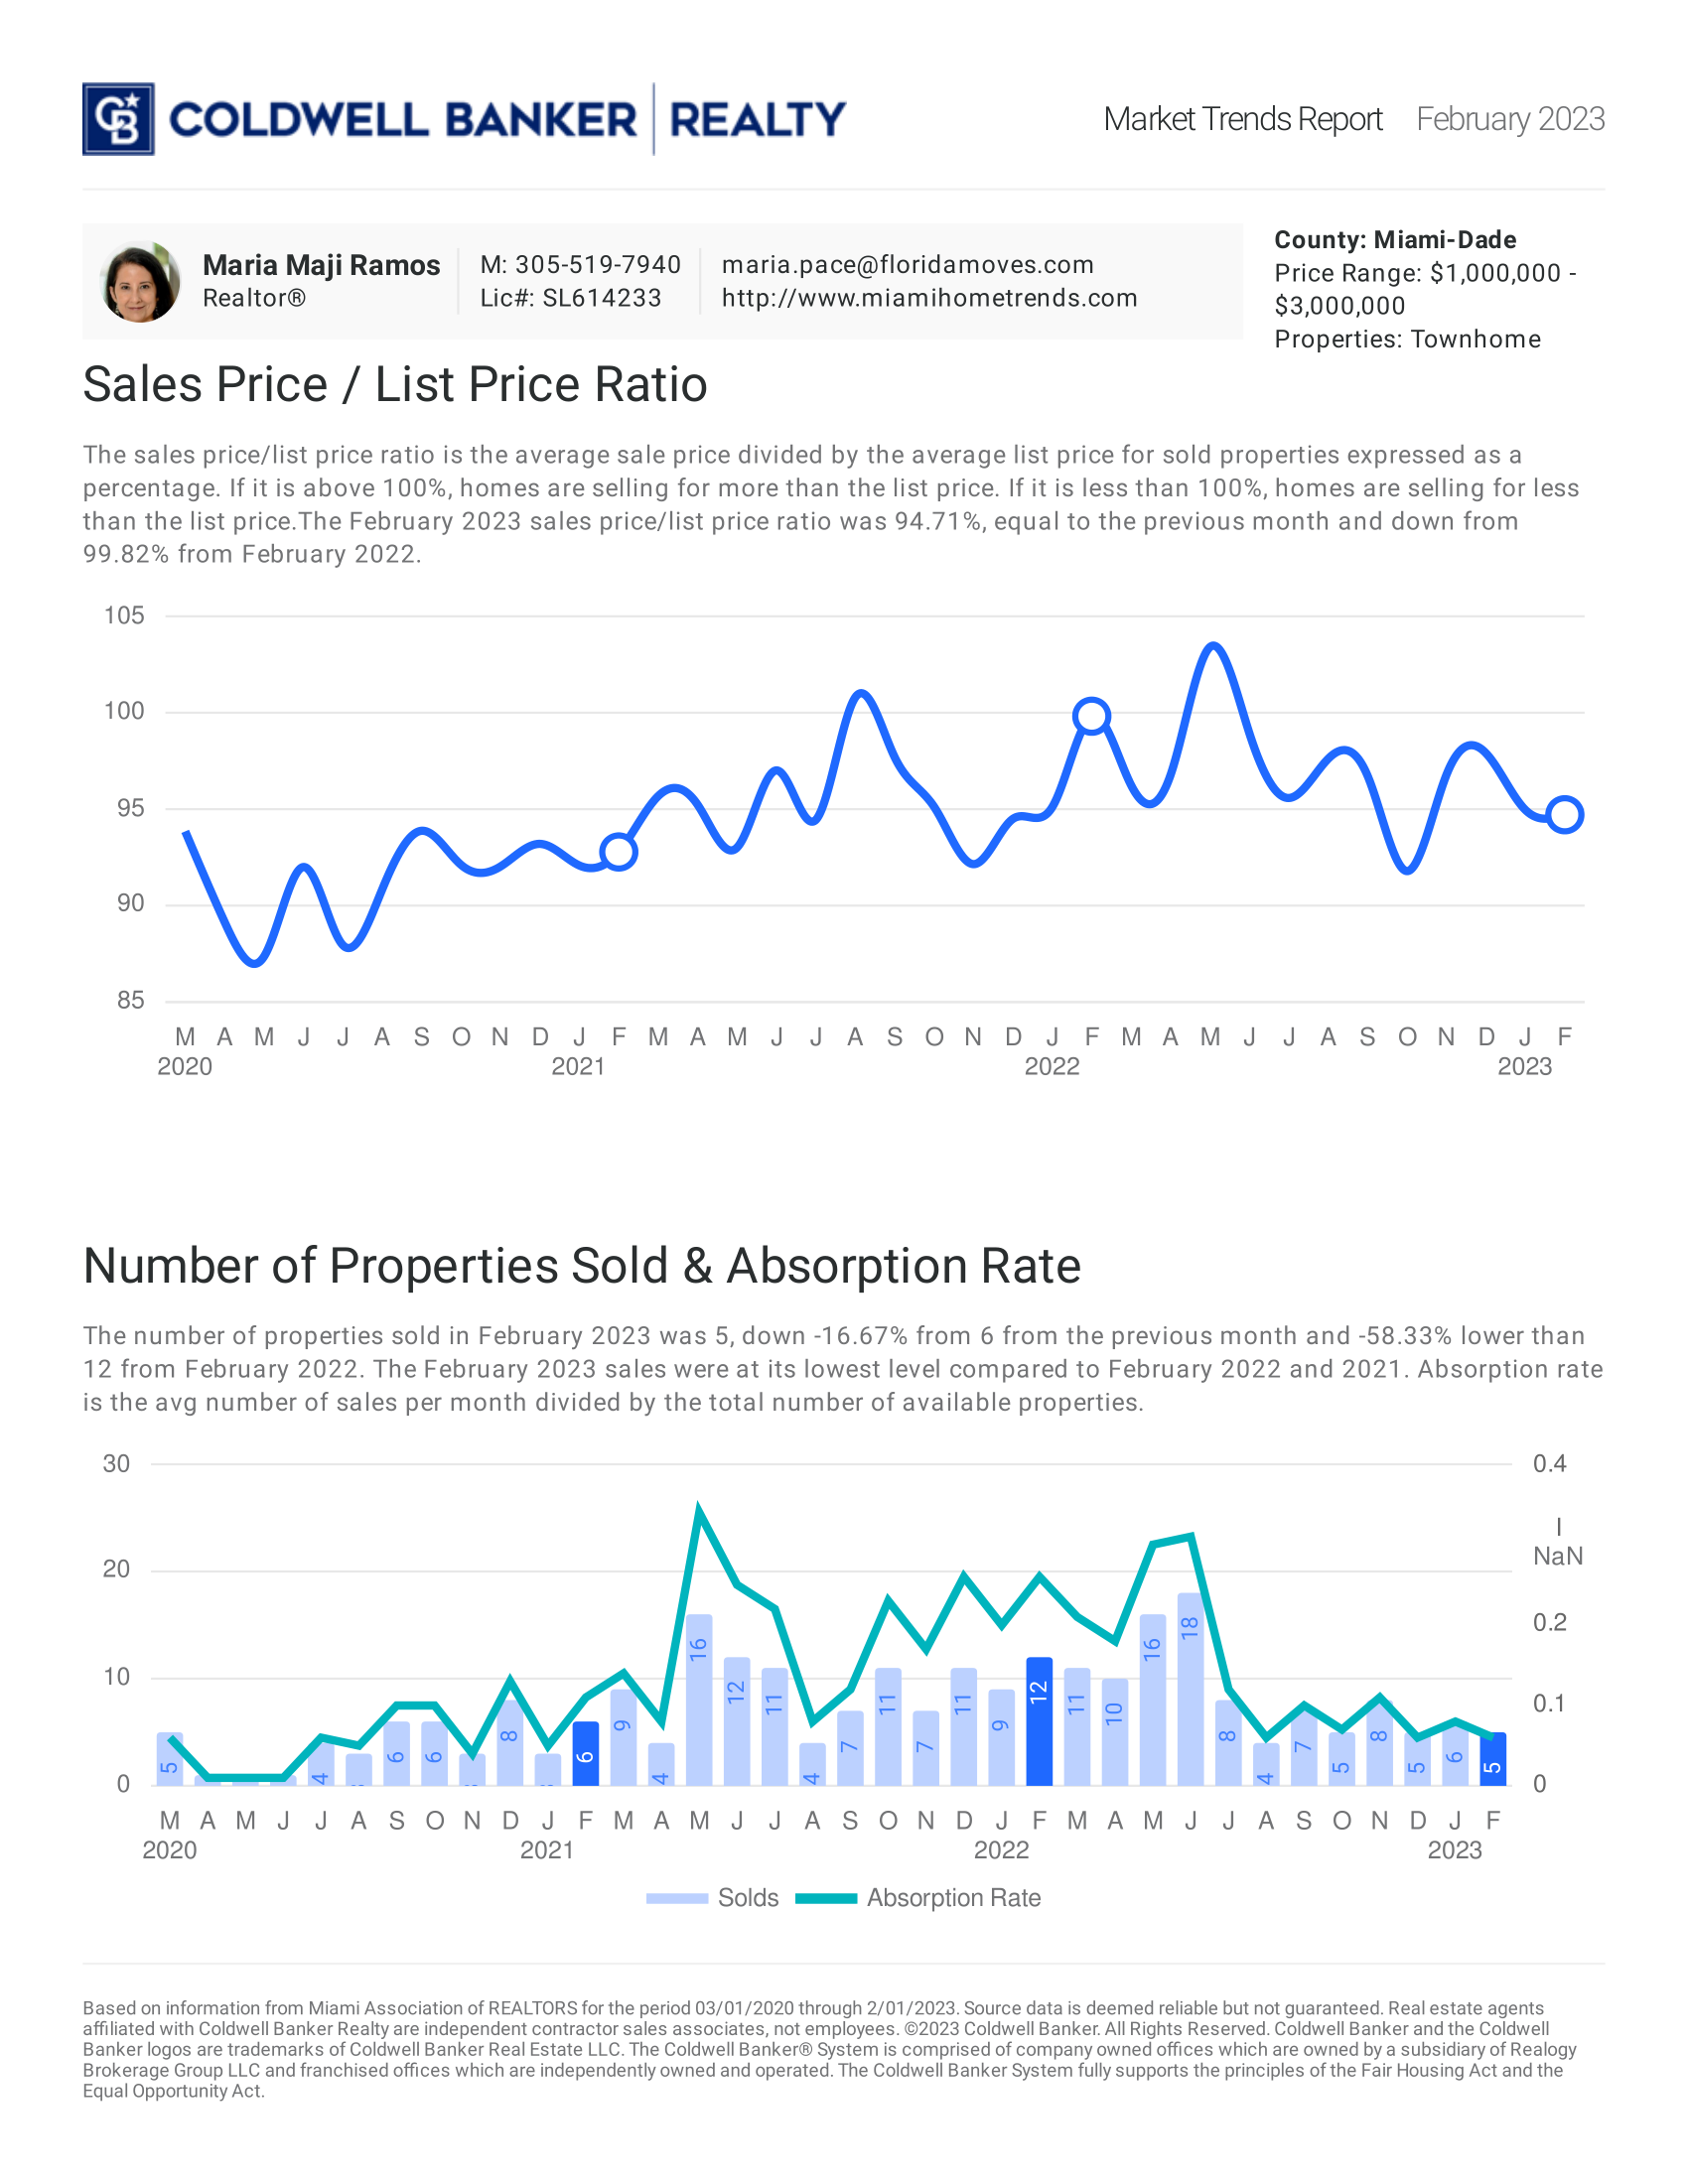
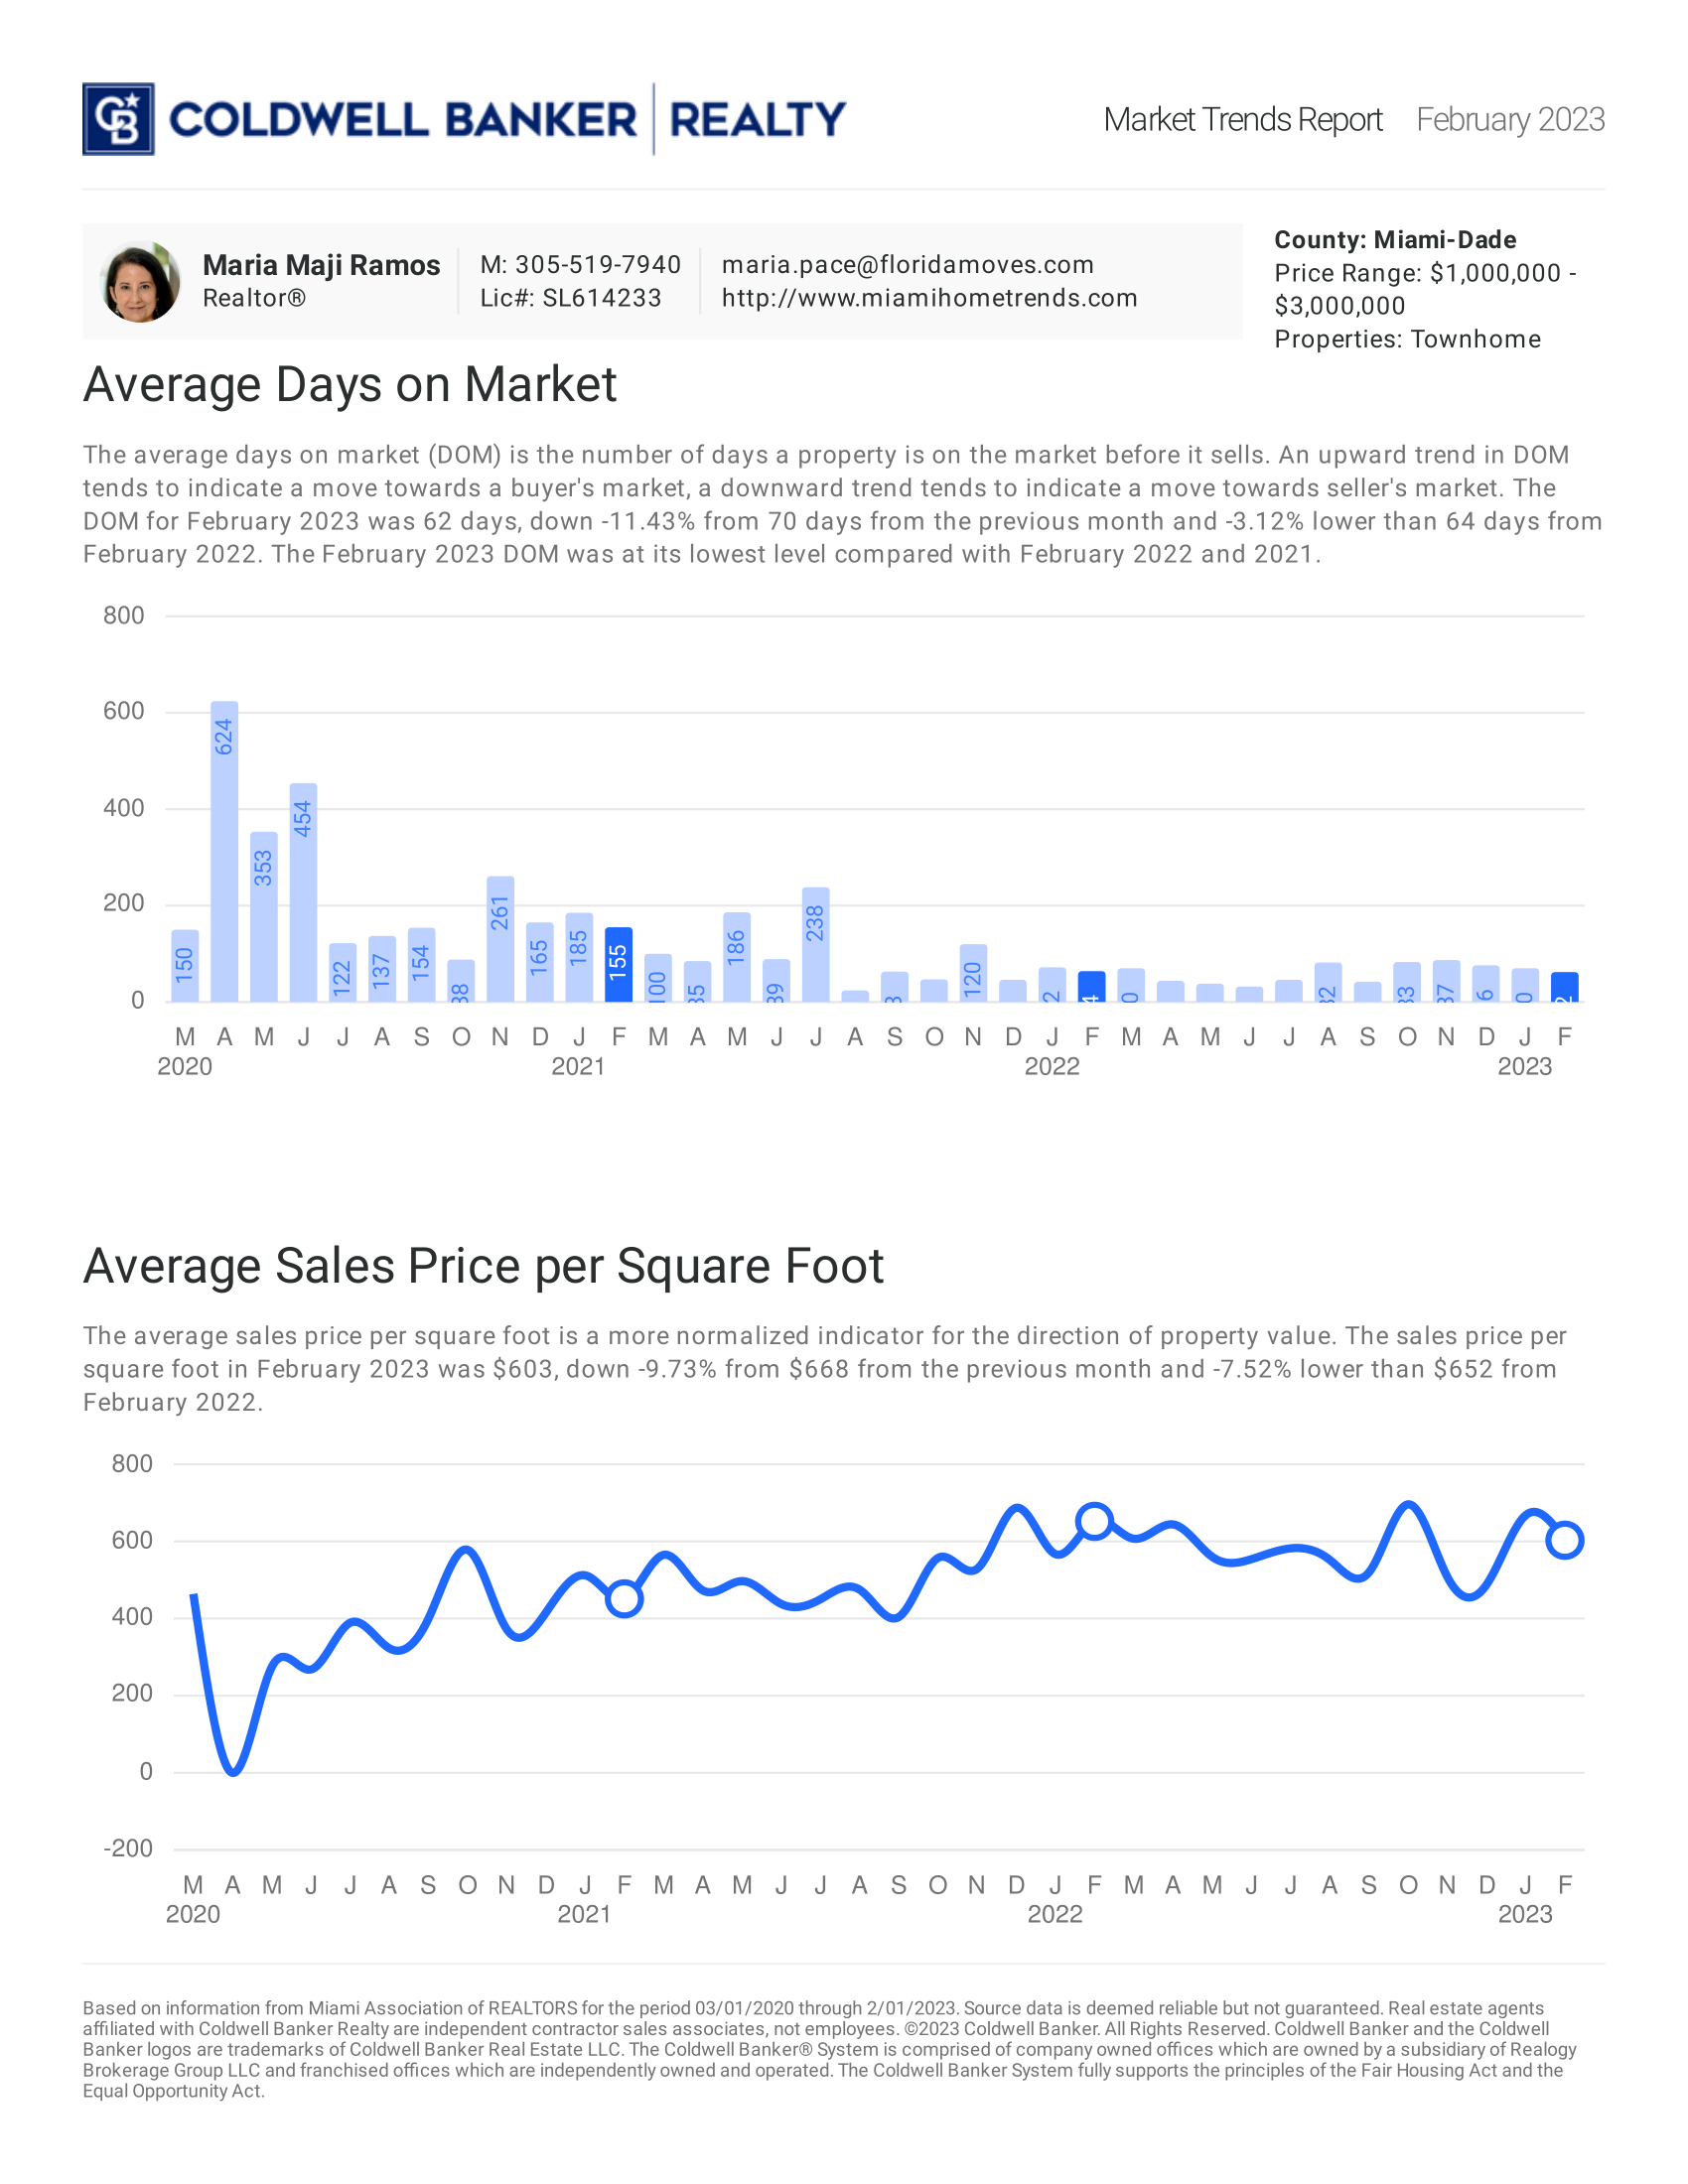
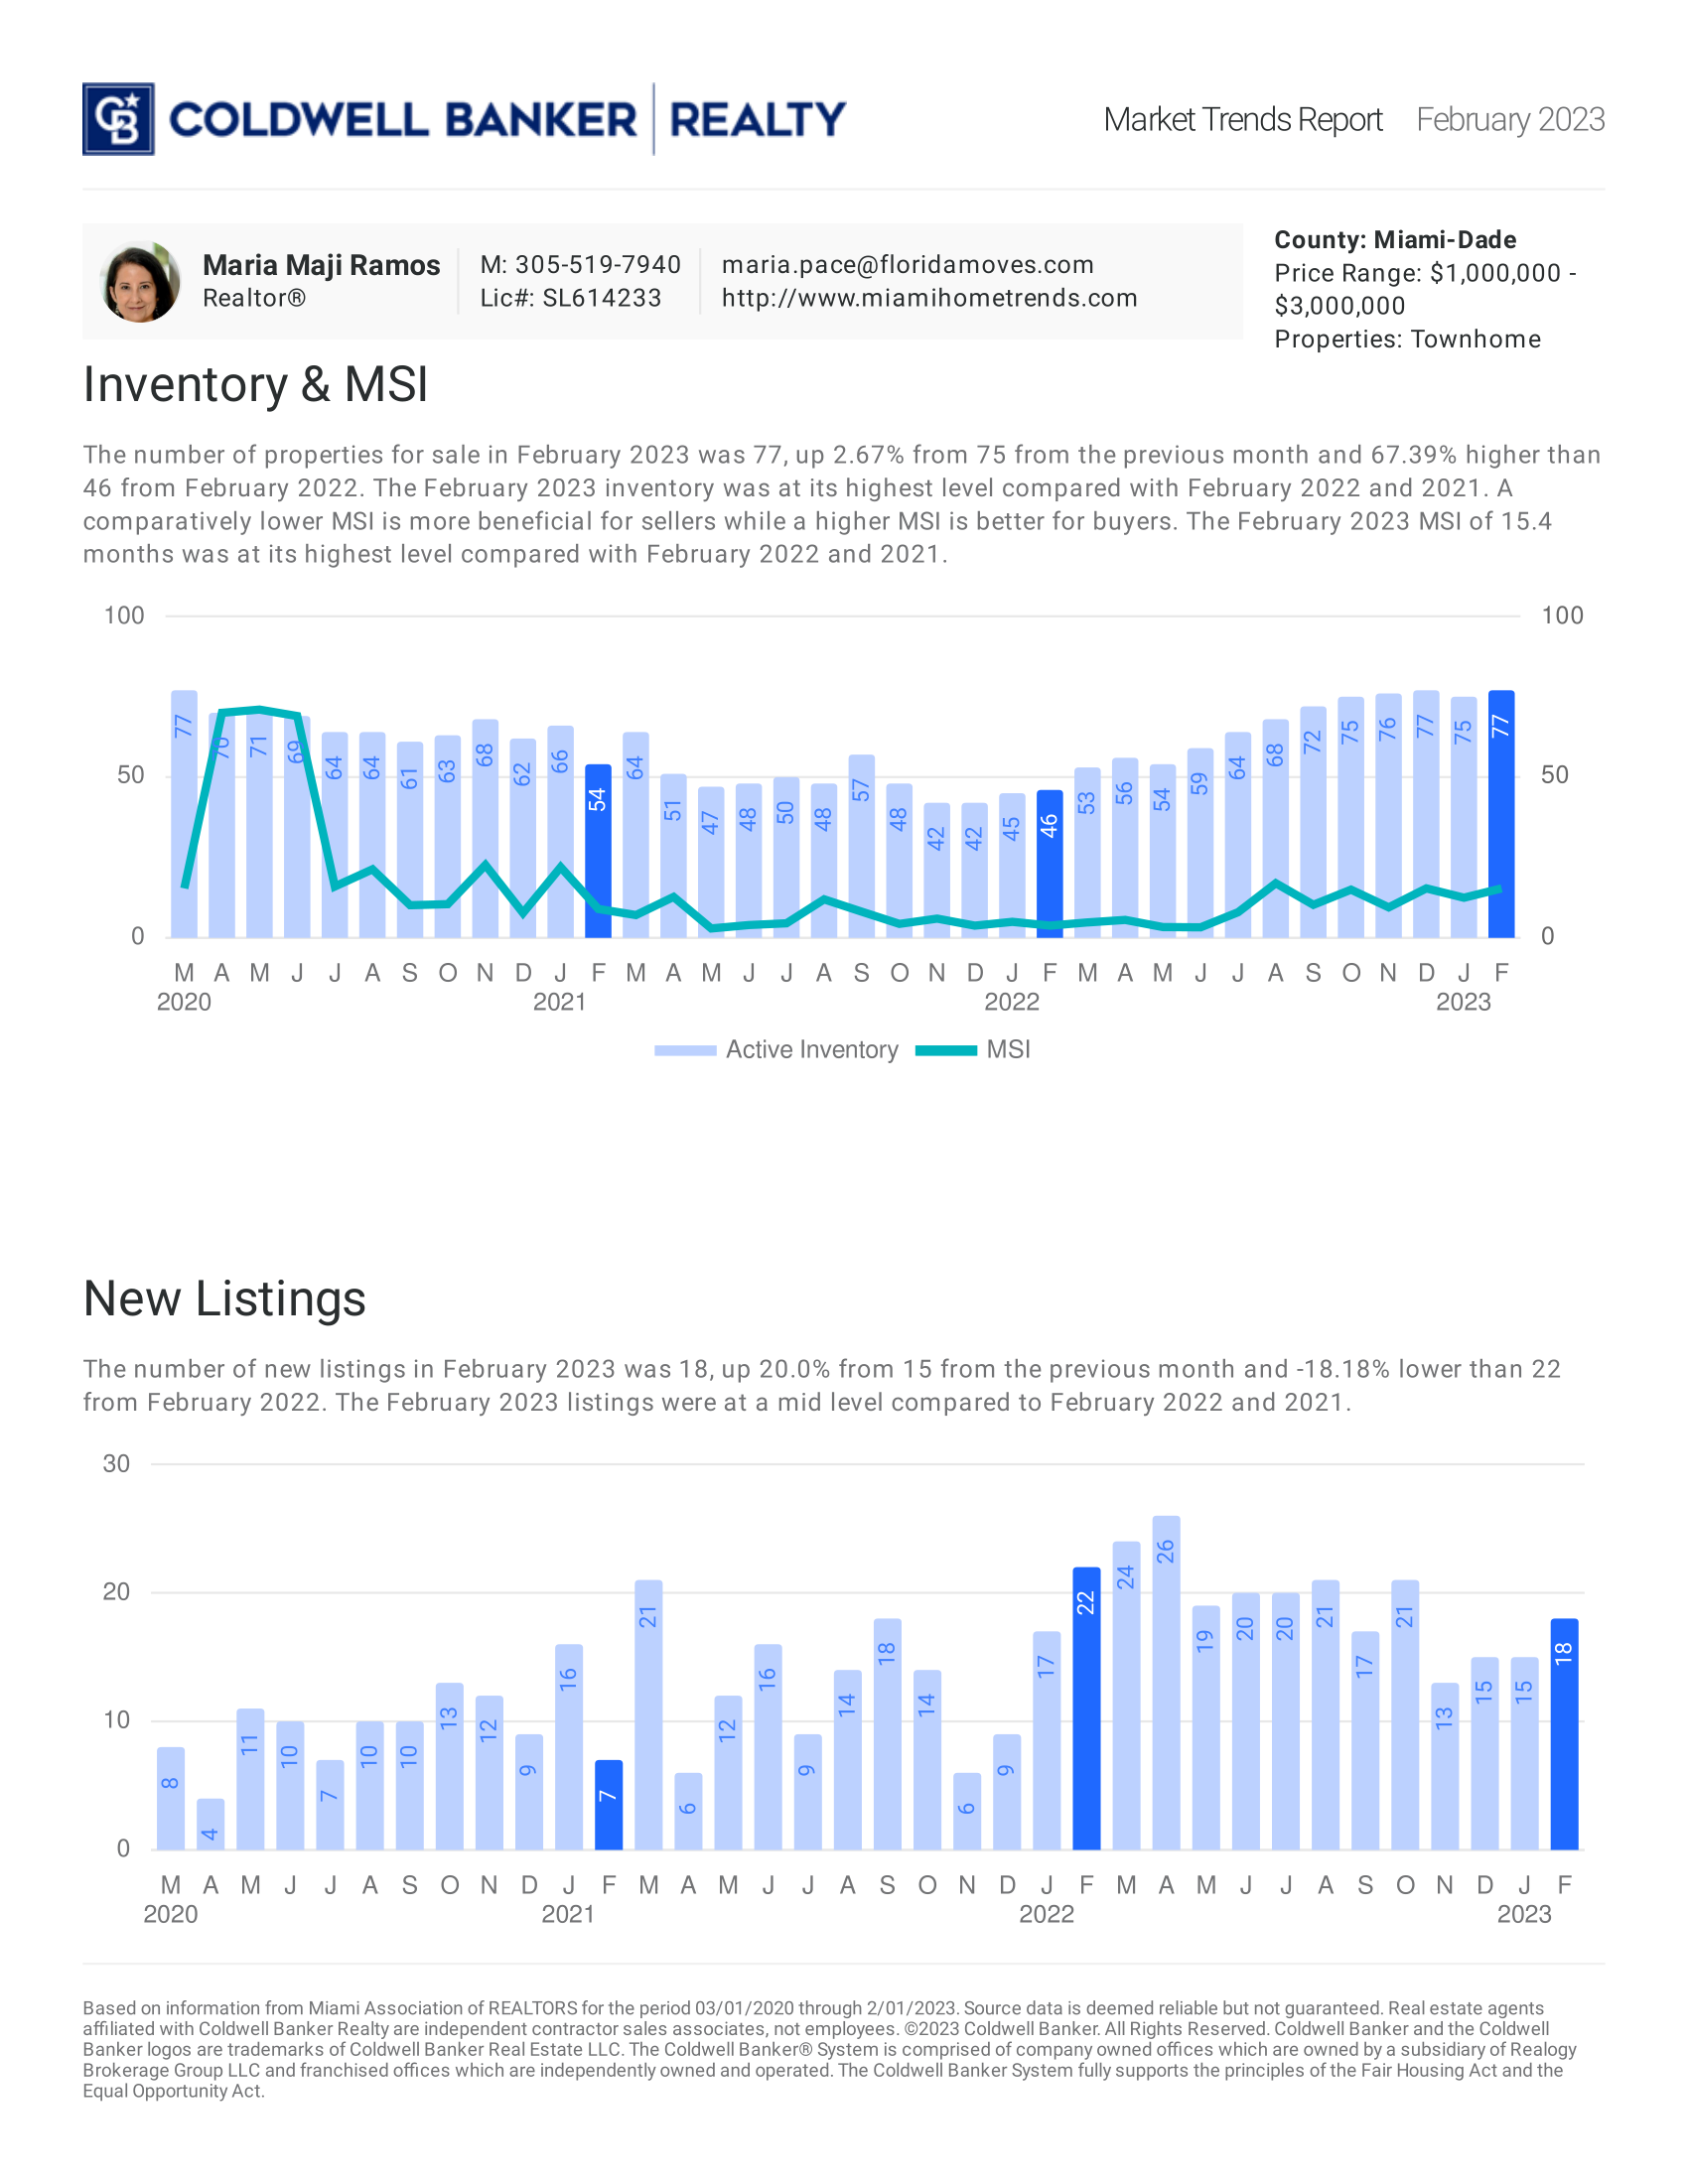
February 2023: Townhome

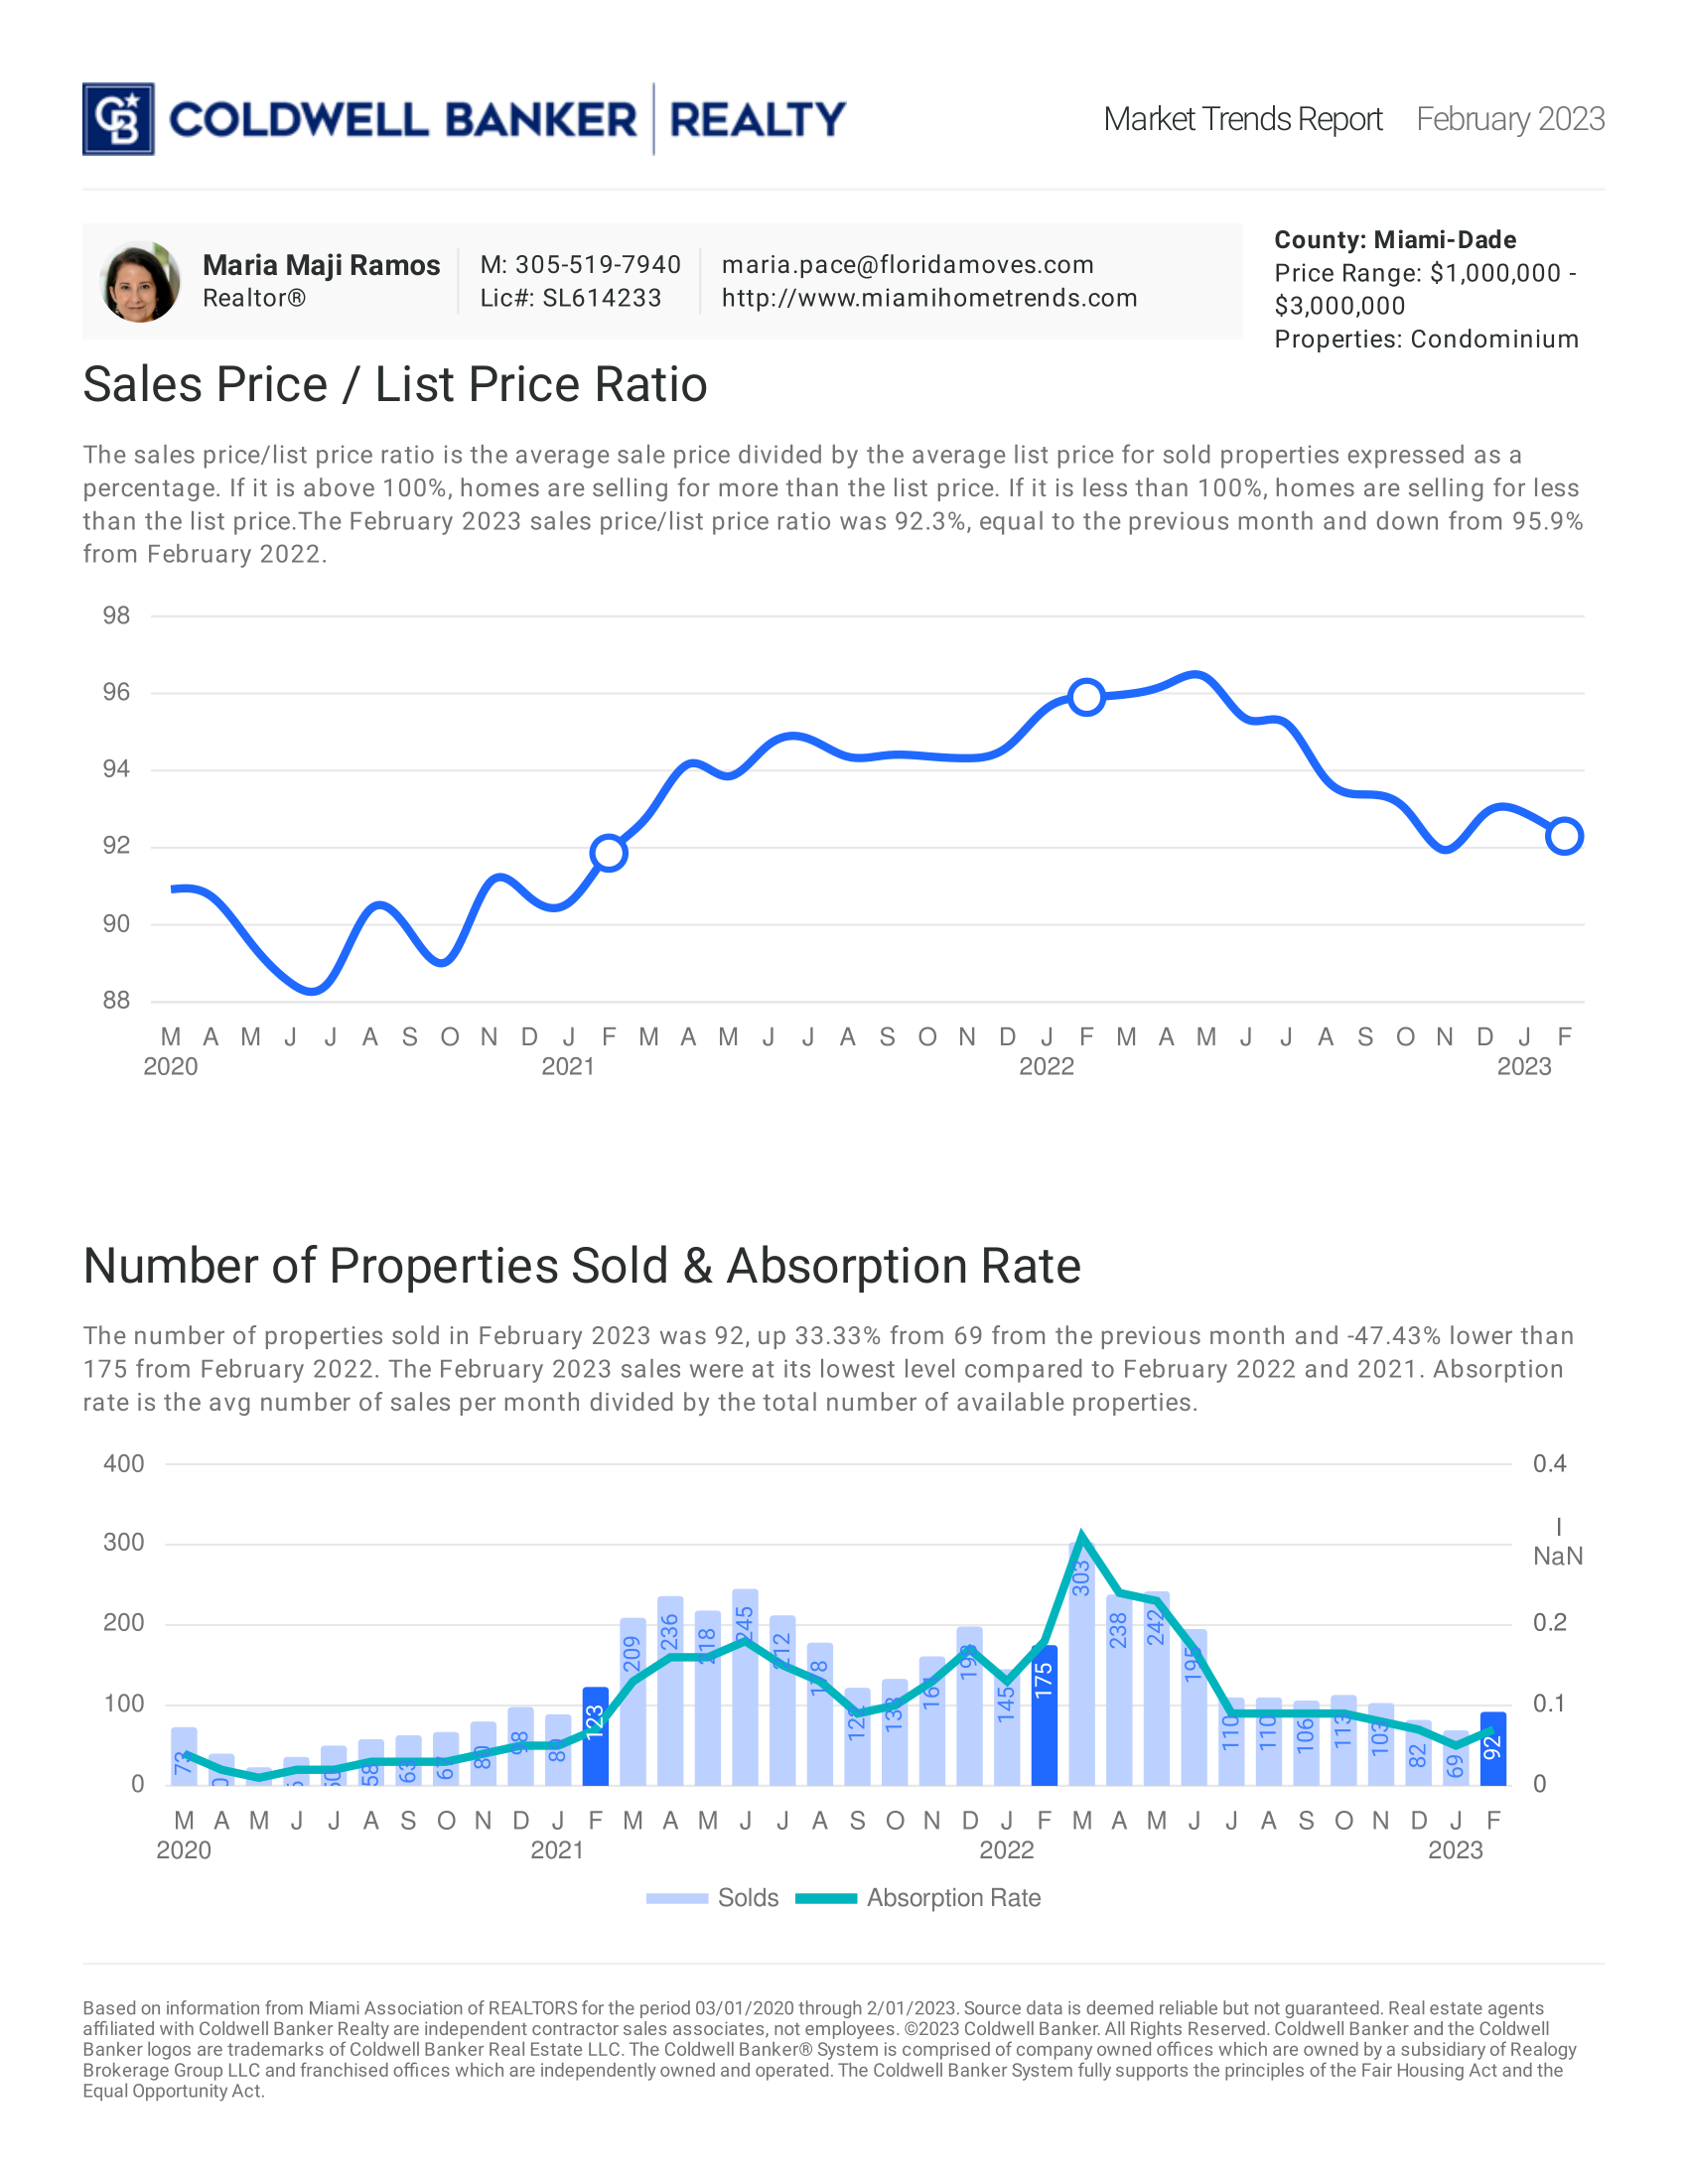
February 2023: Condo


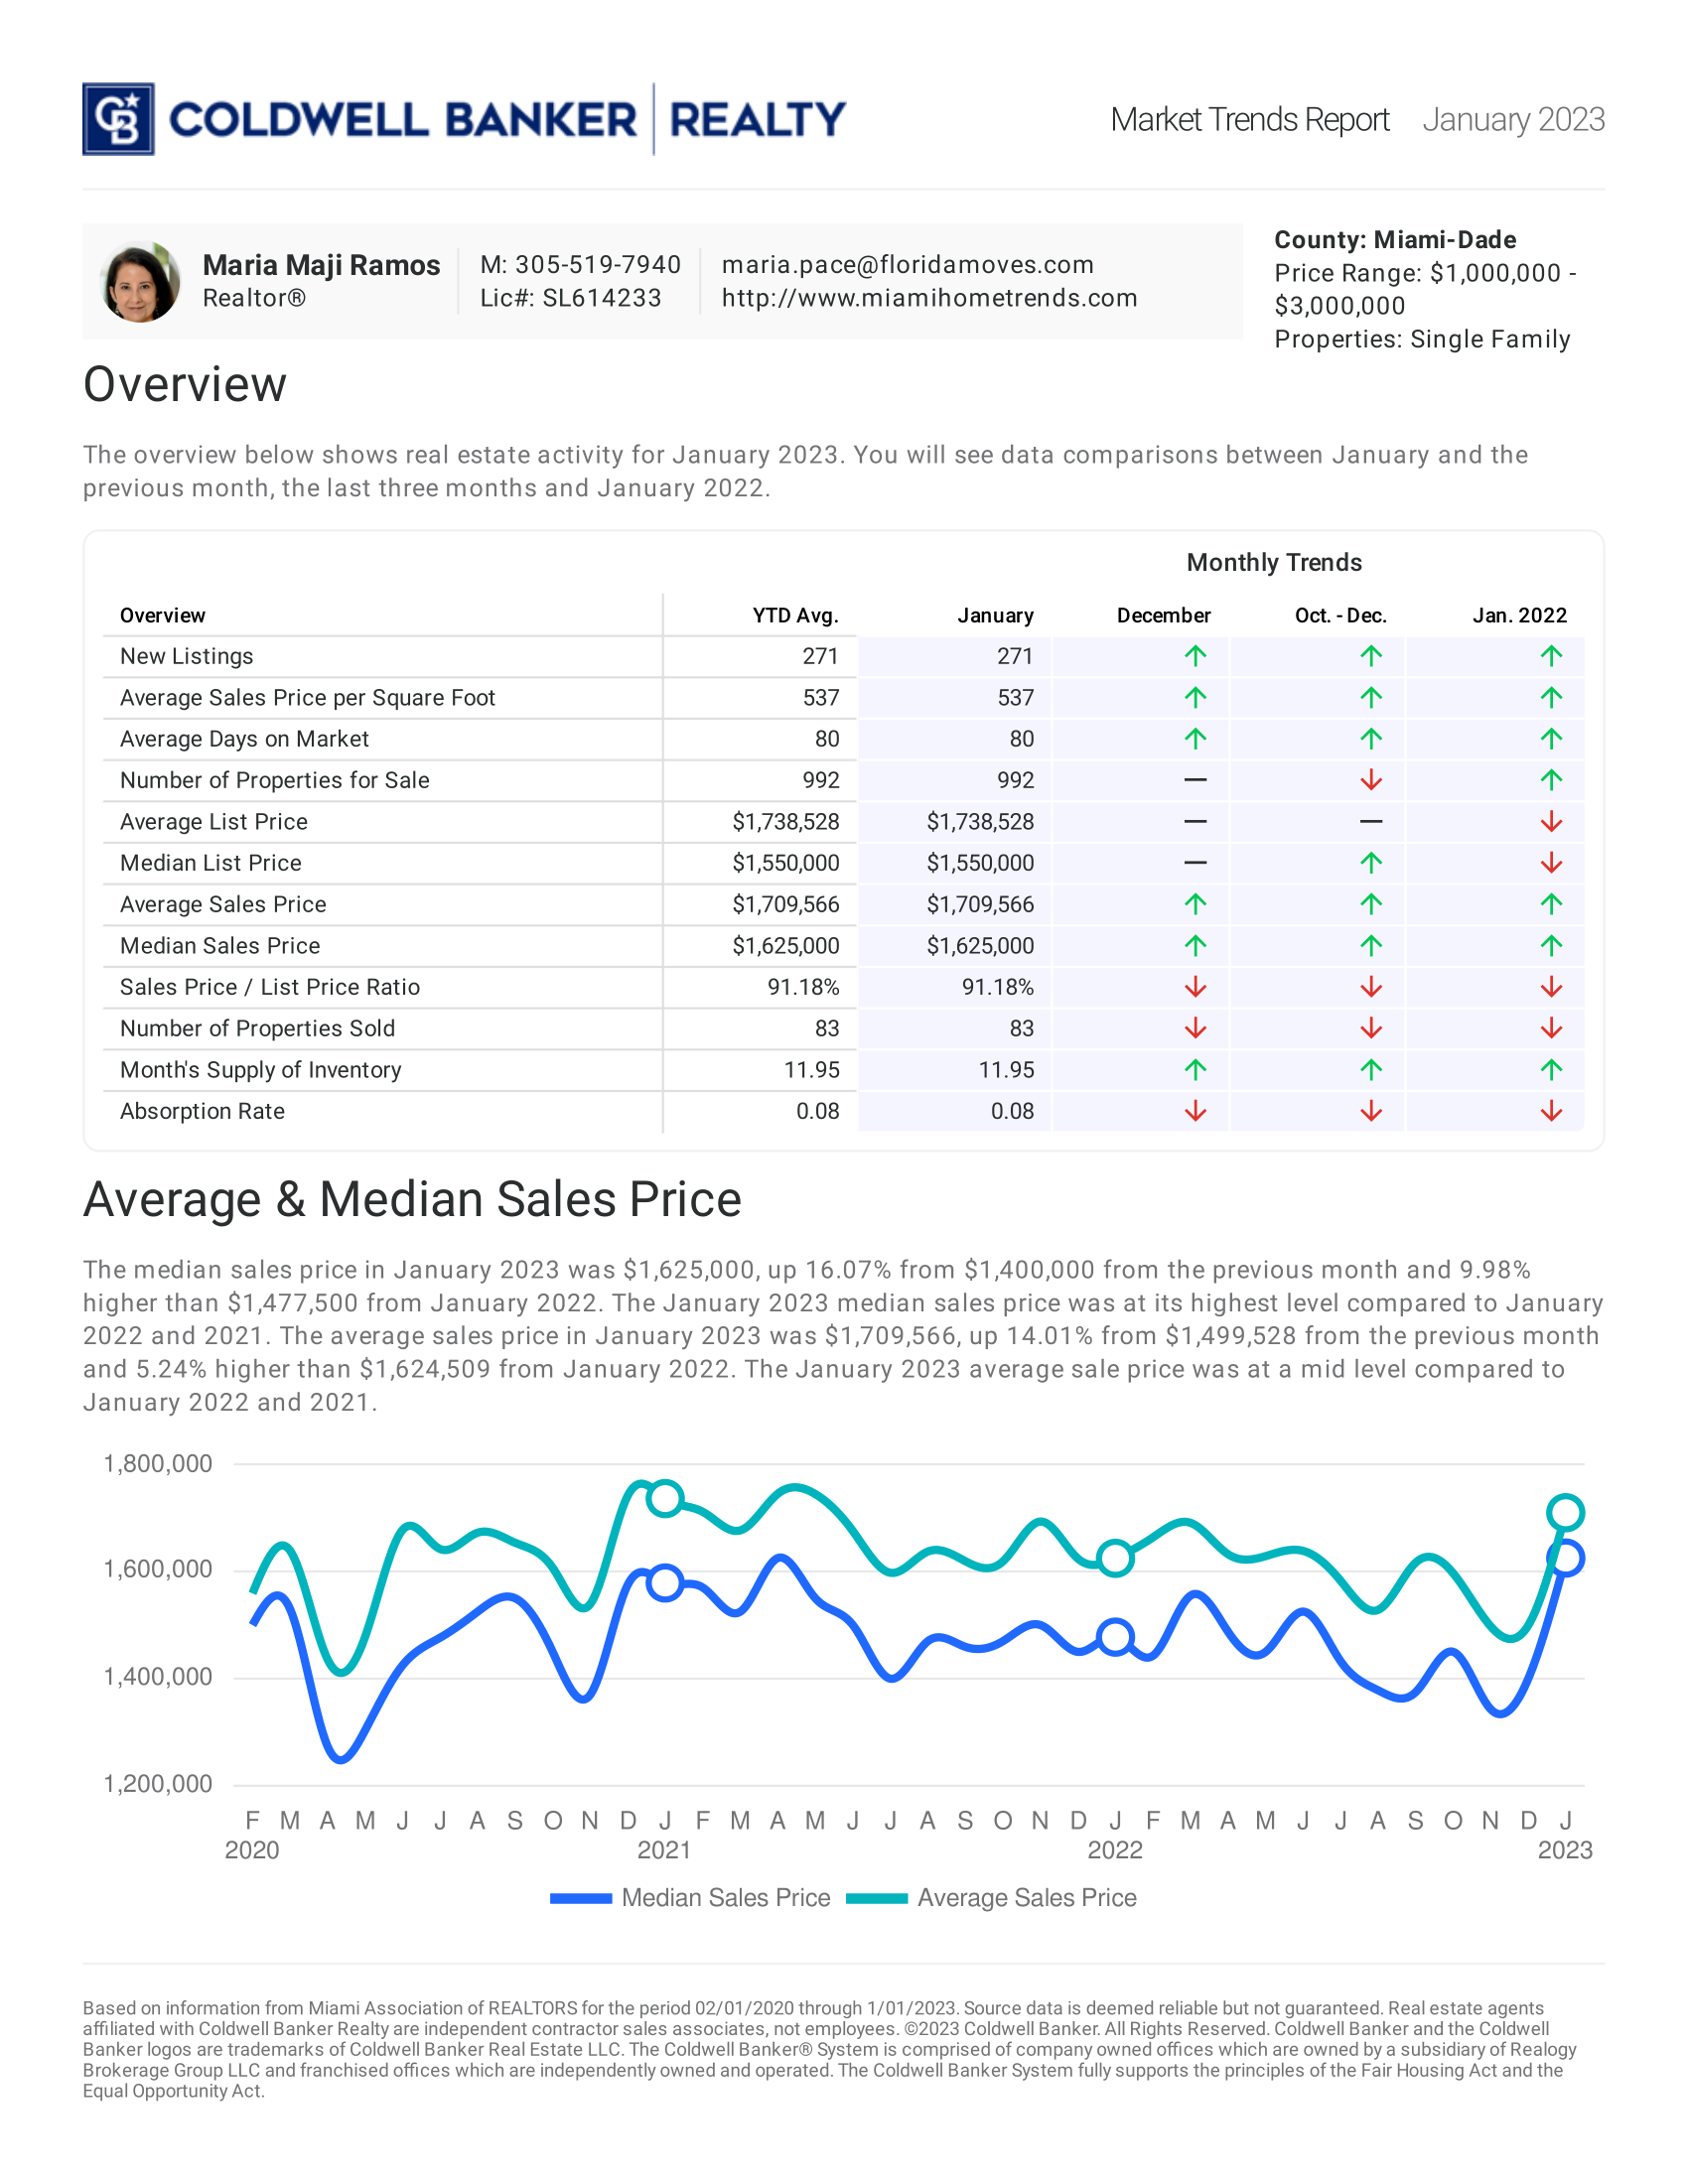
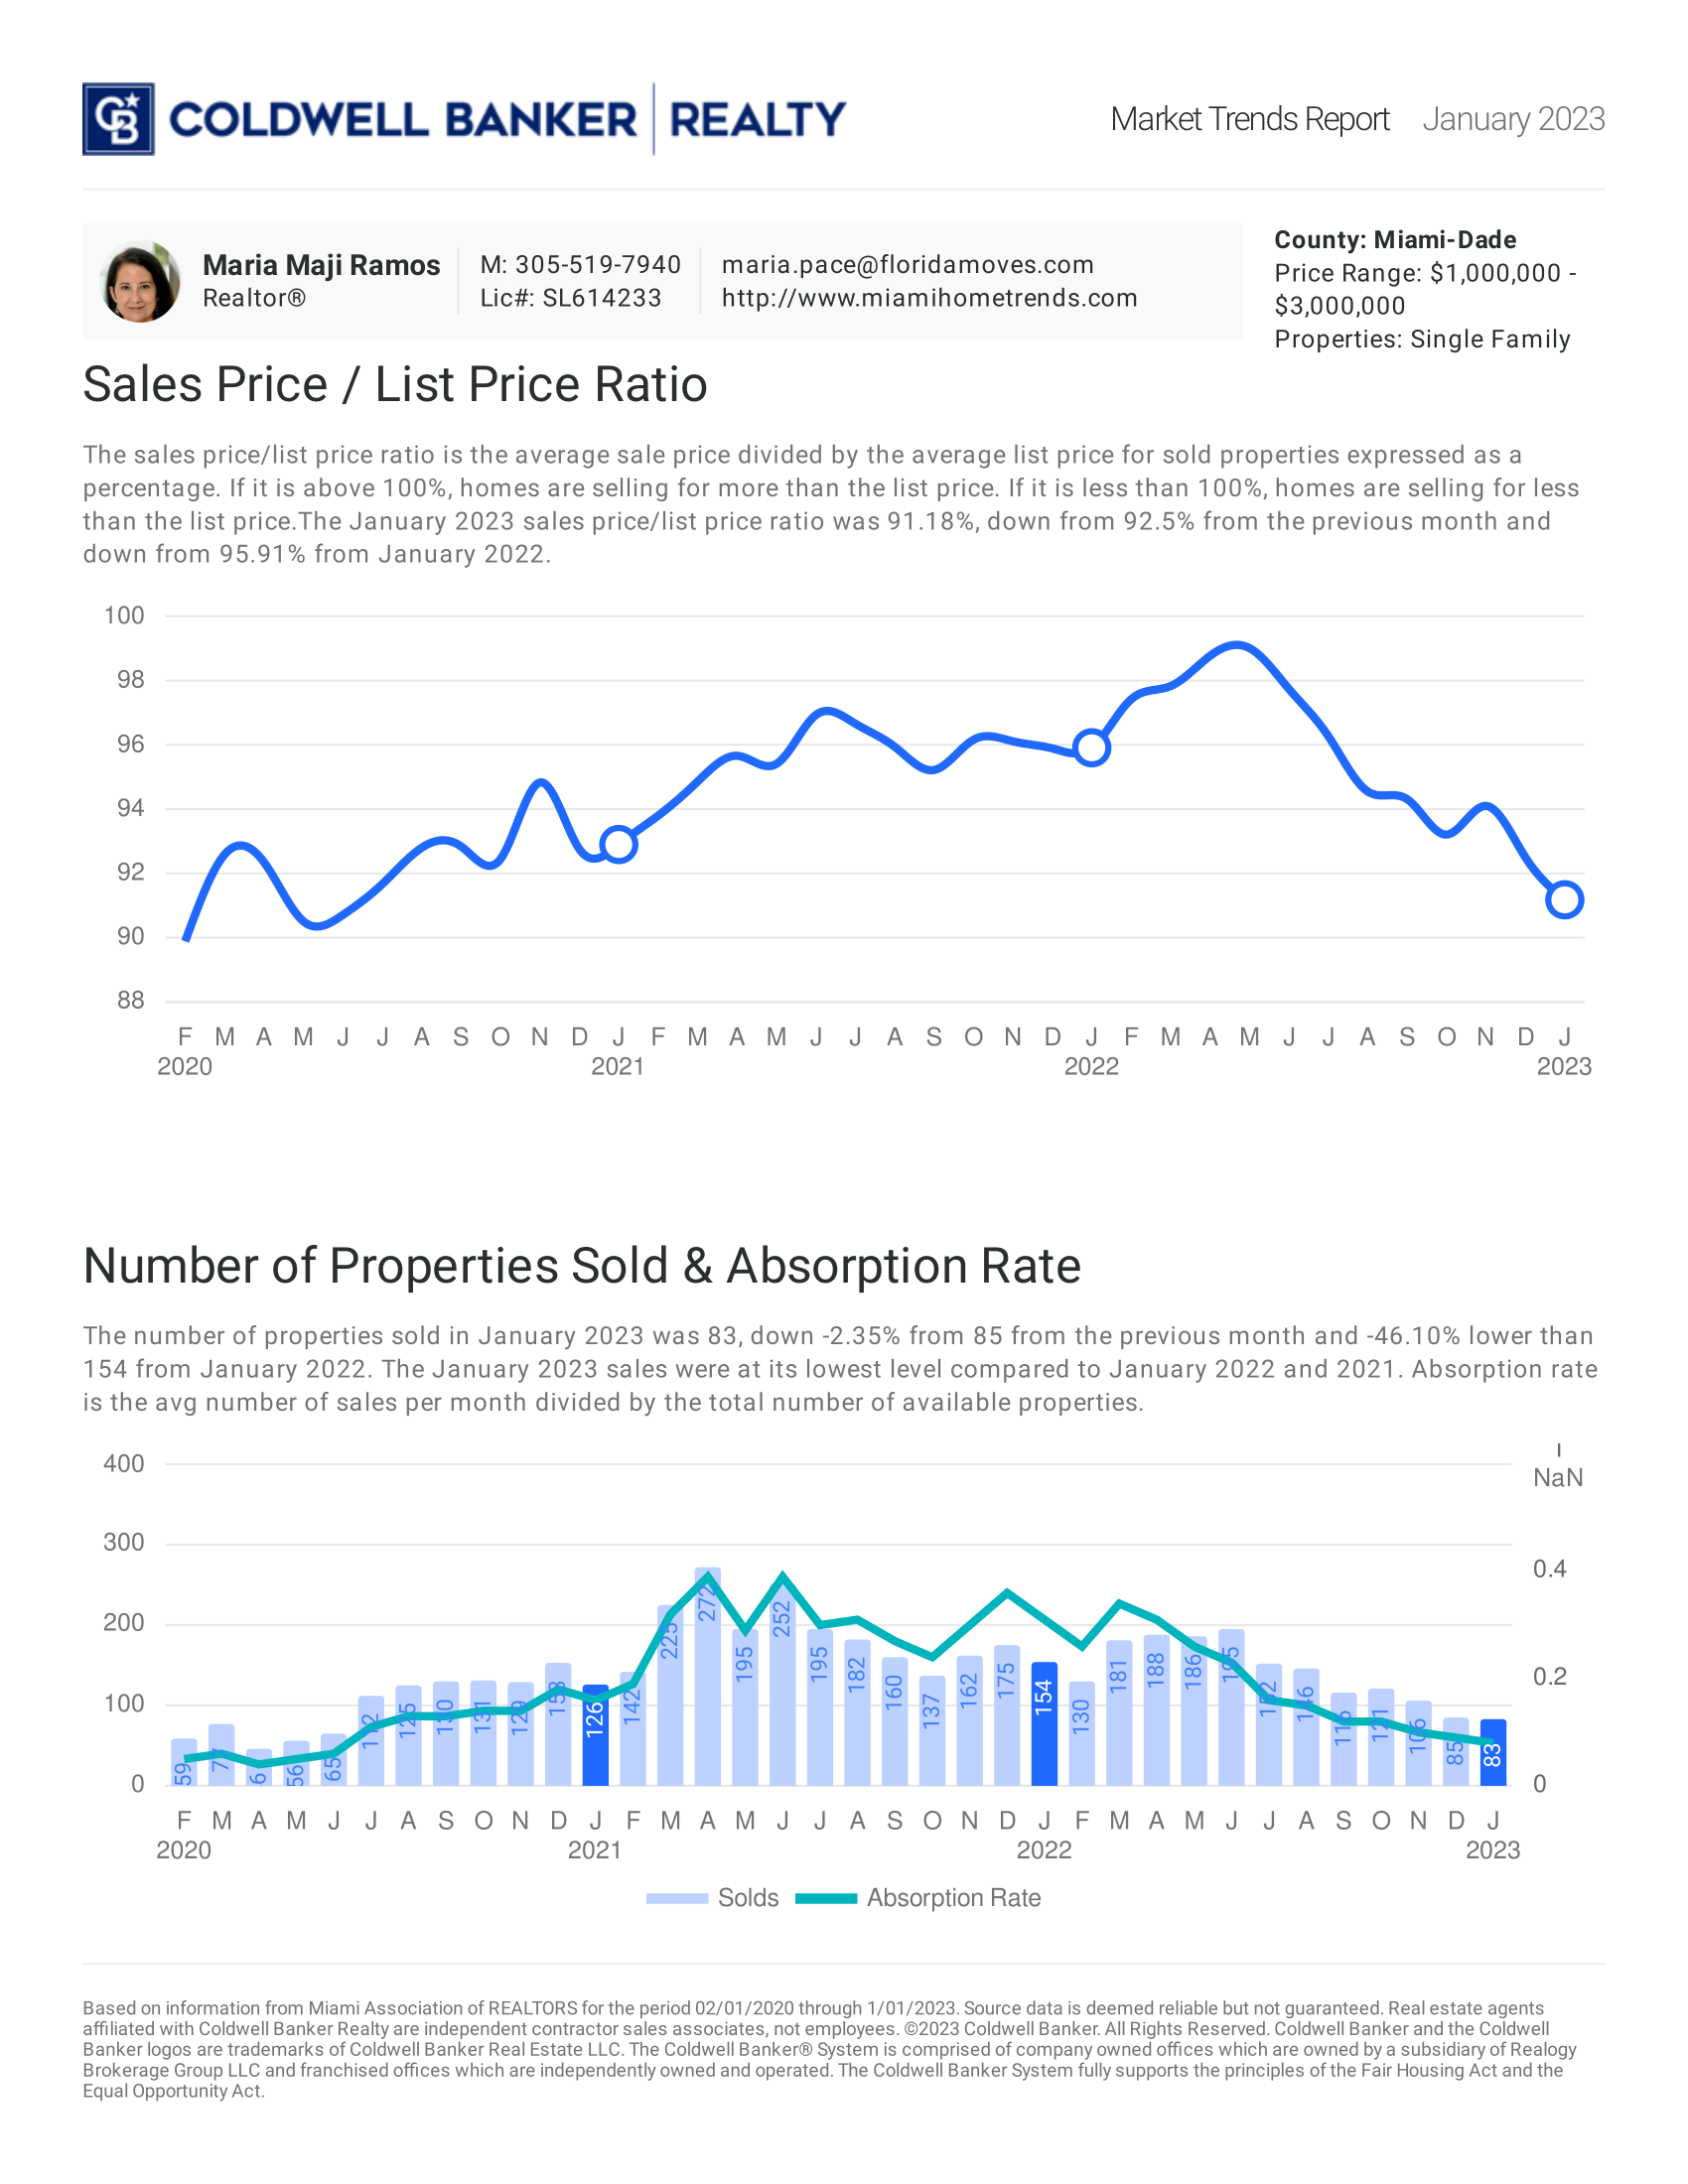
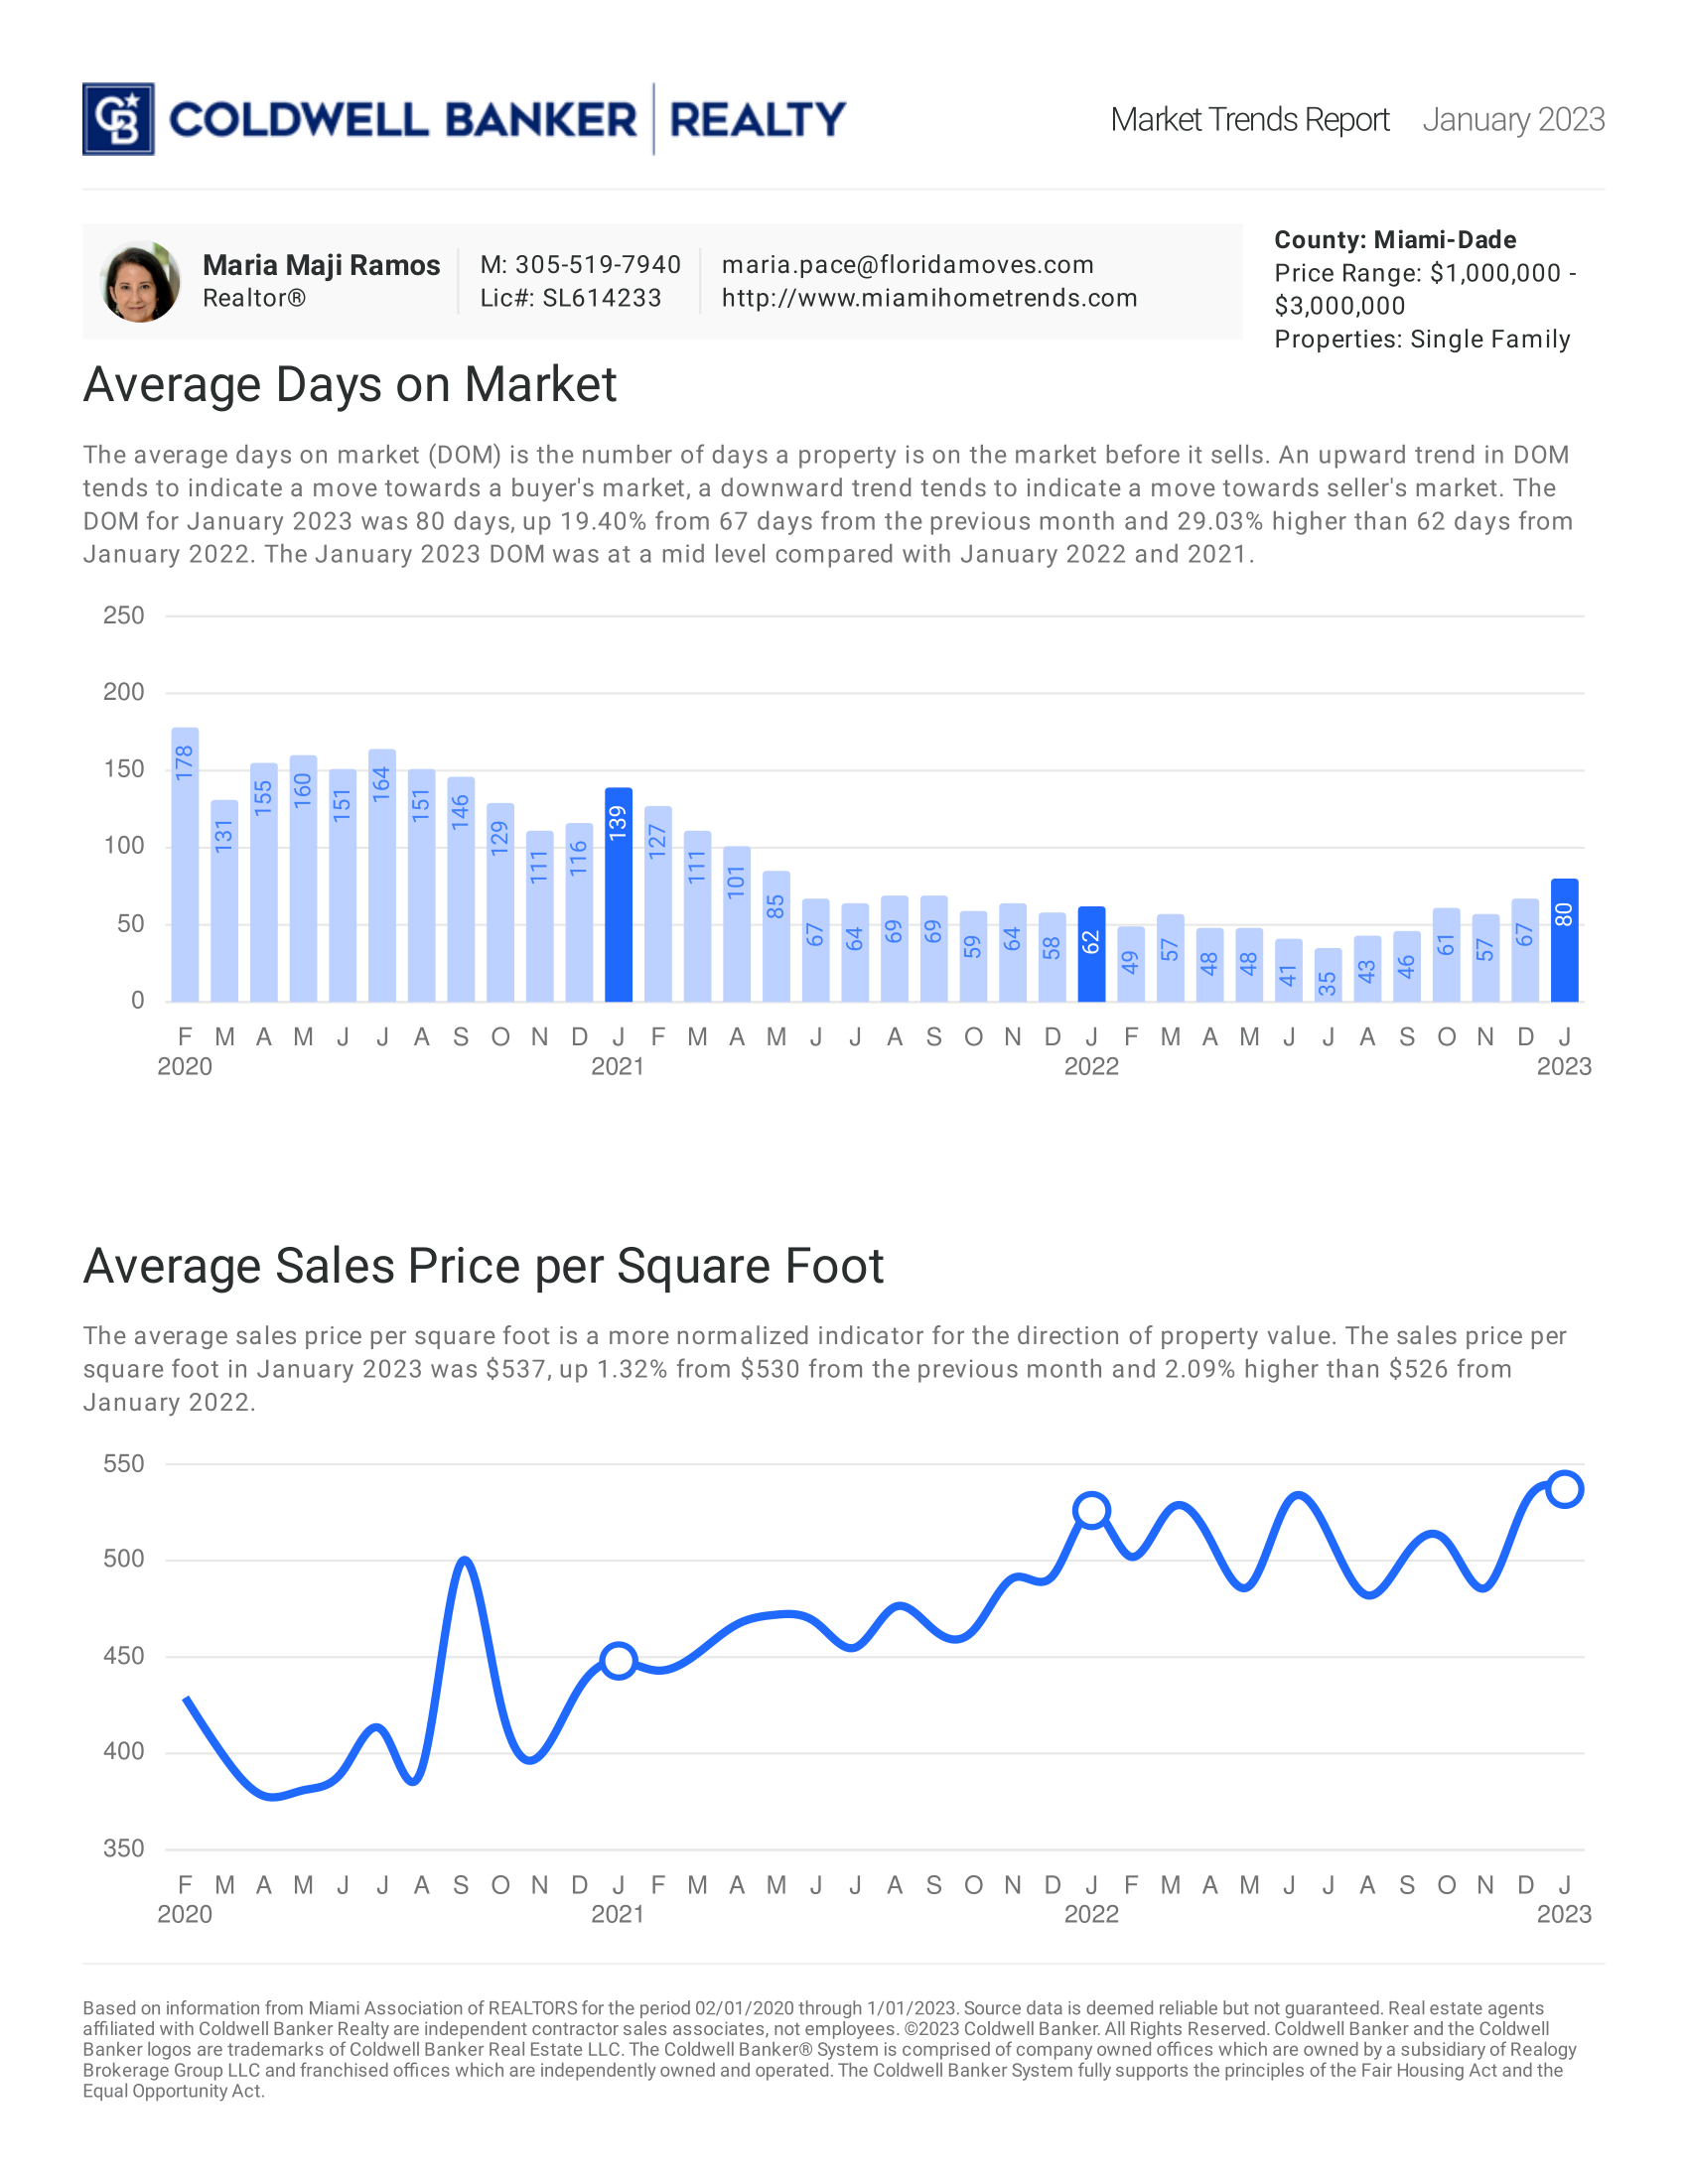
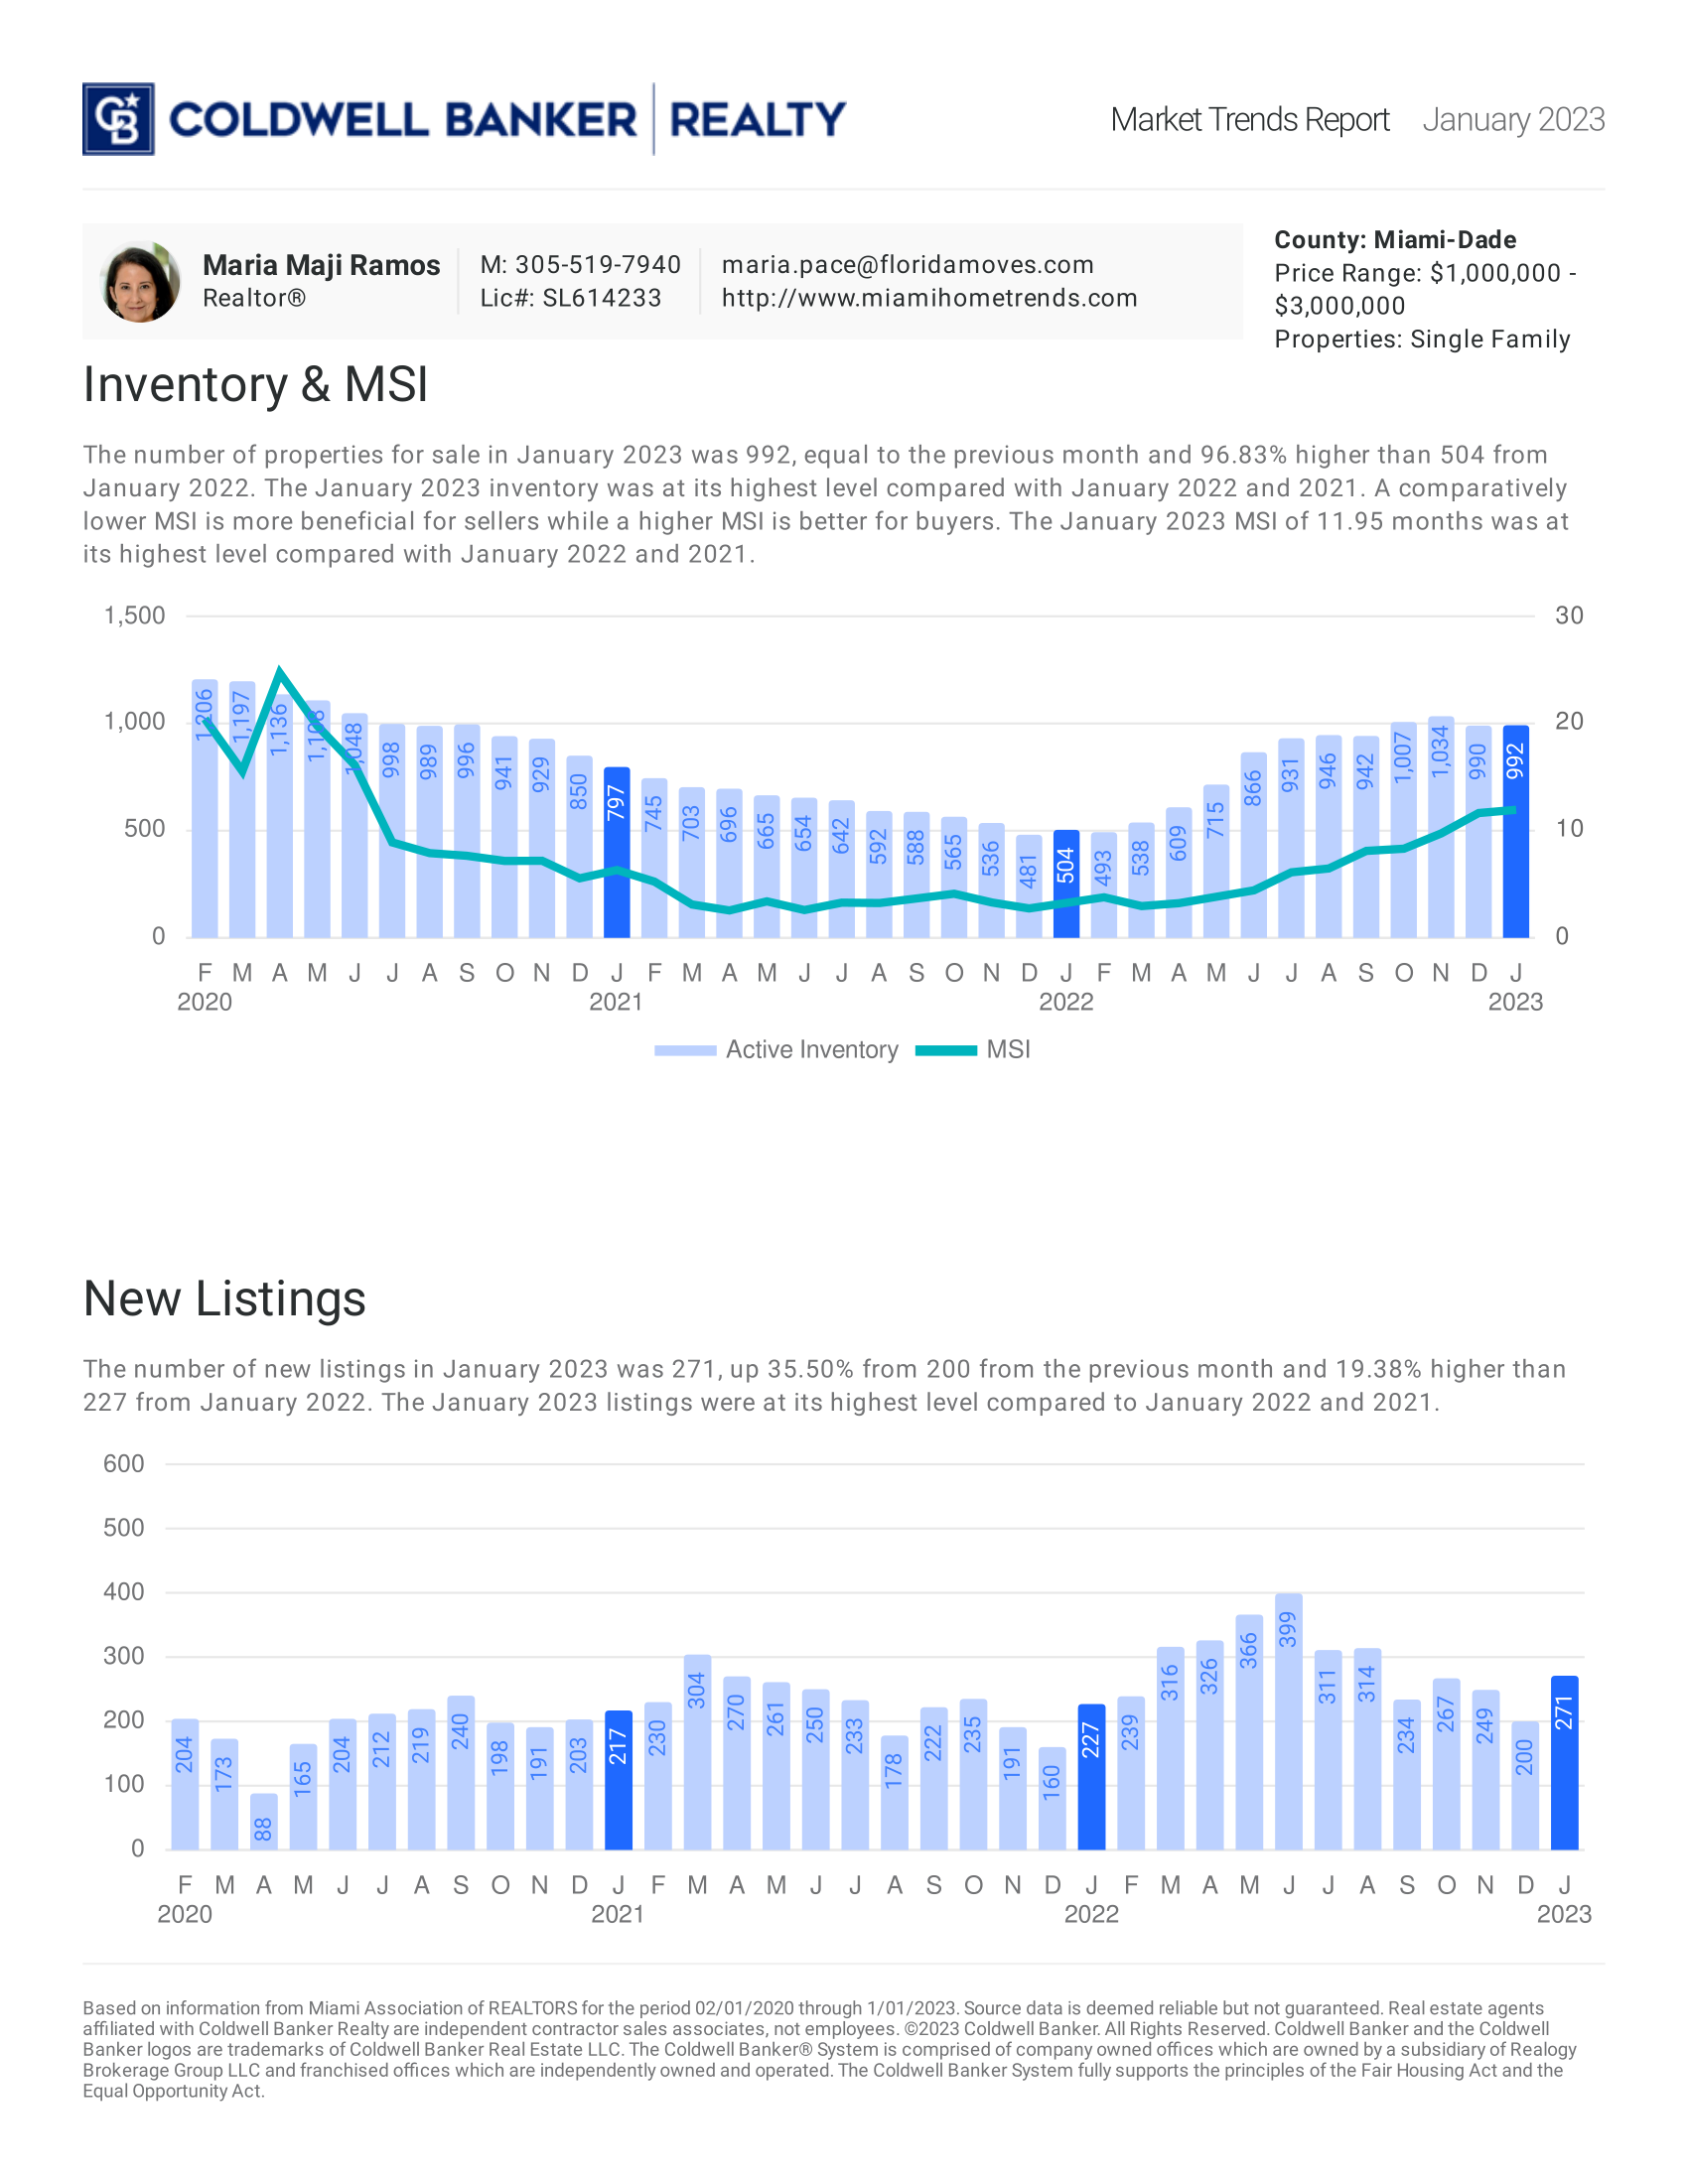
January 2023: Single Family

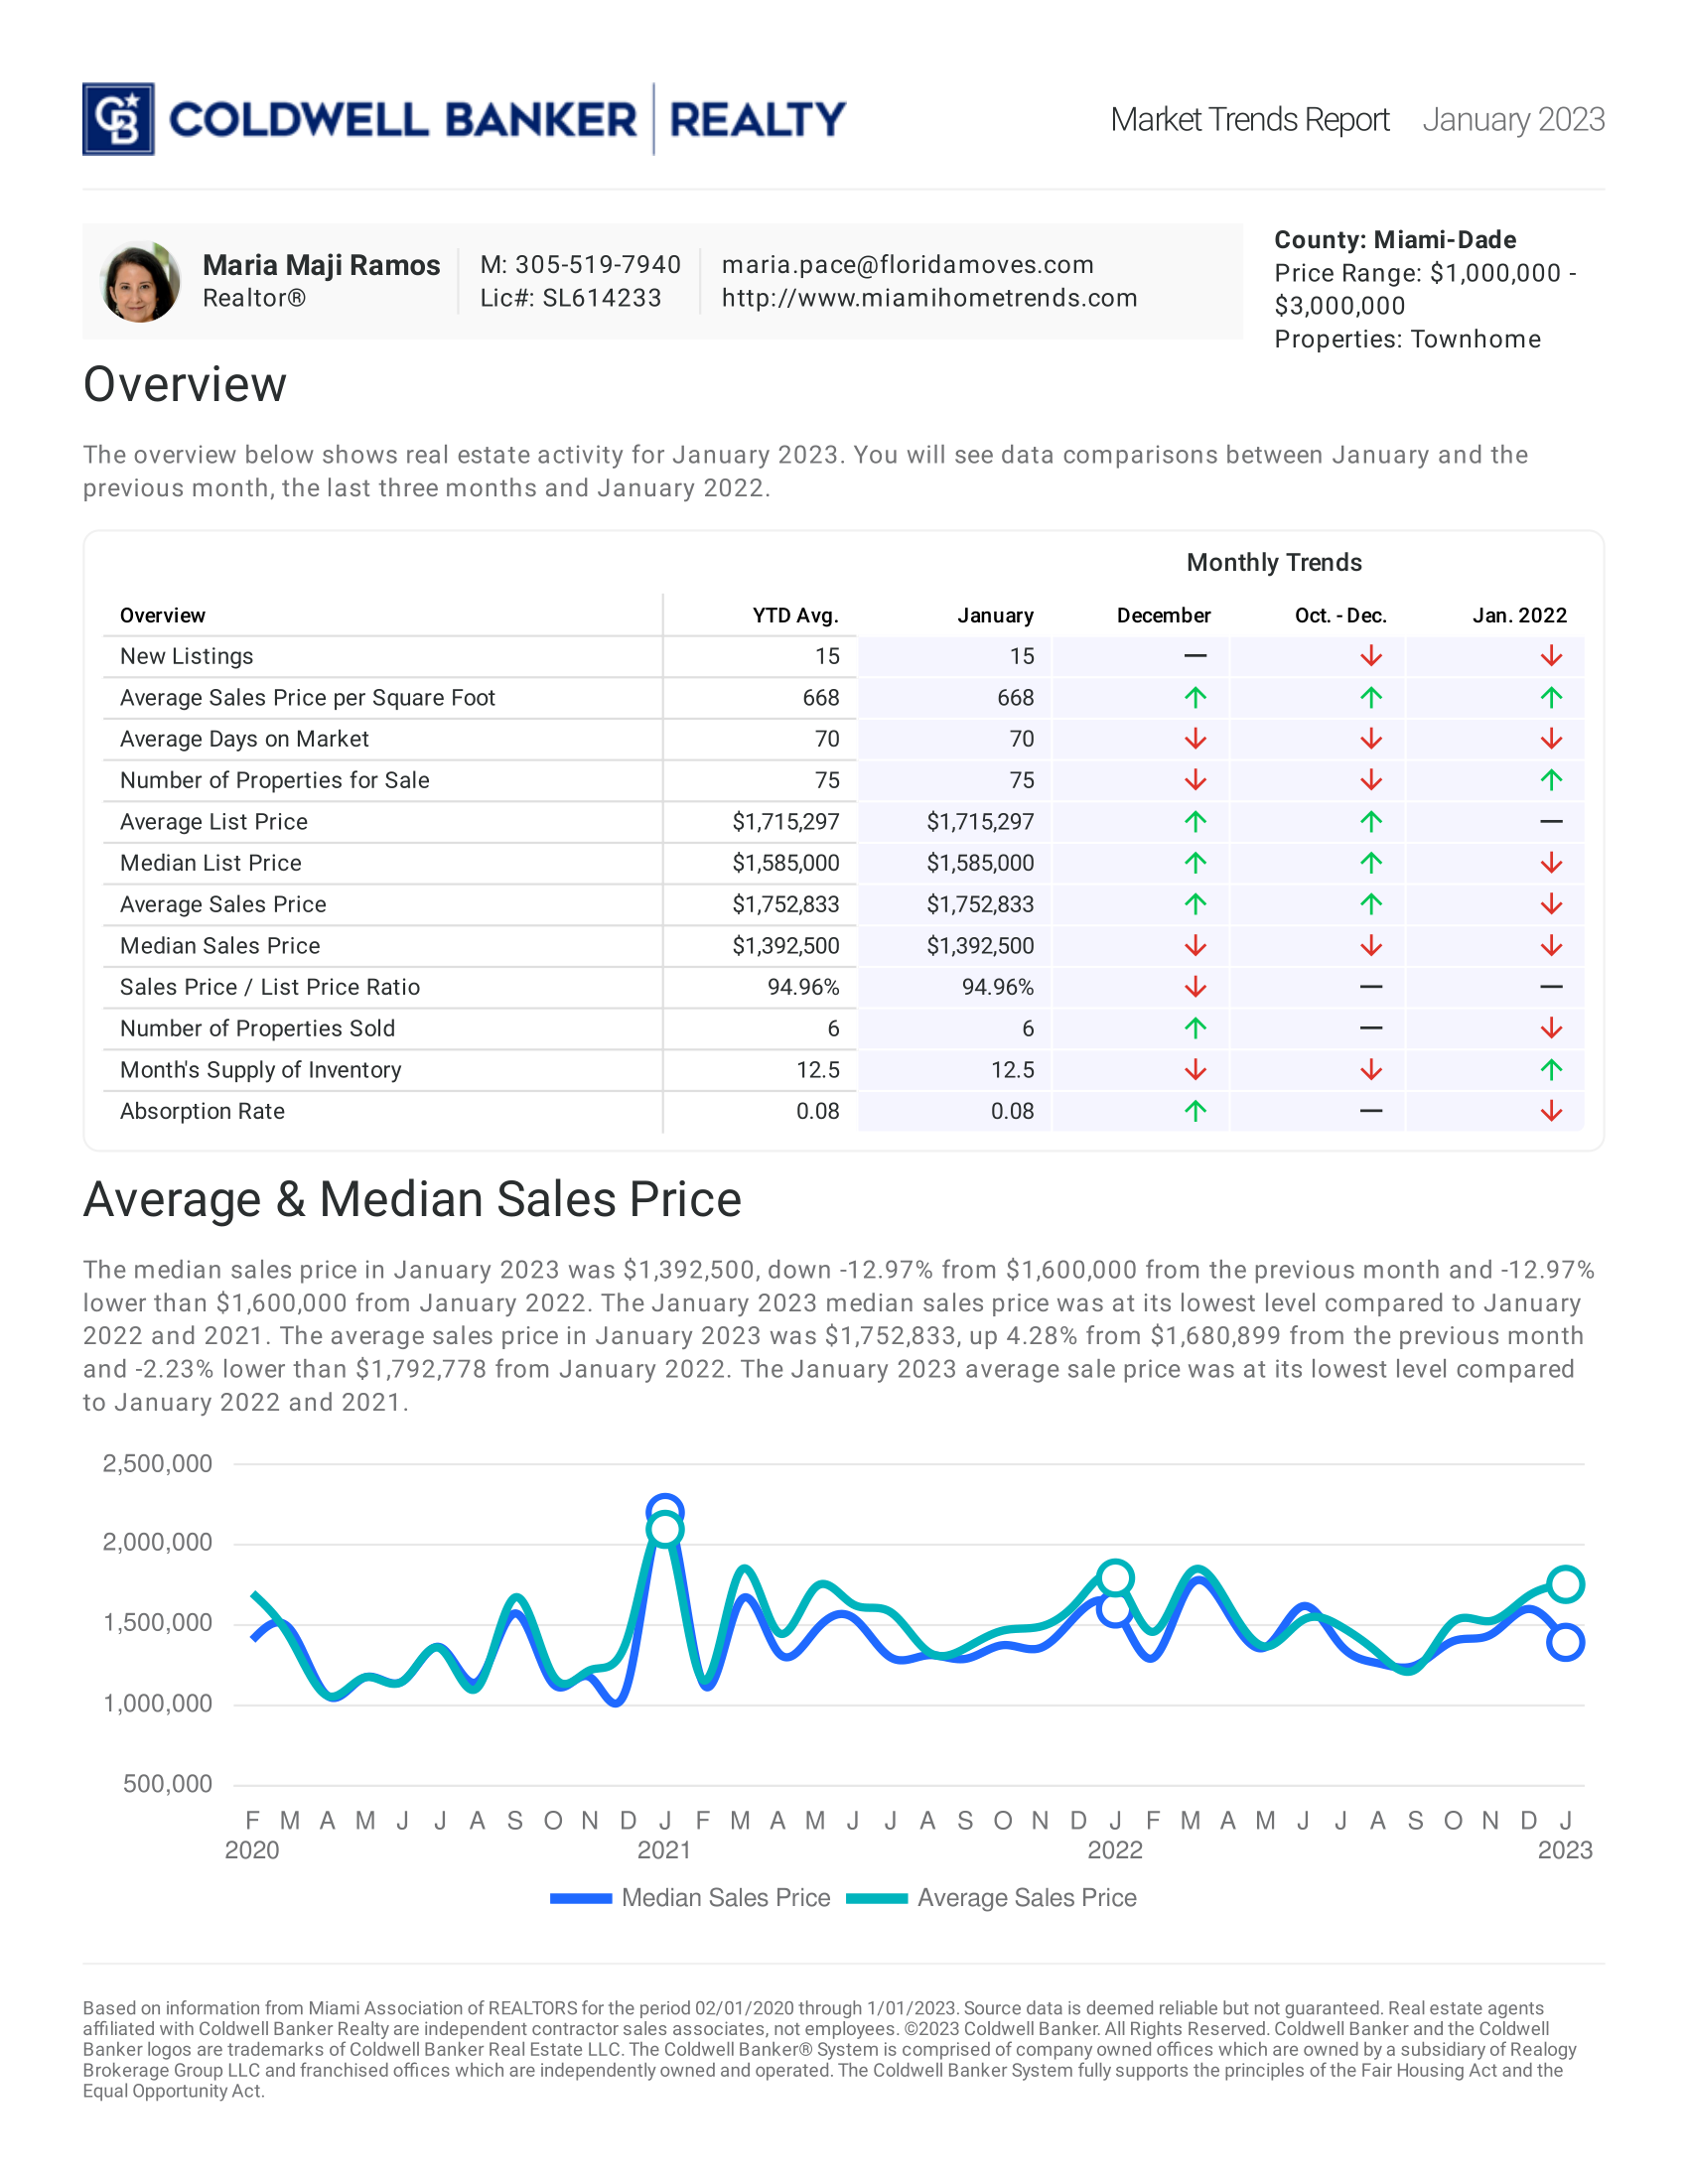
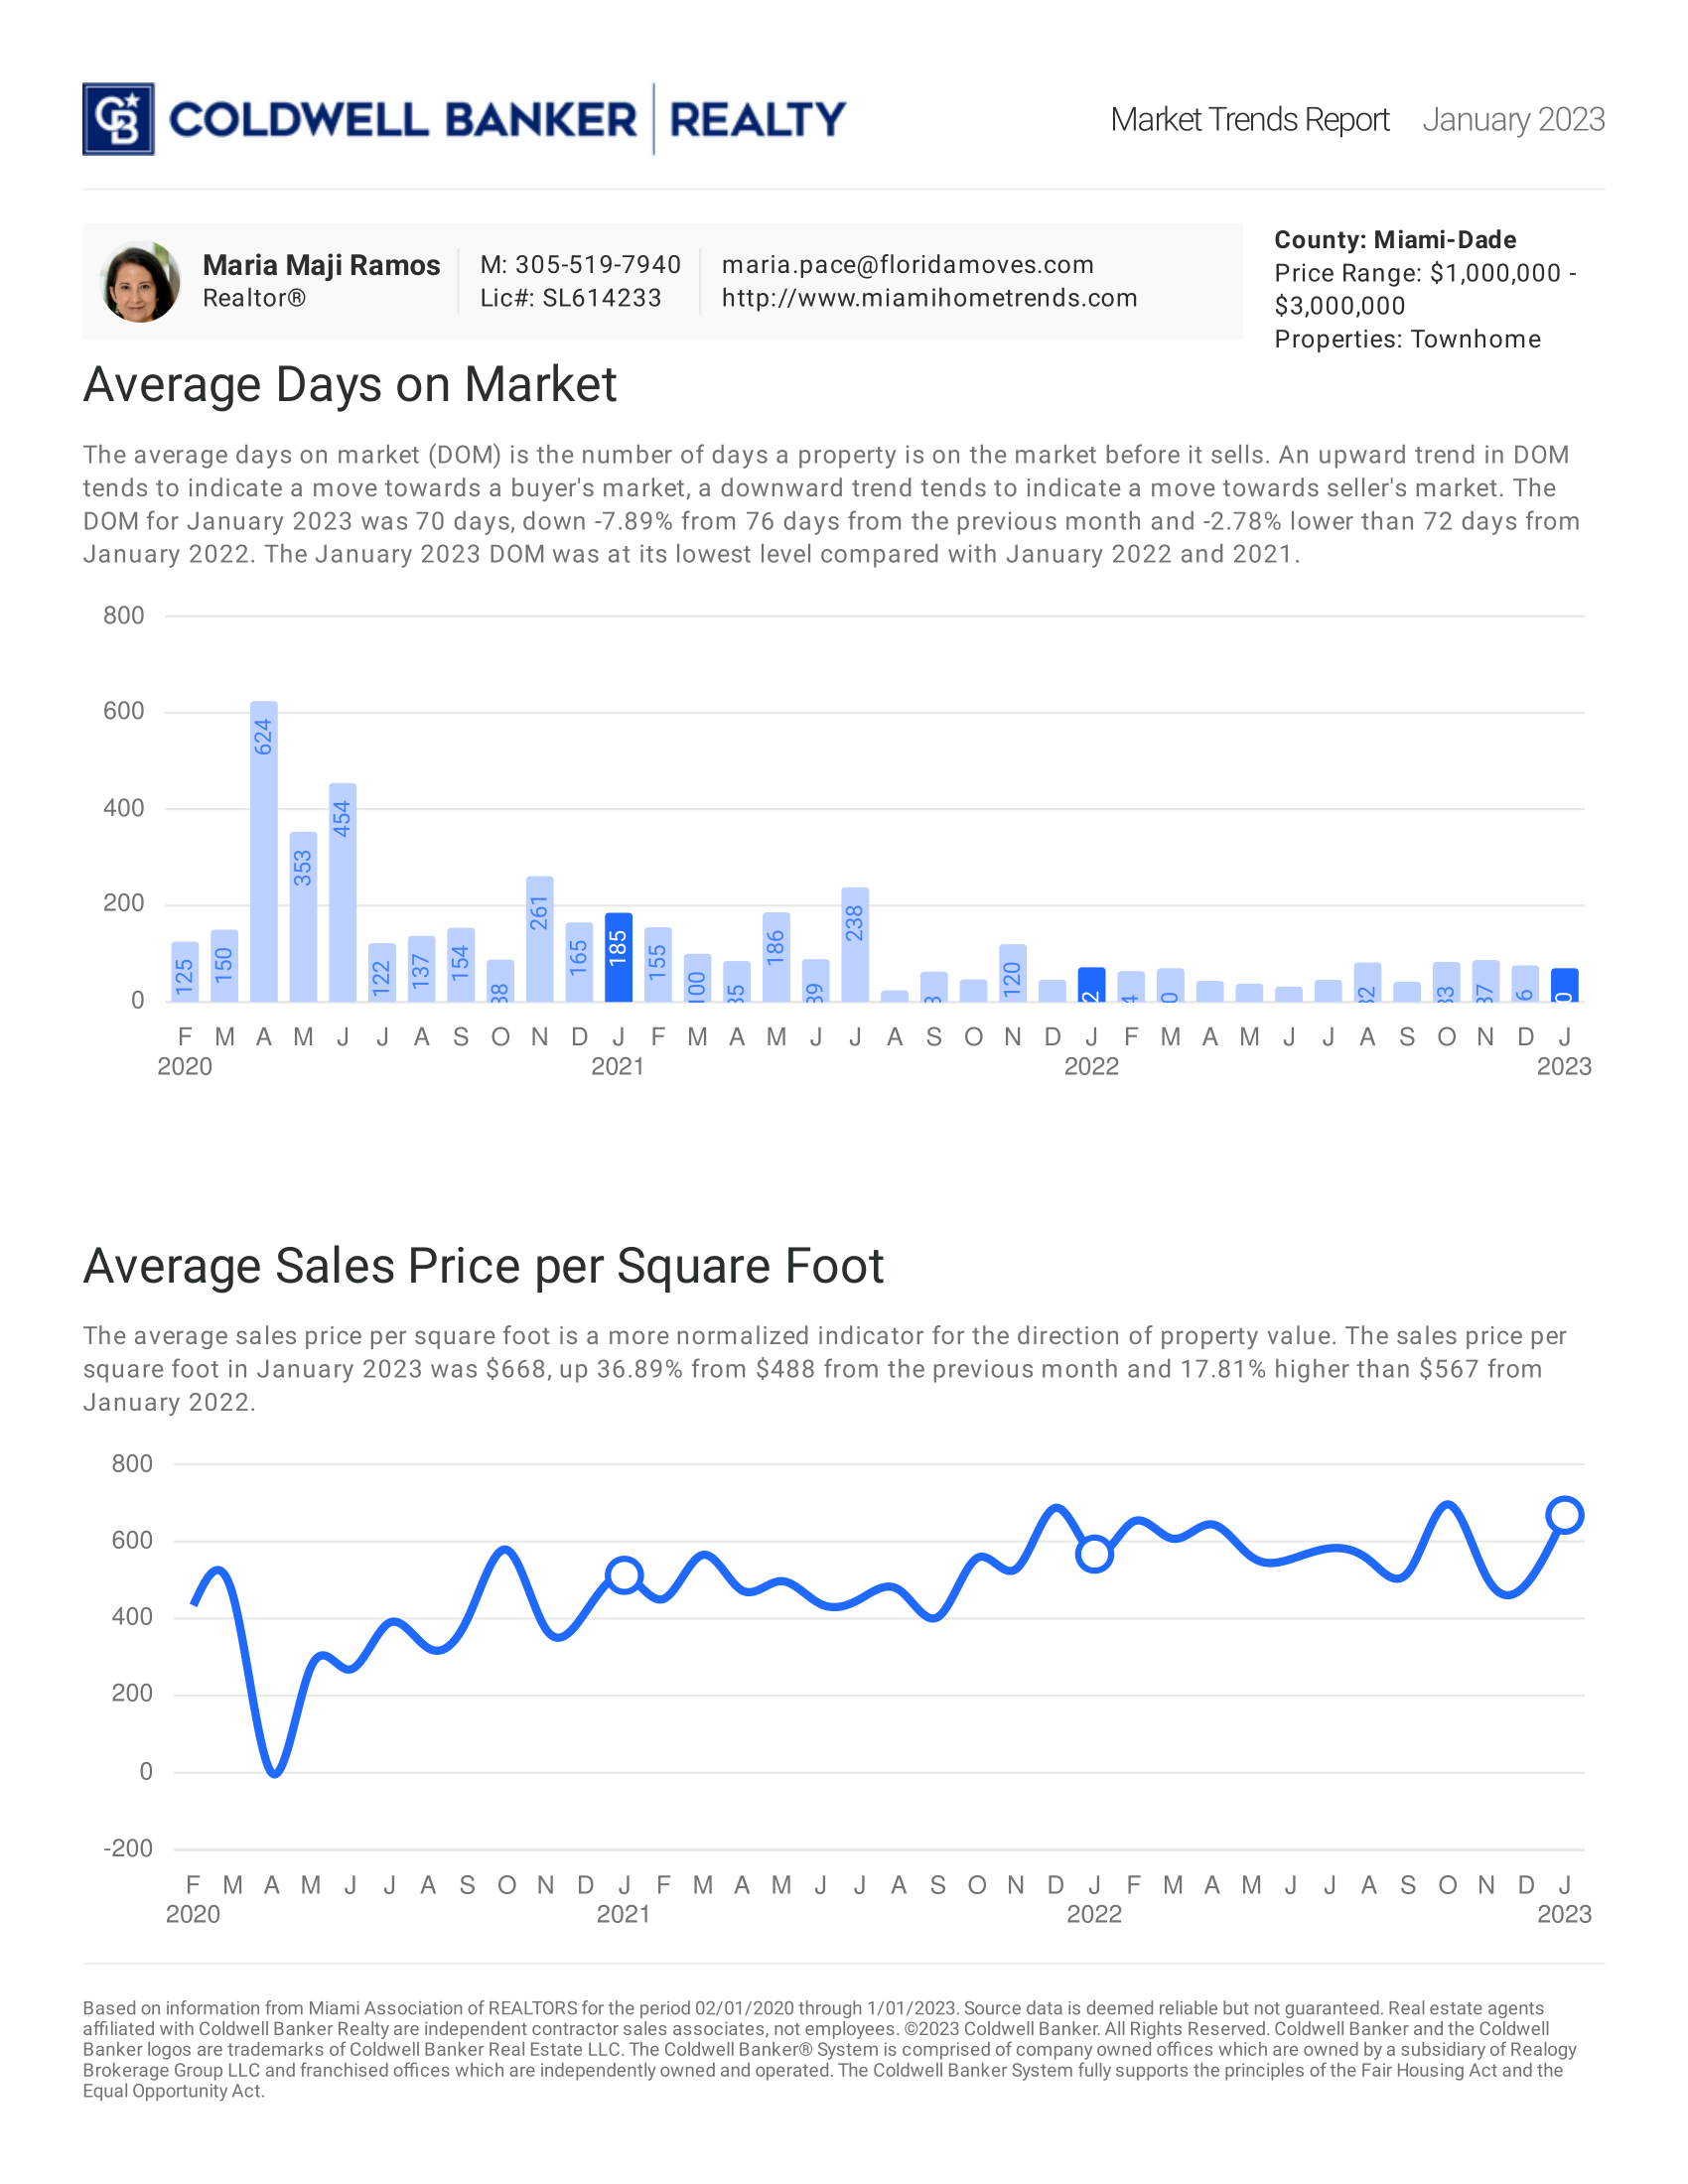
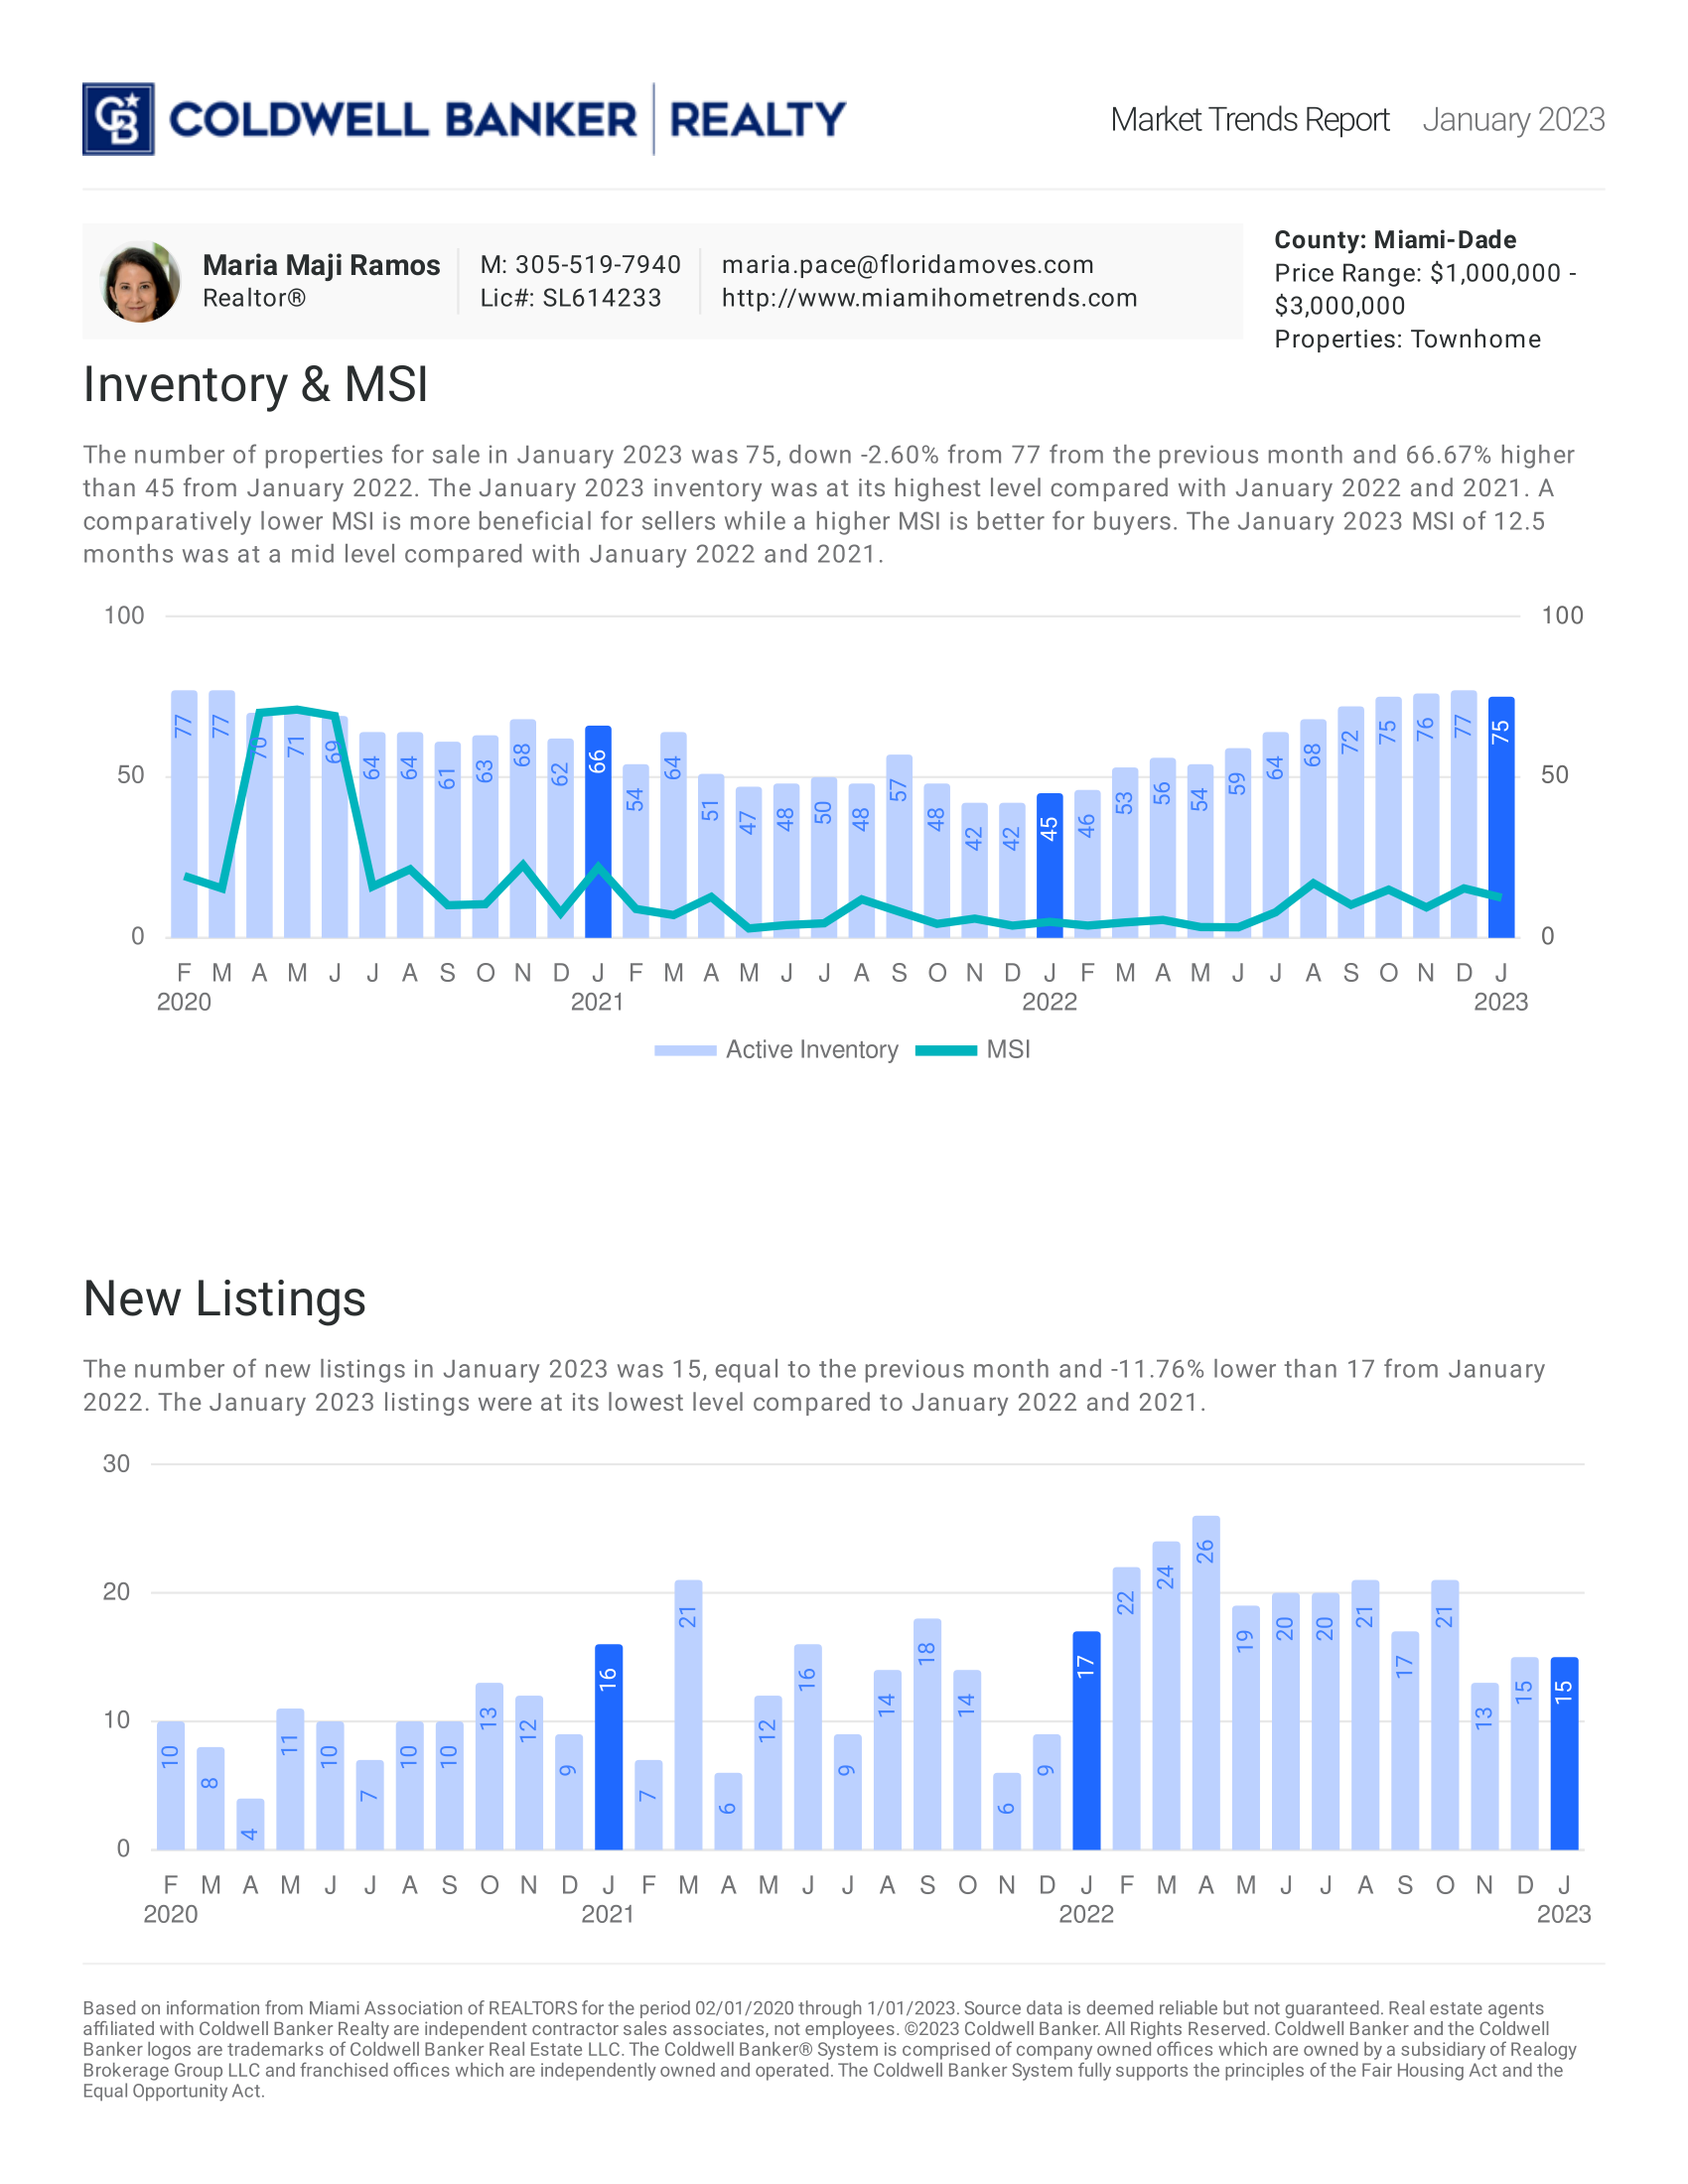
January 2023: Townhome


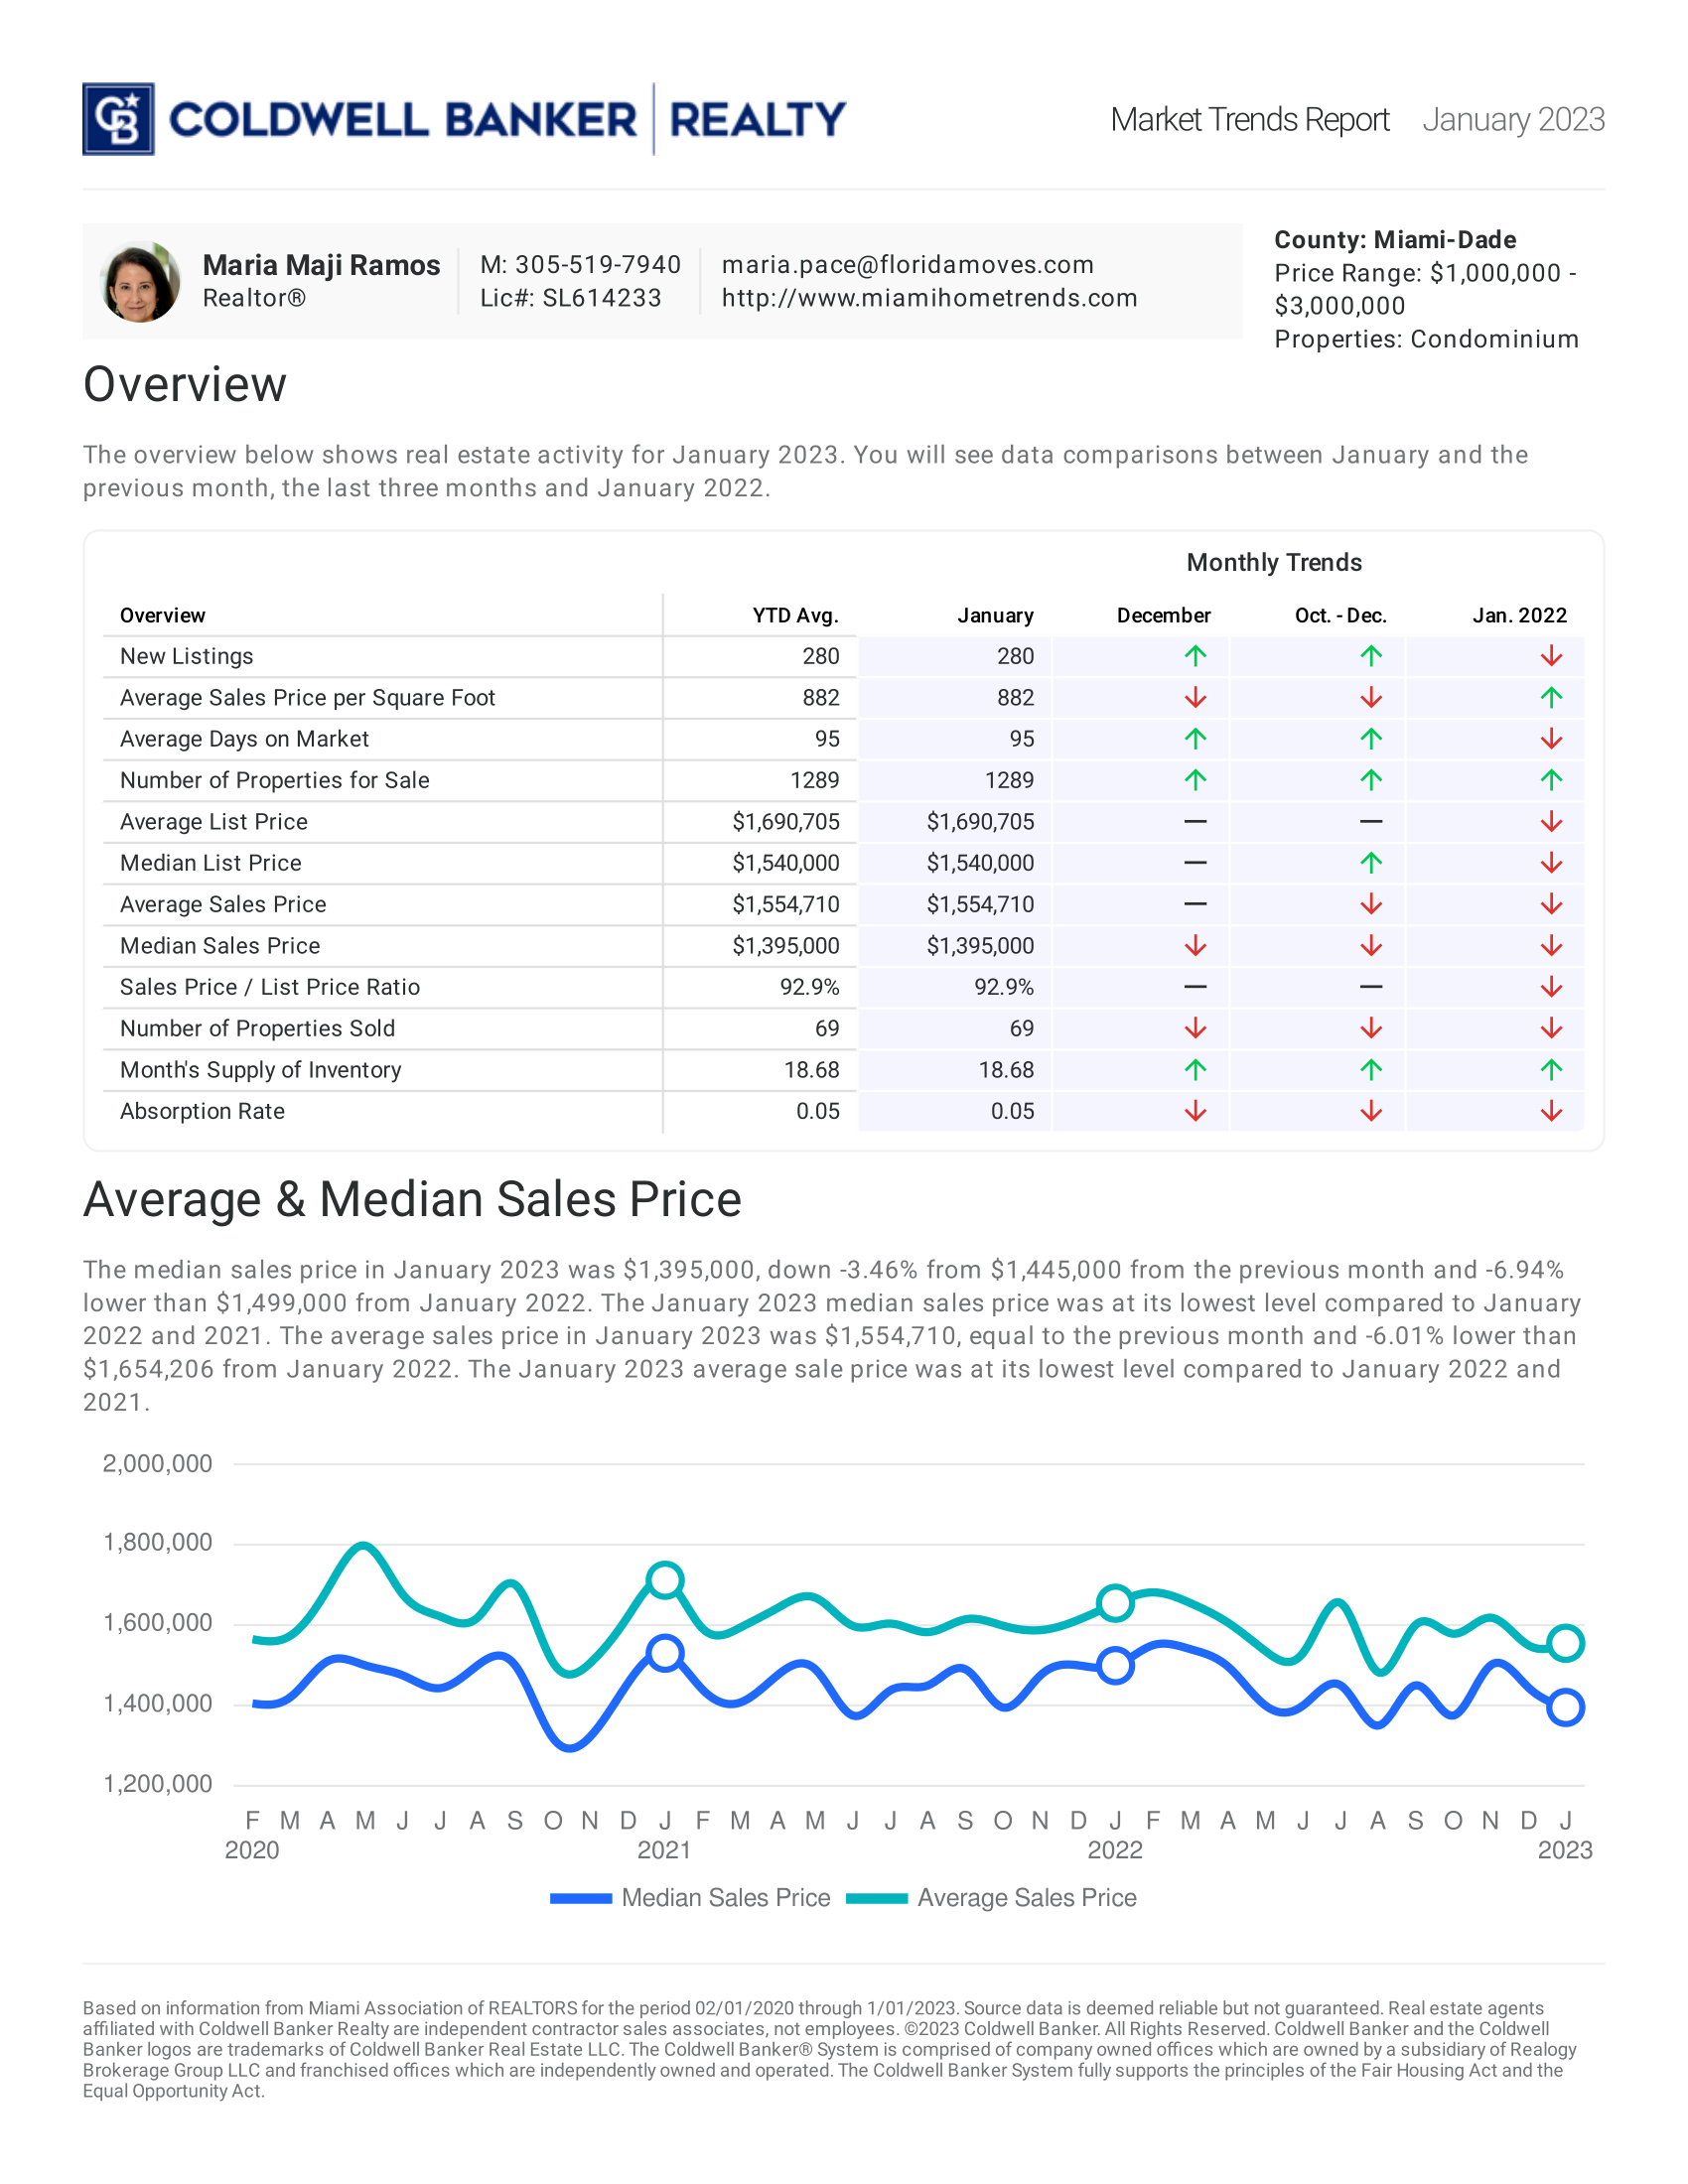
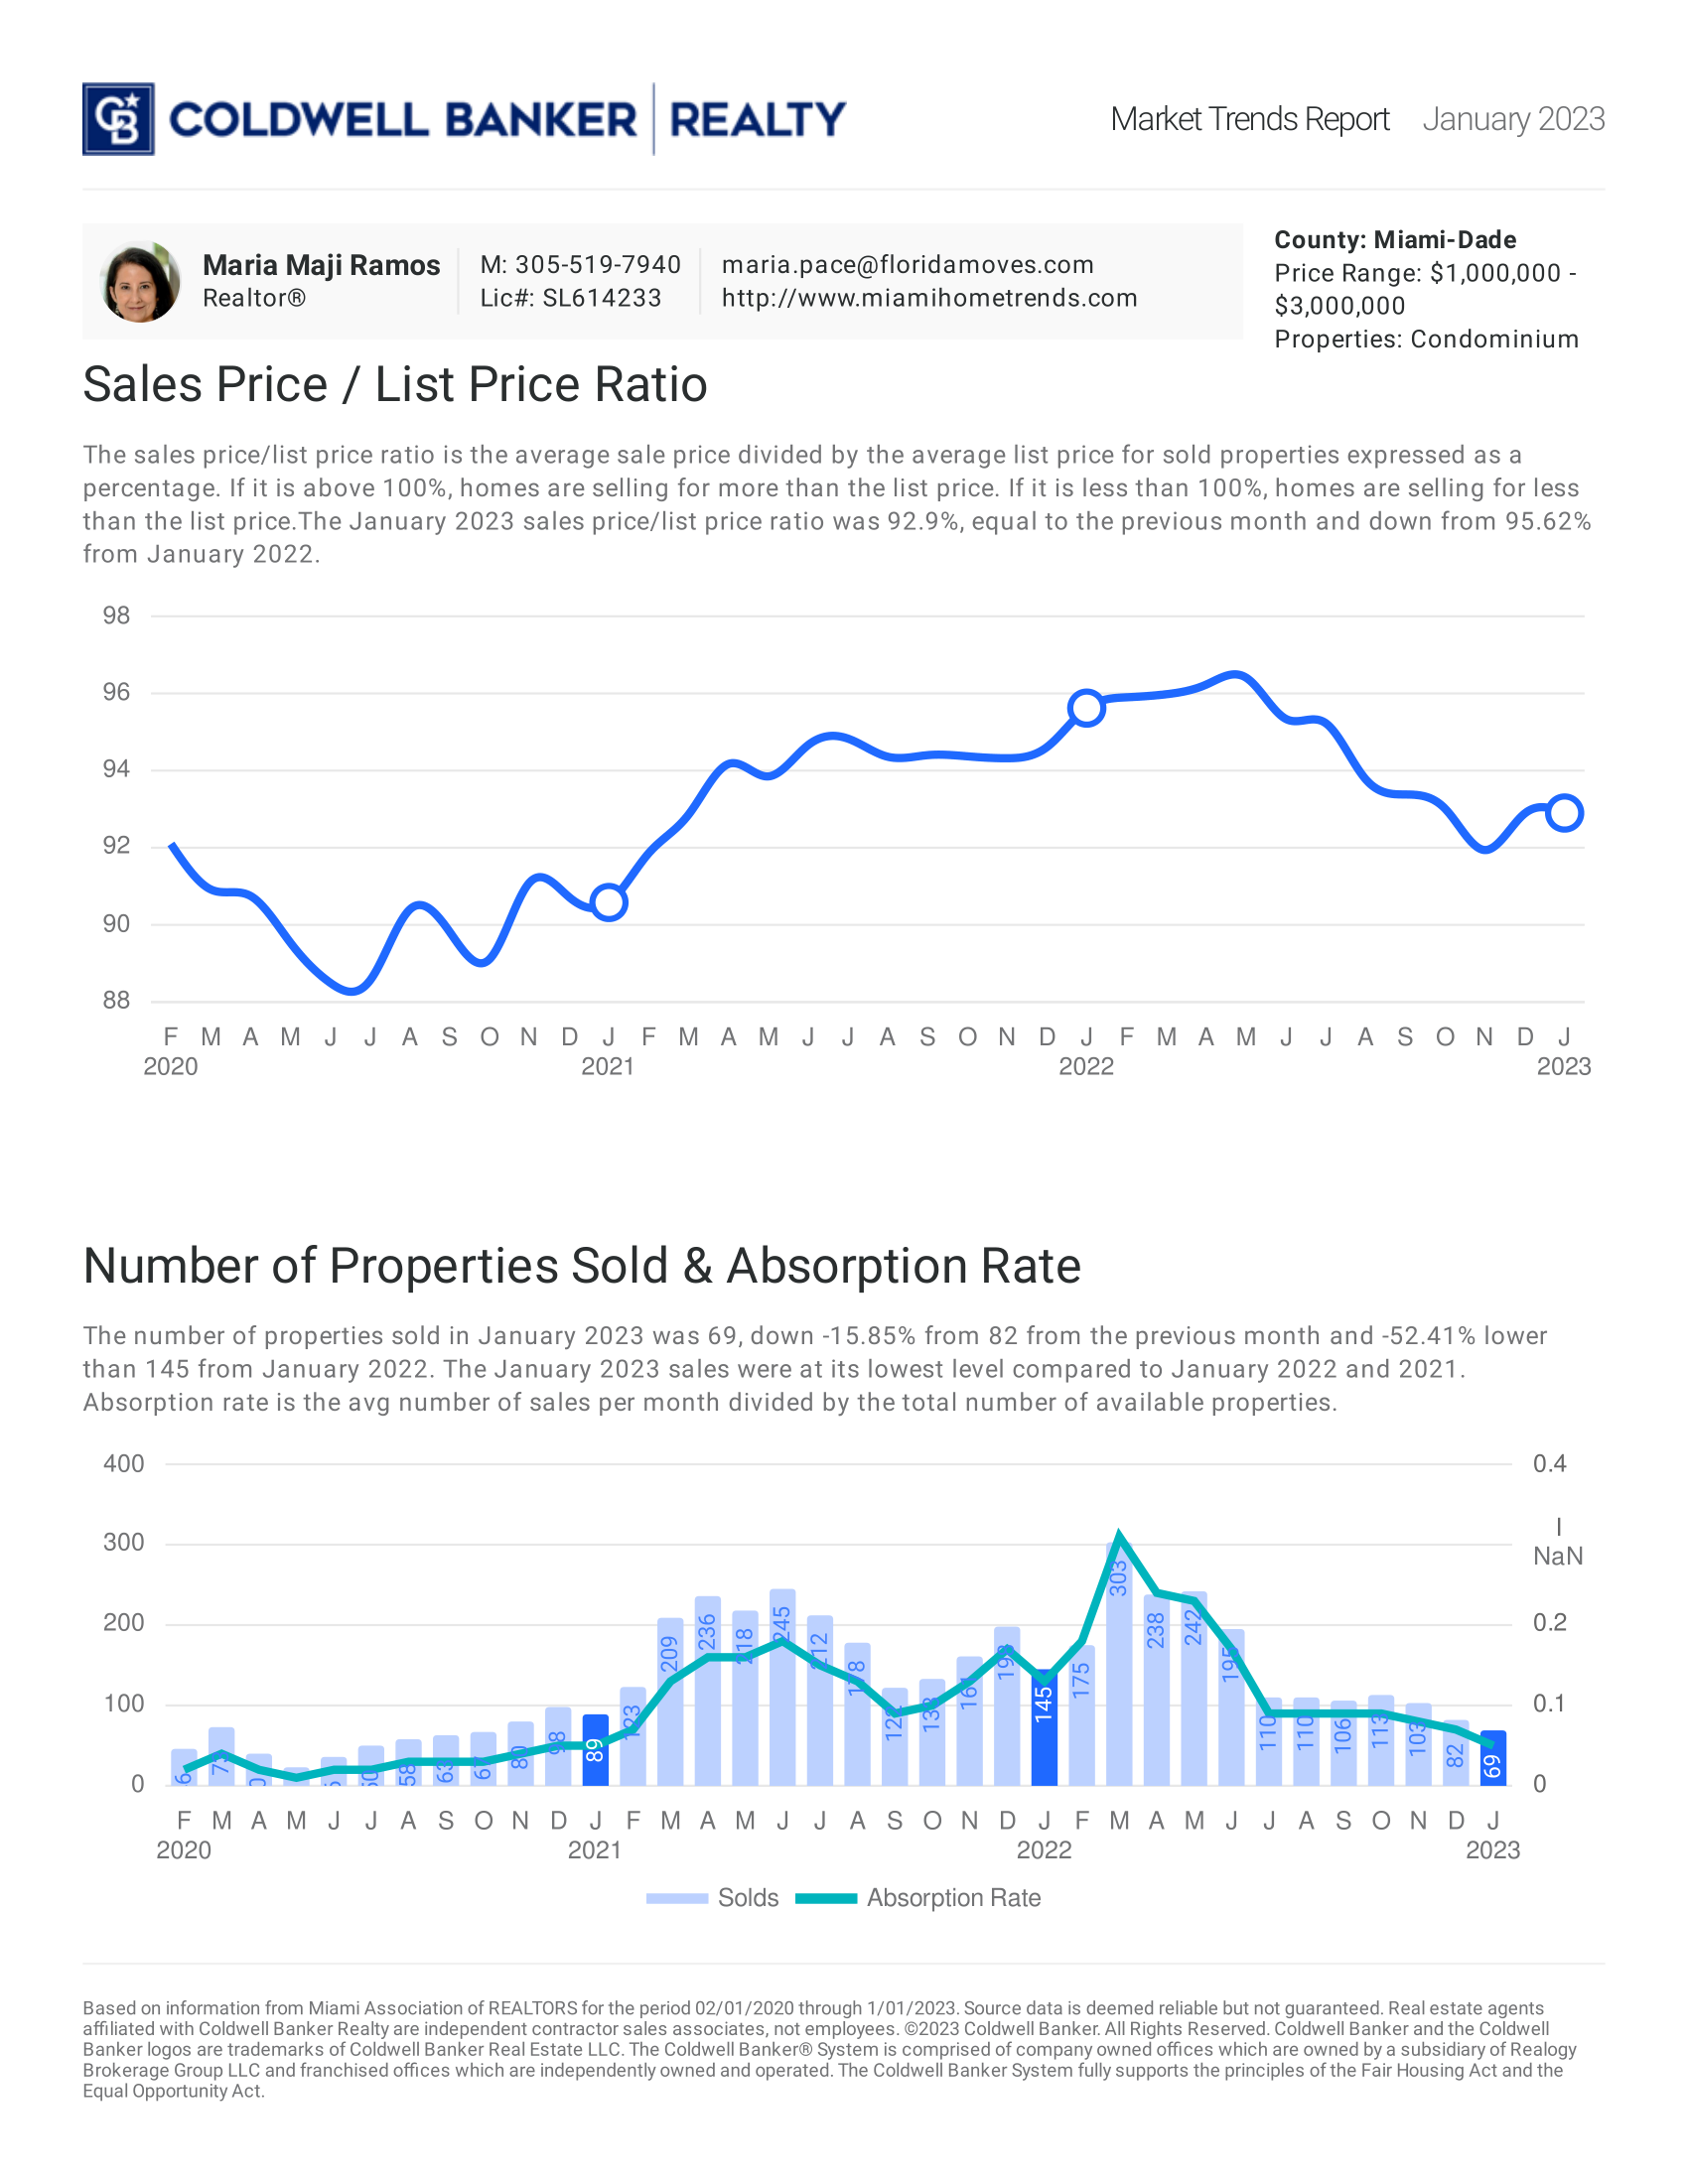
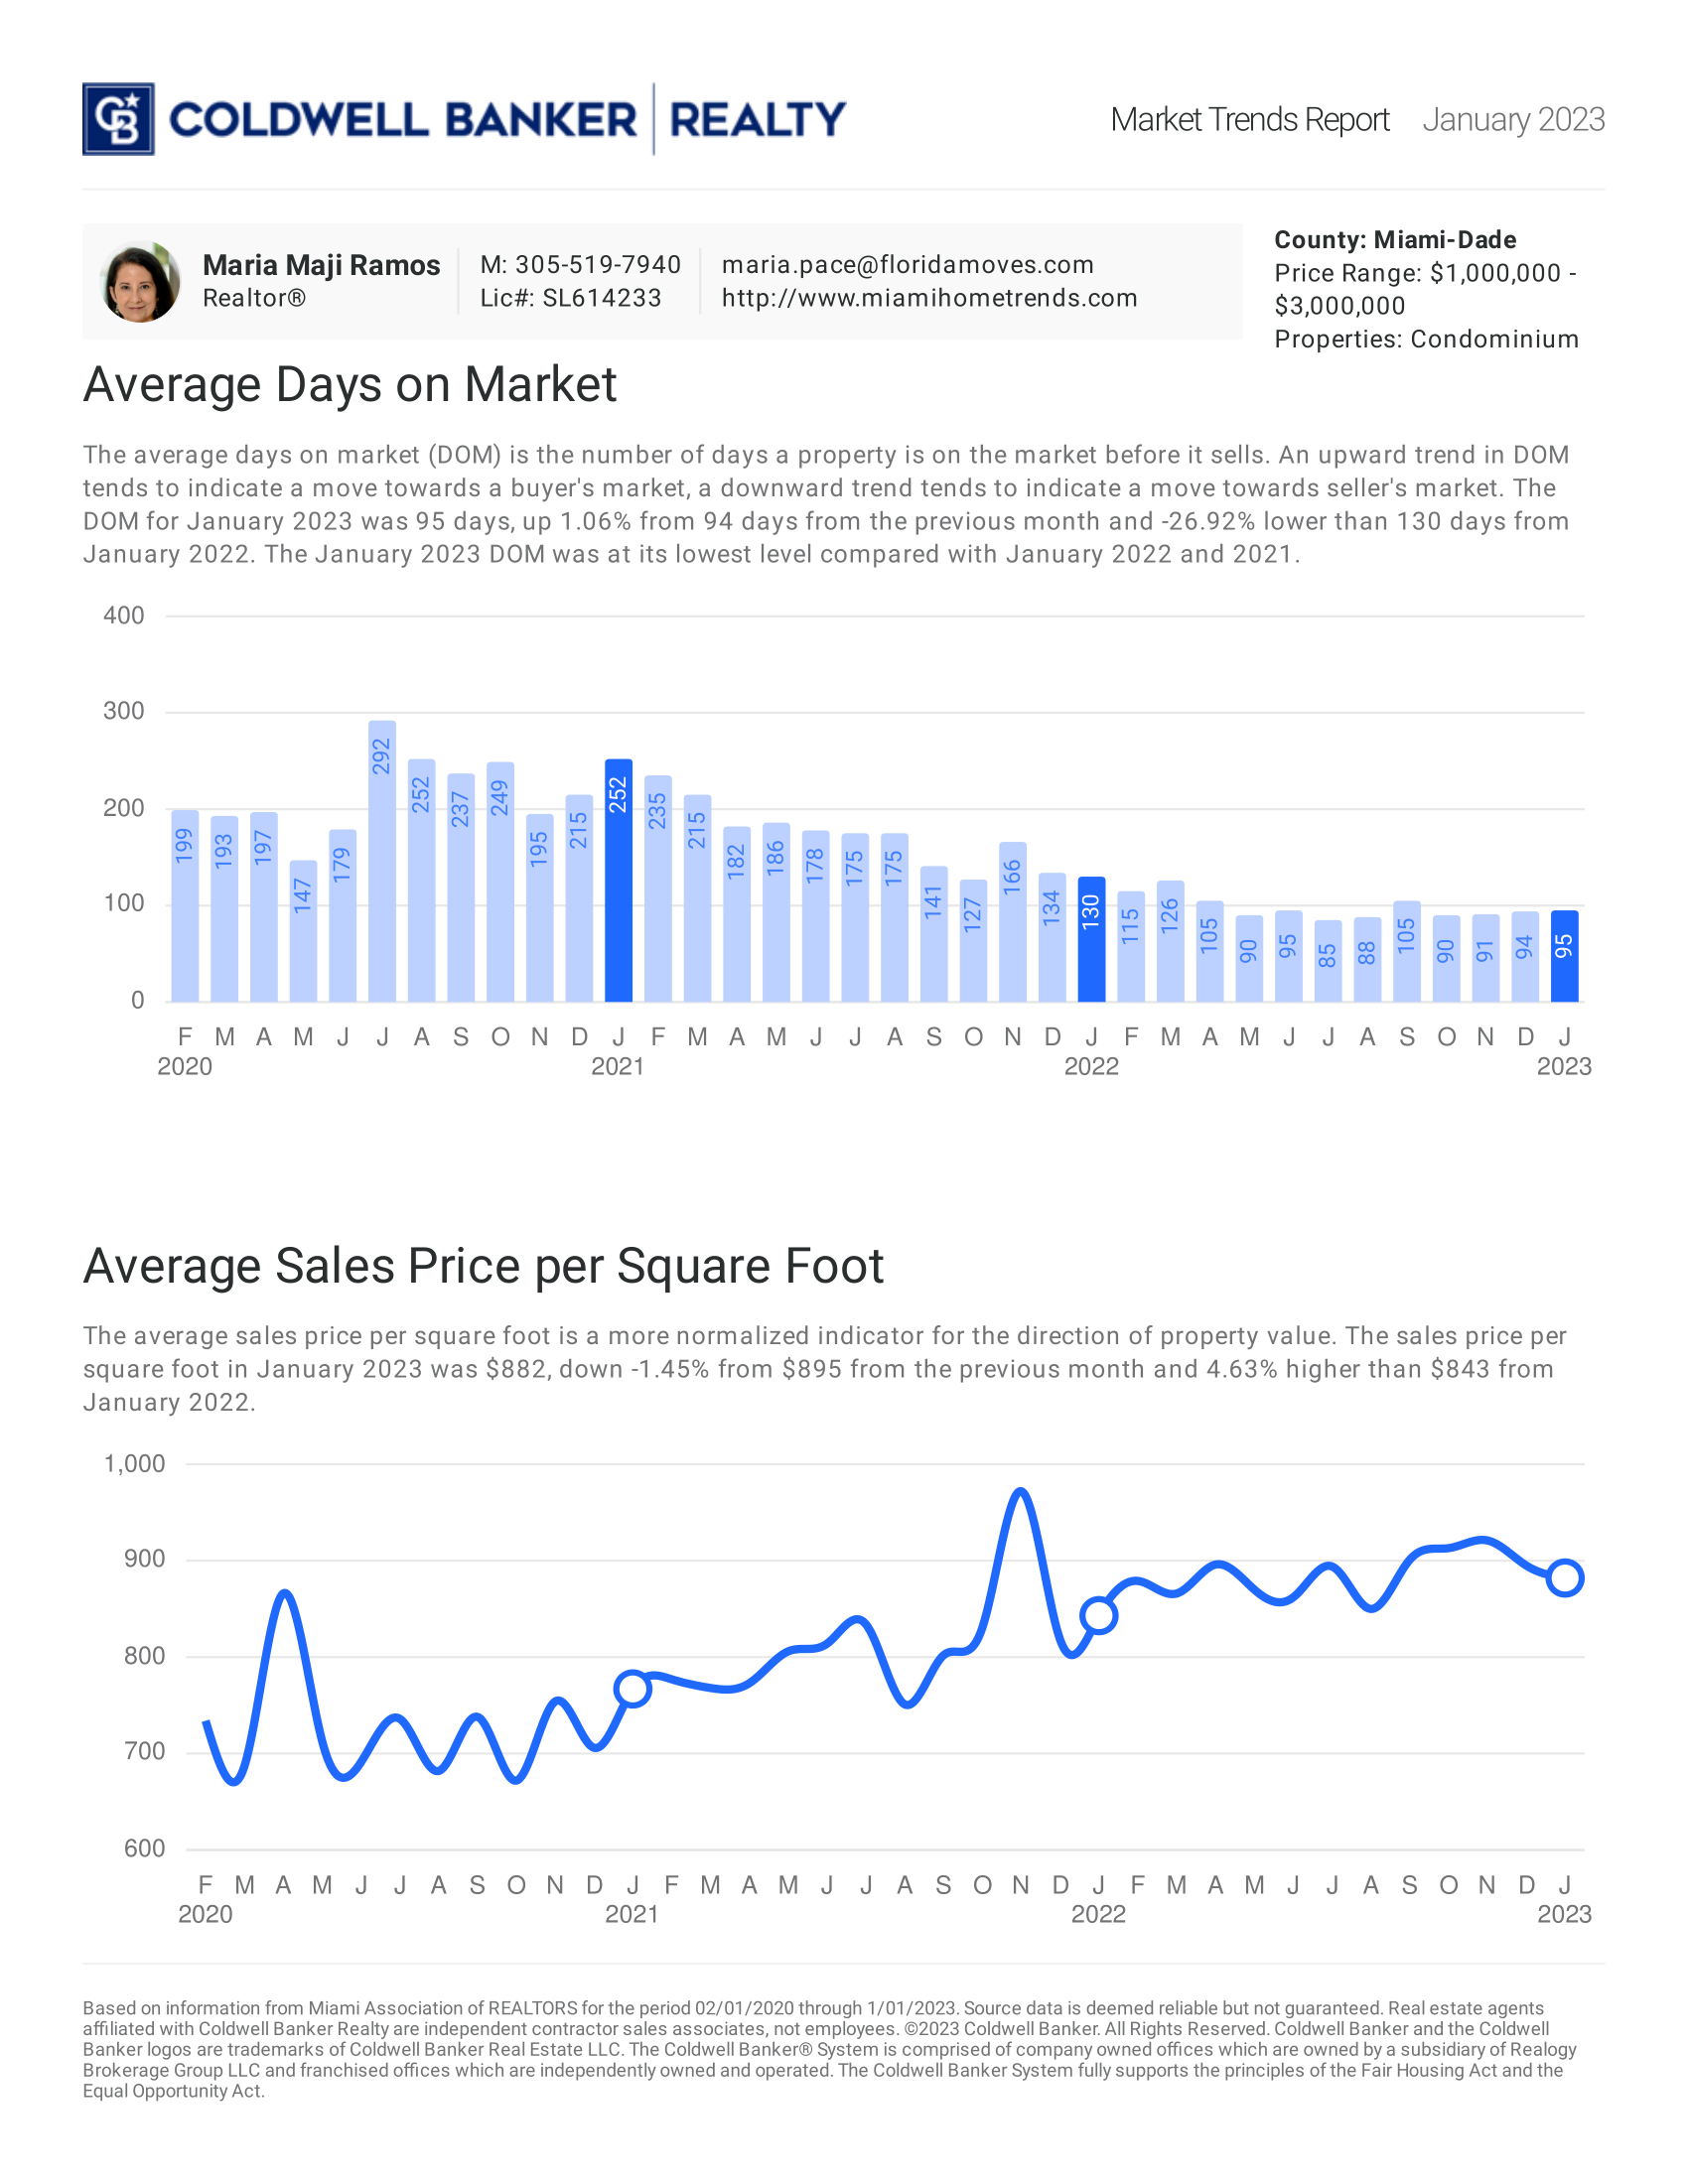
January 2023: Condo


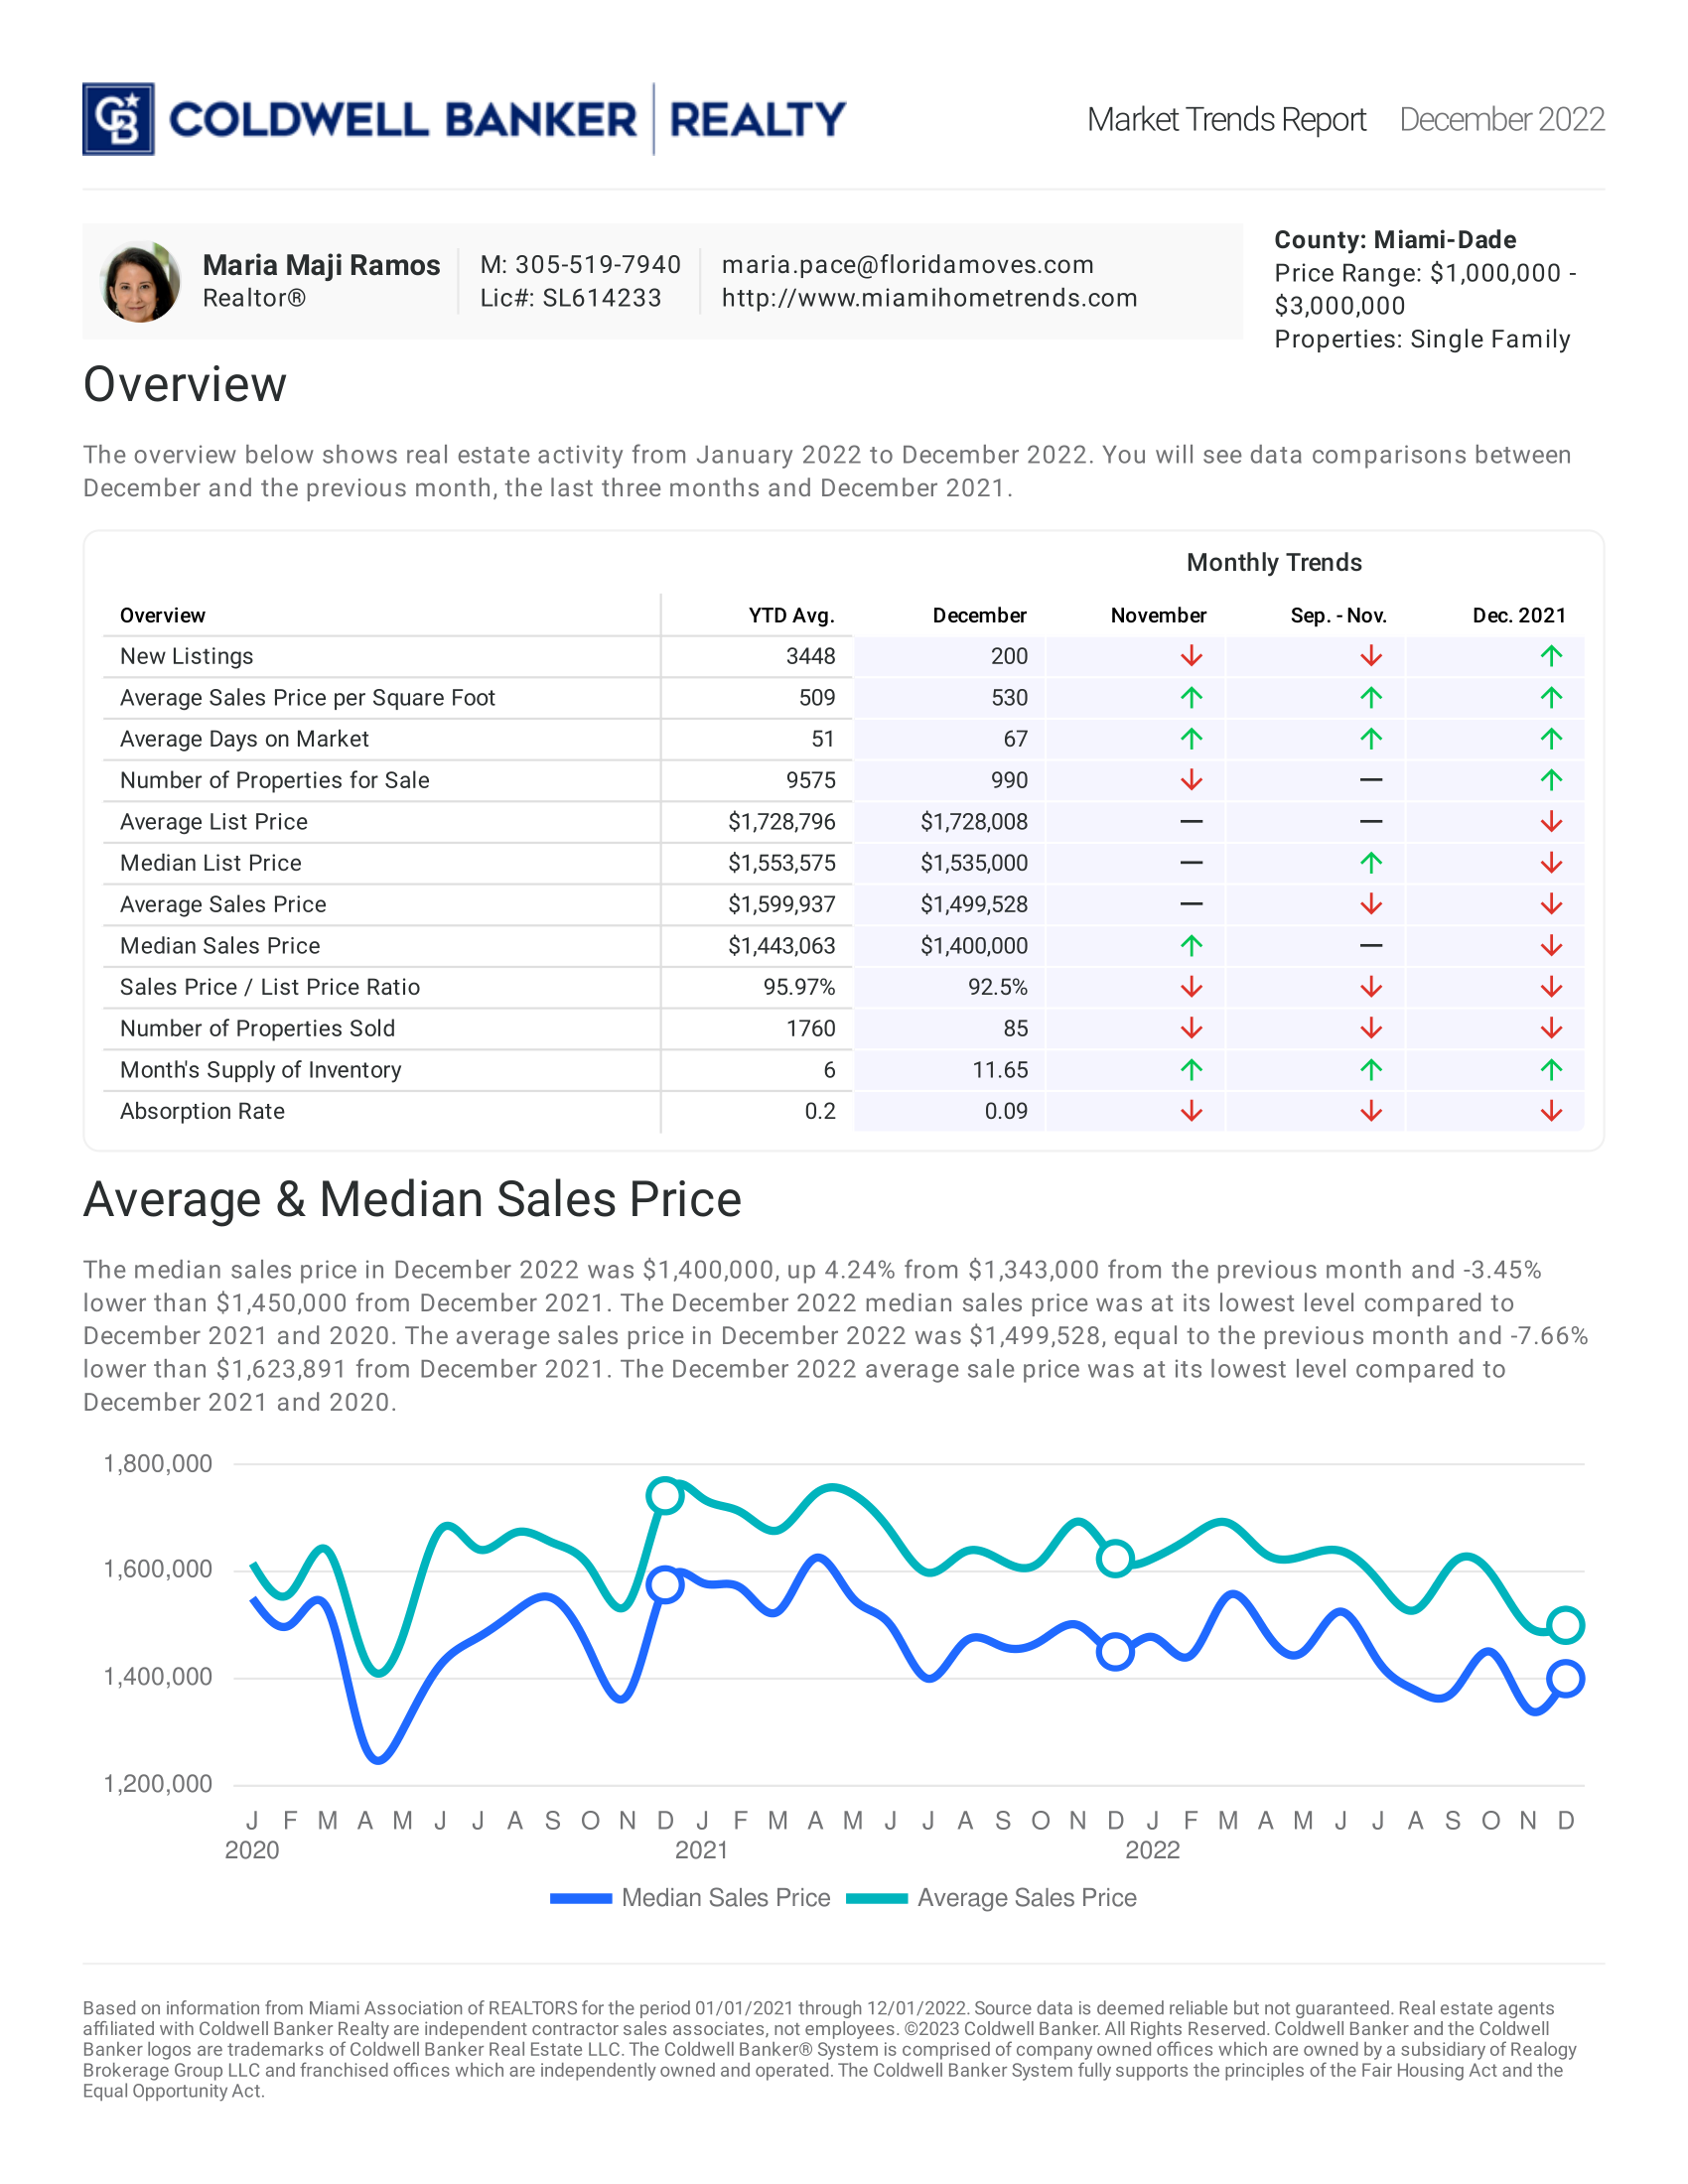
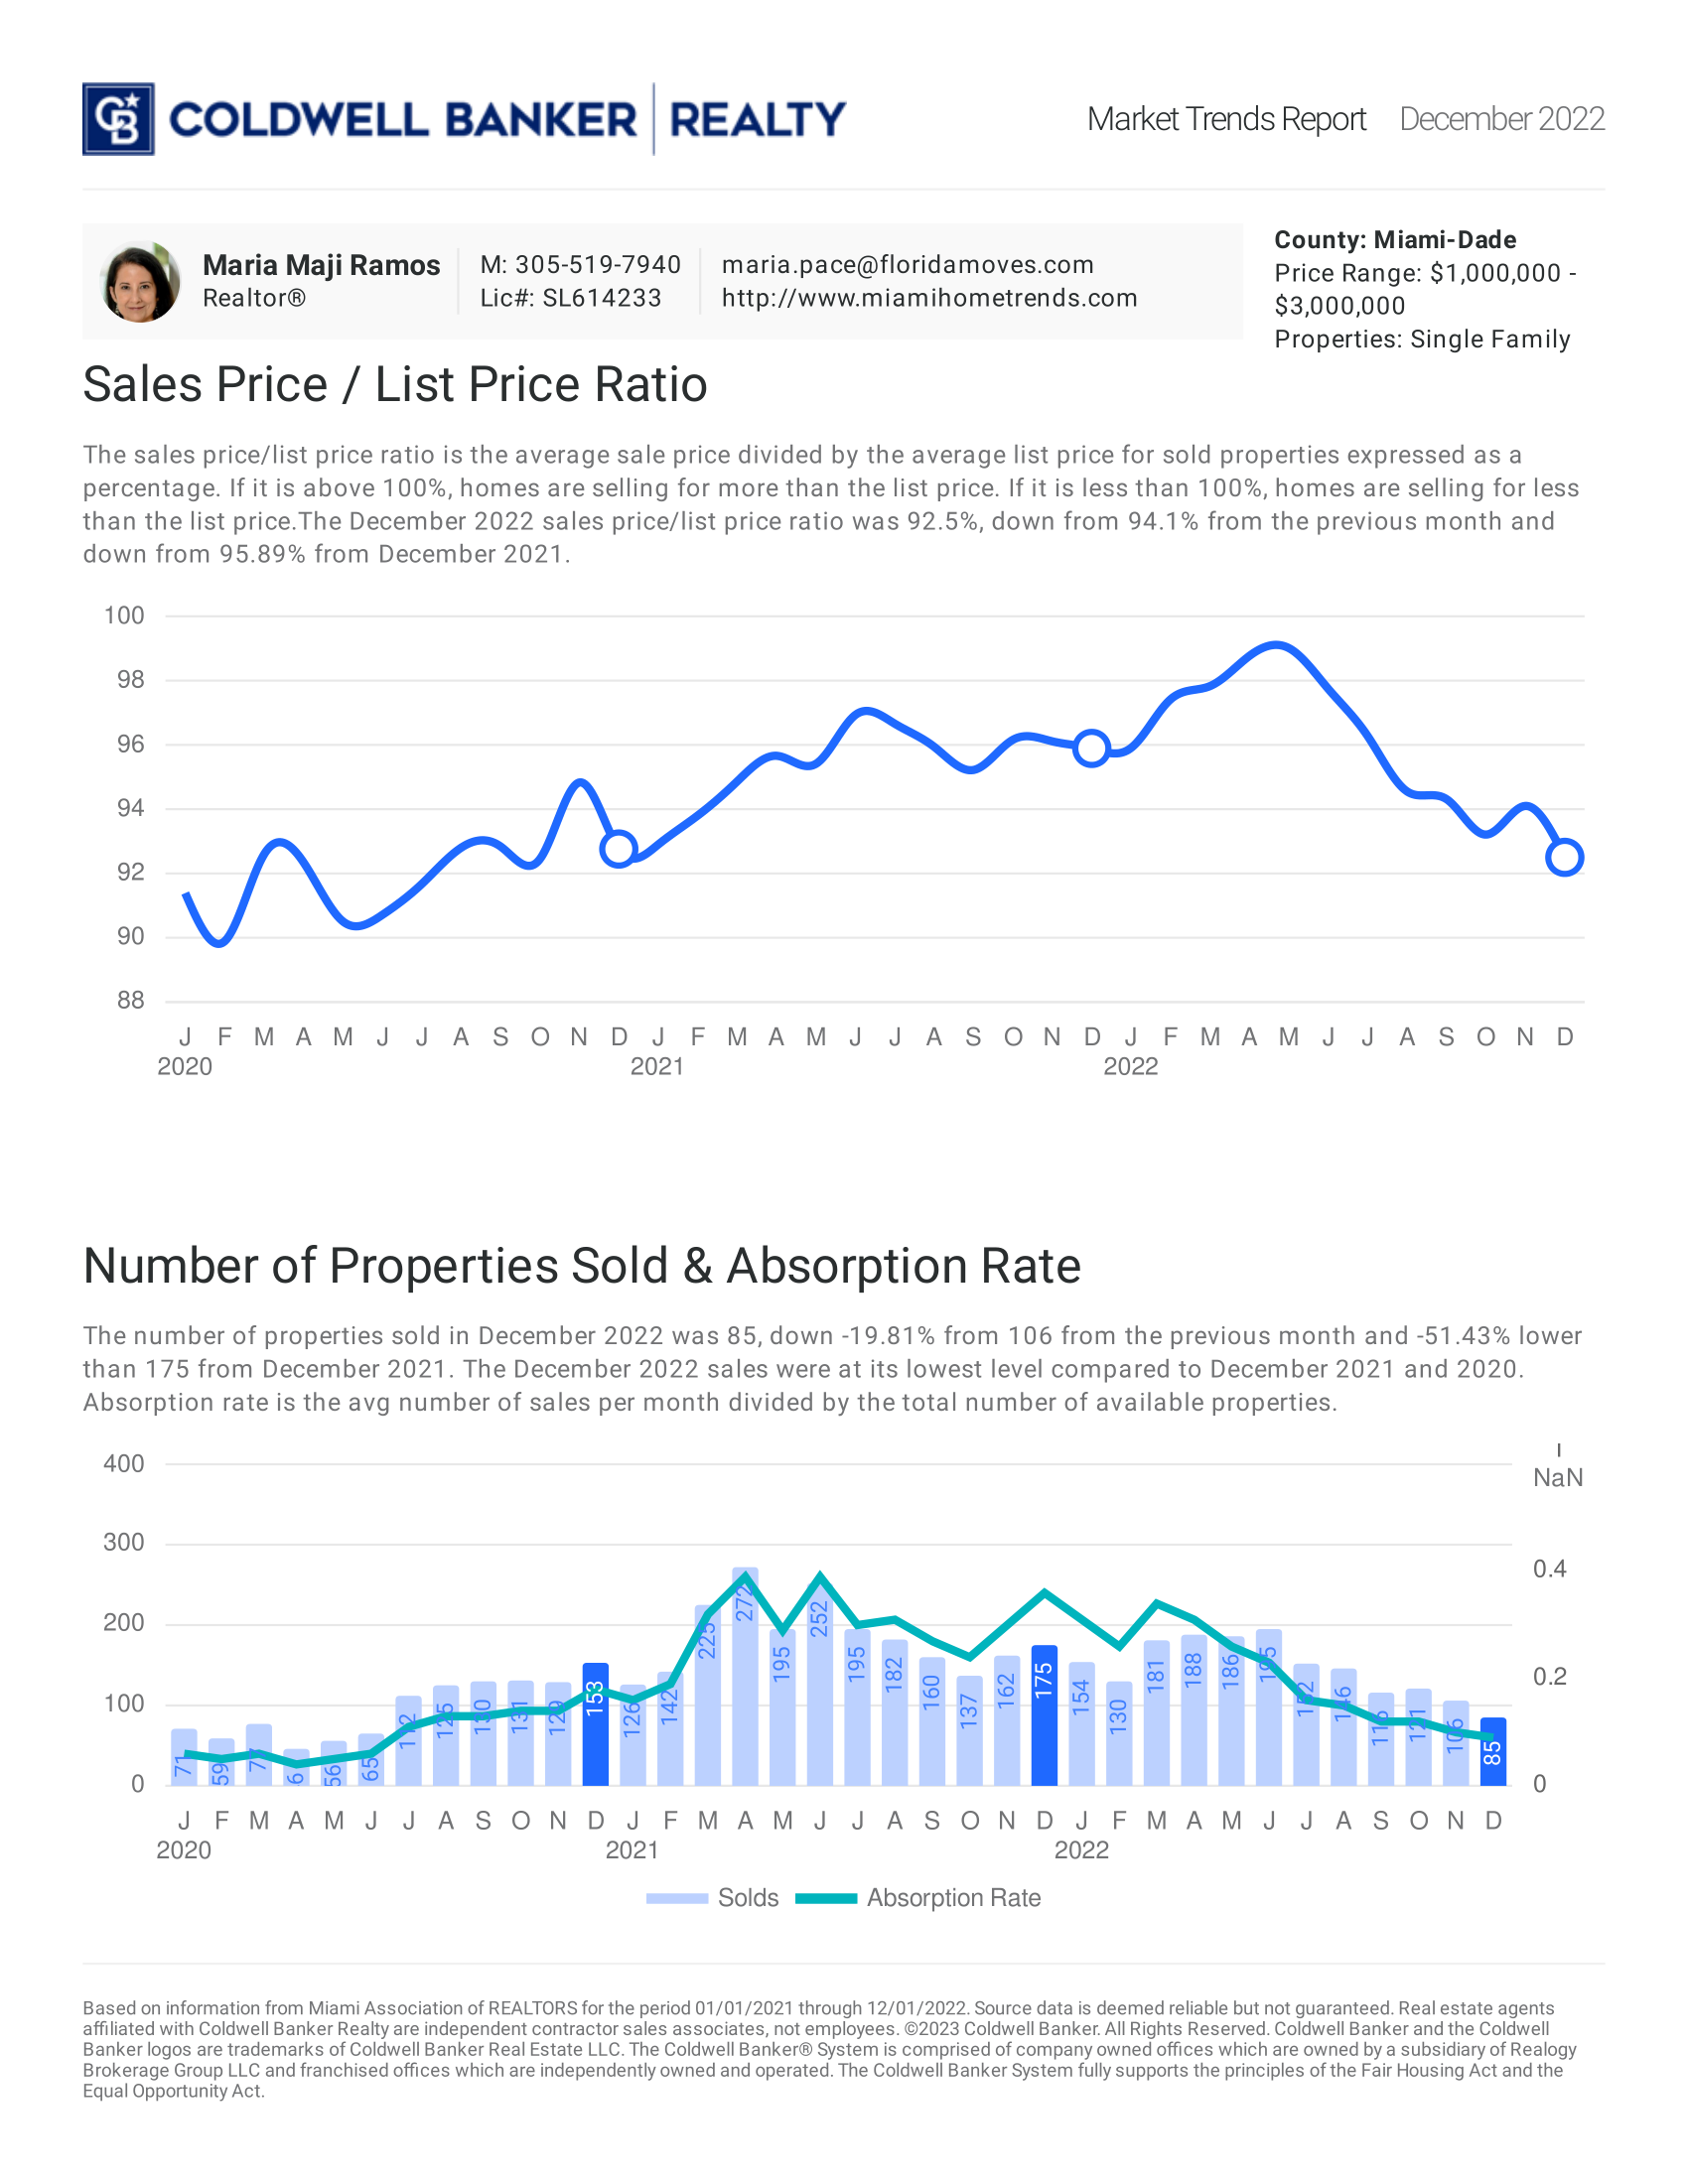
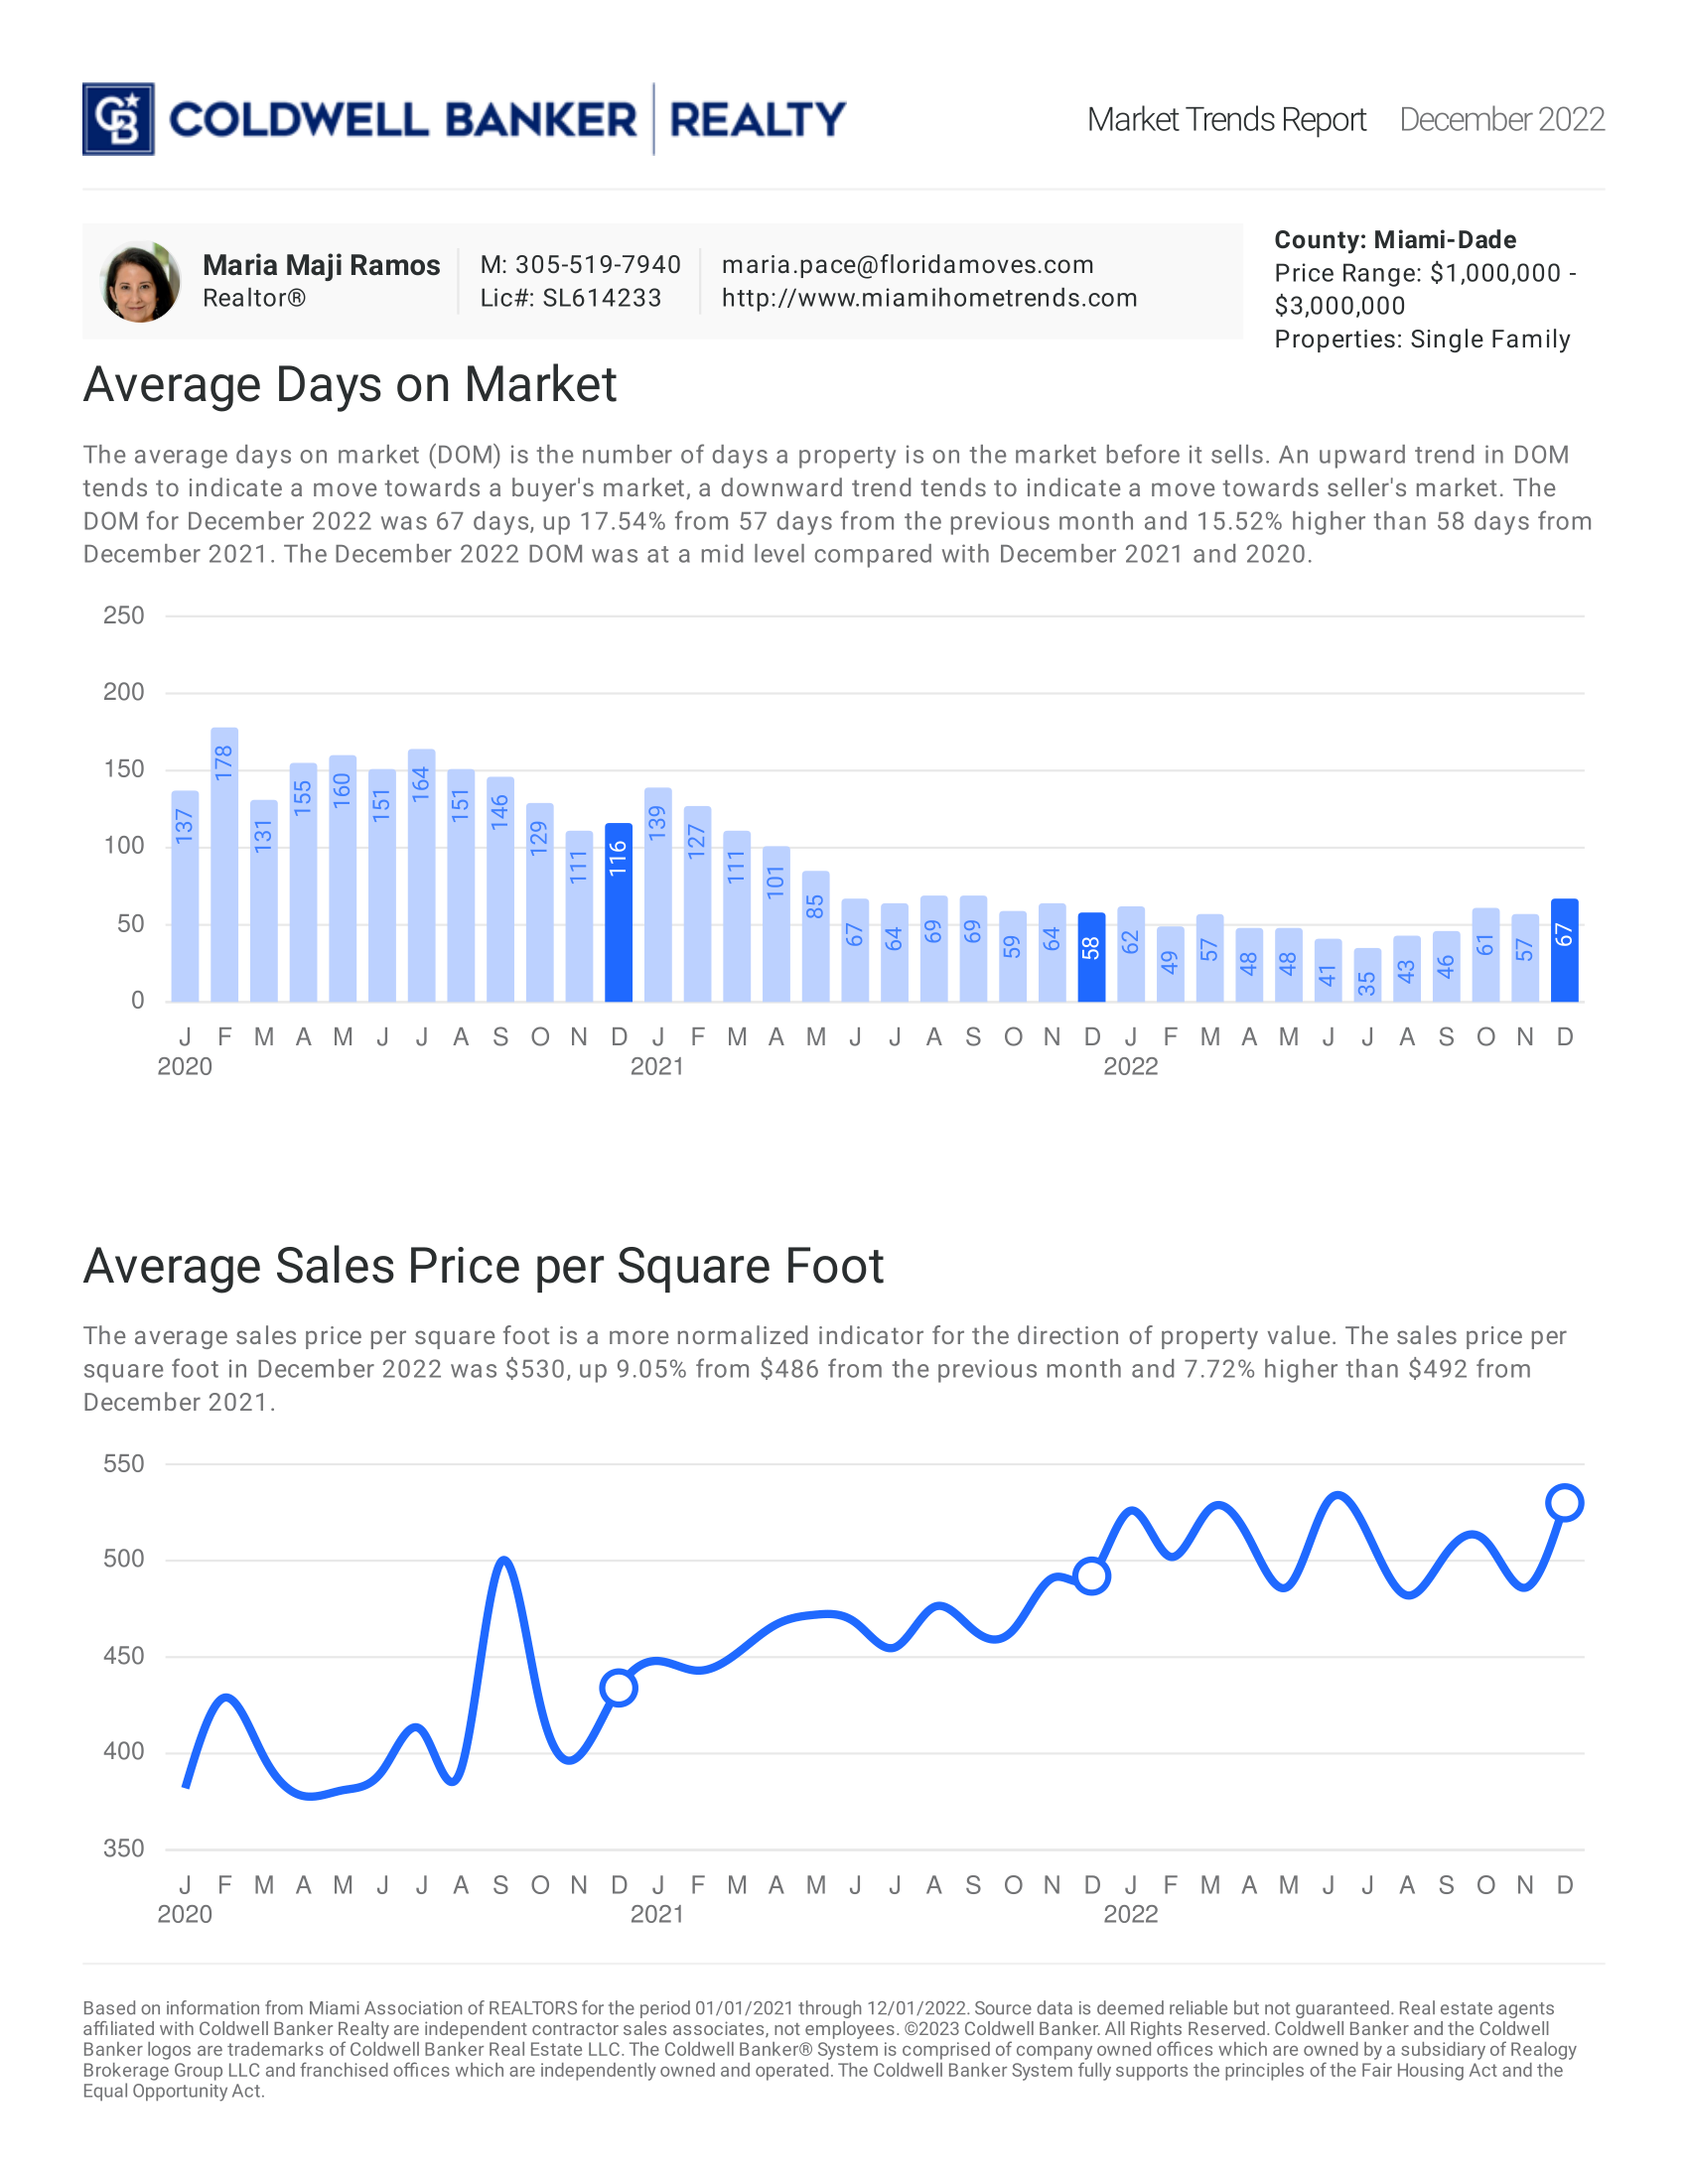
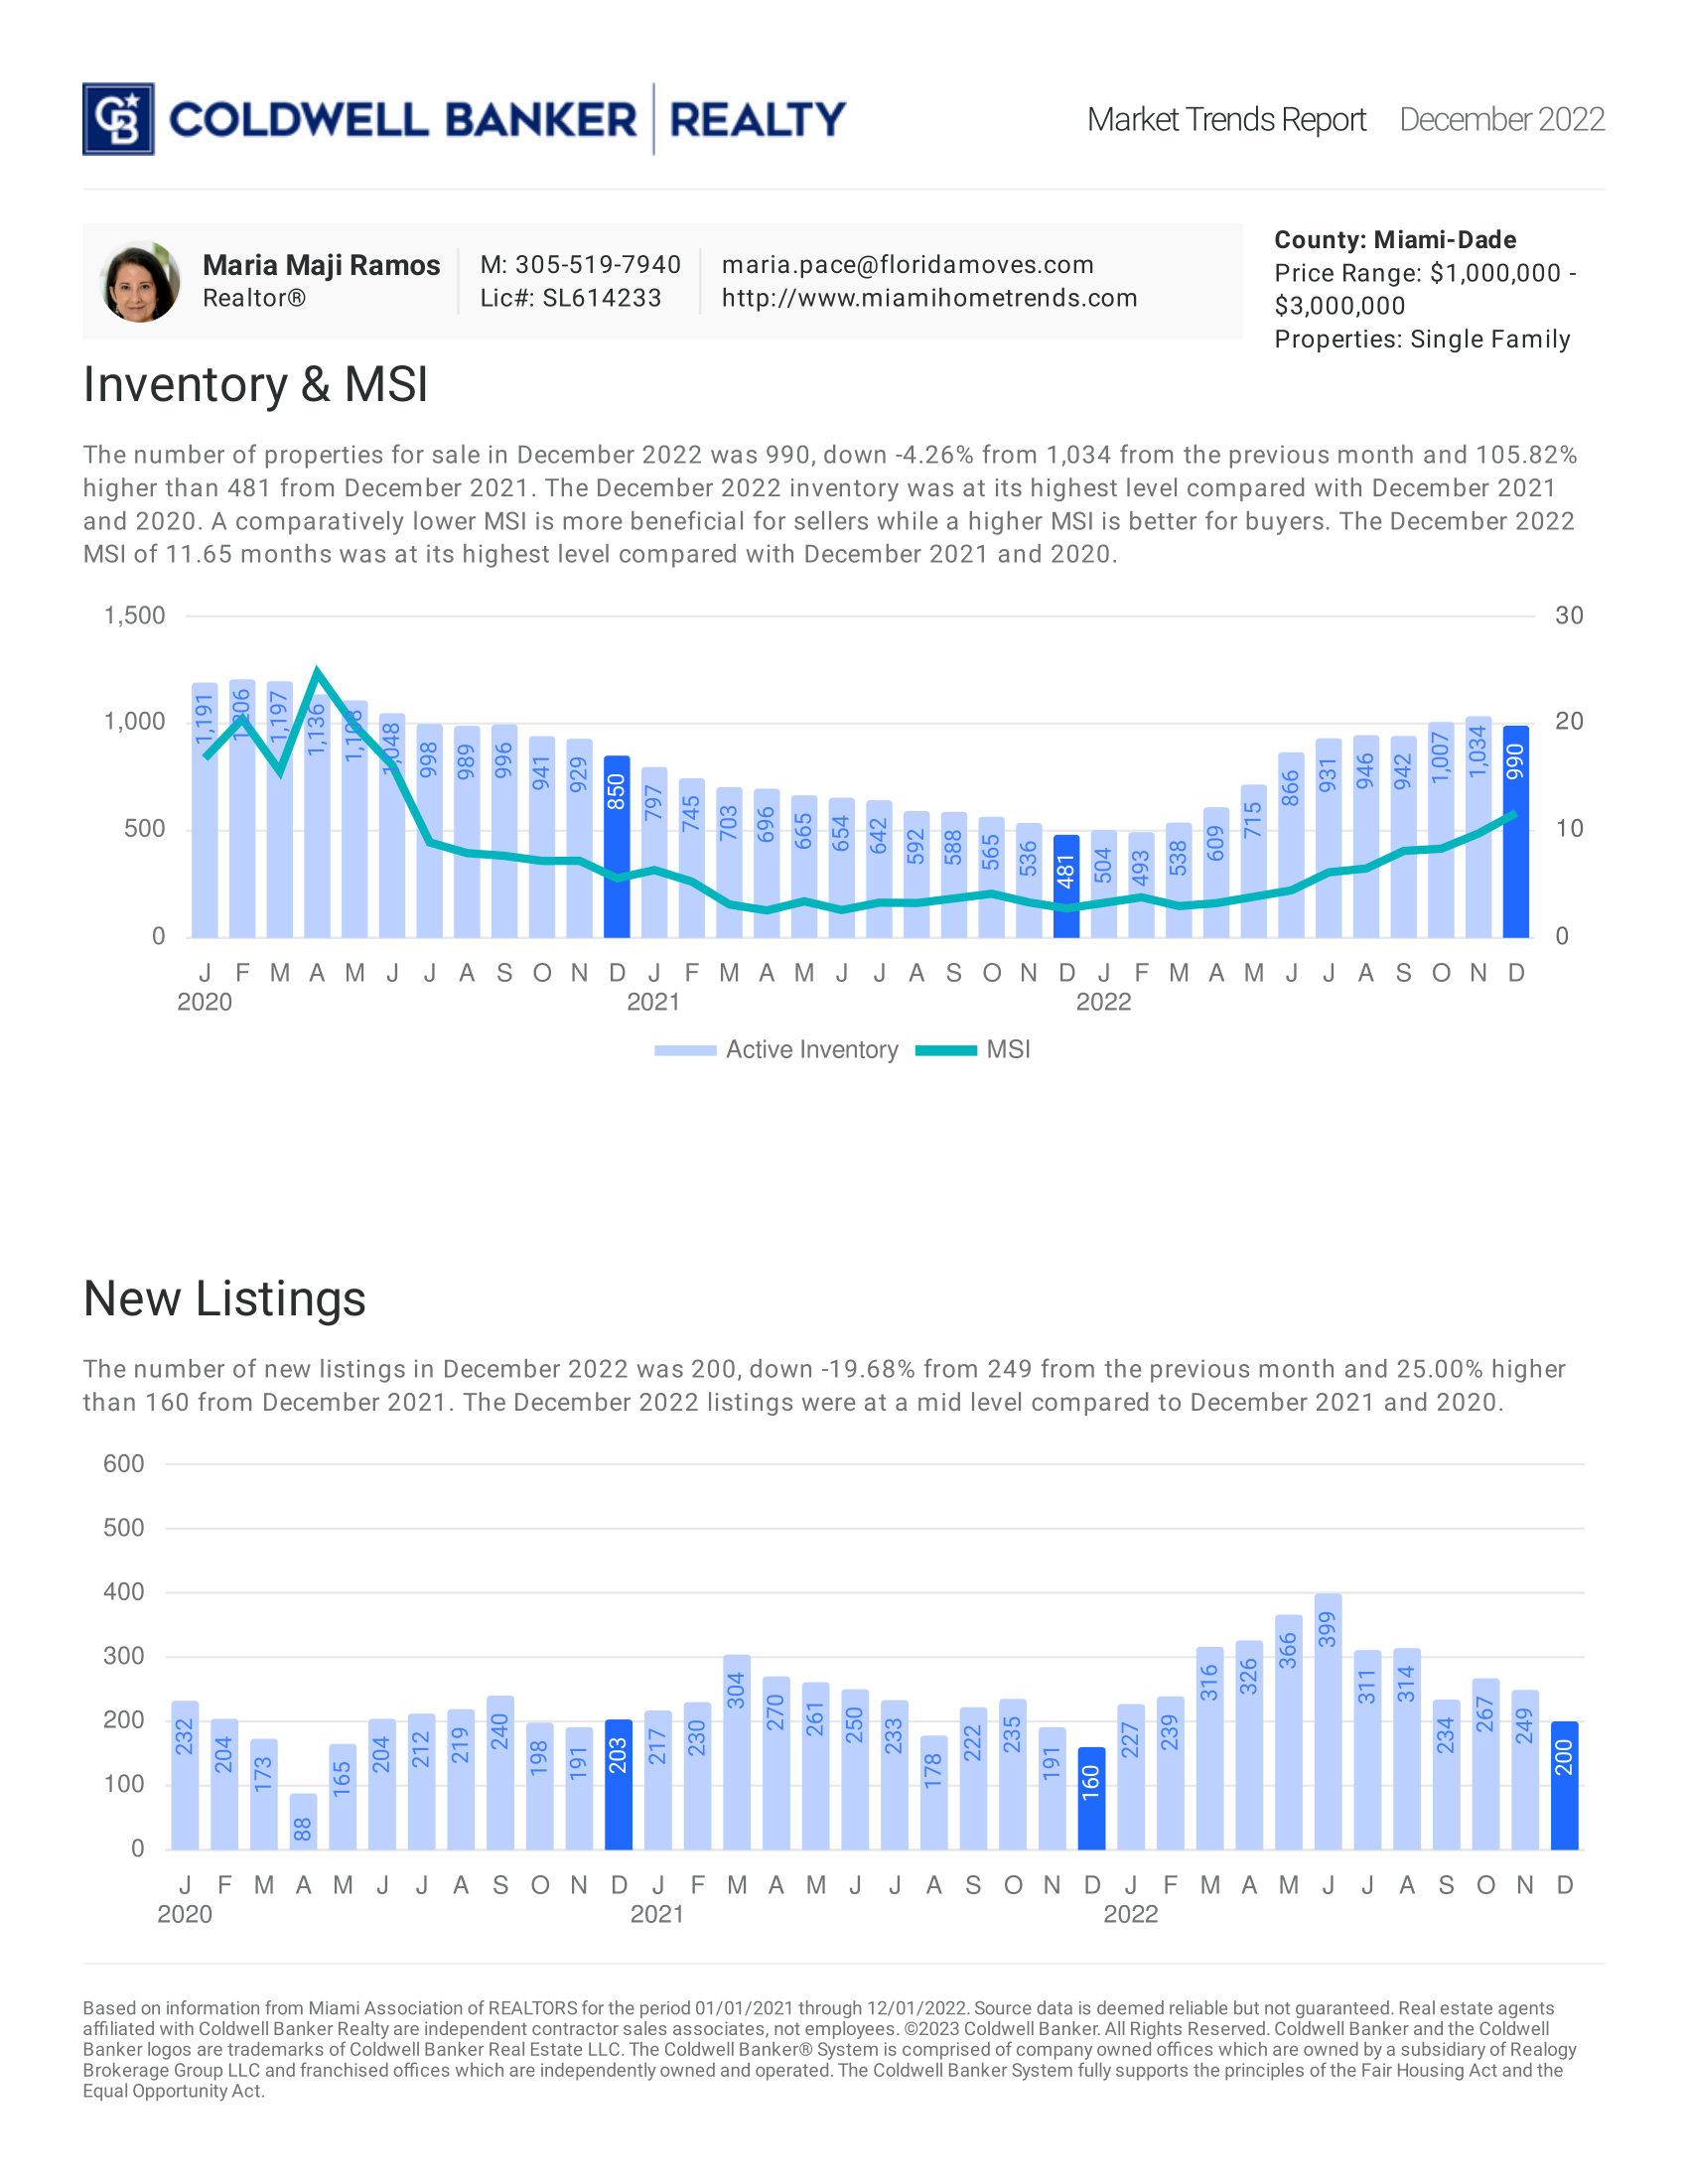
December 2022: Single Family

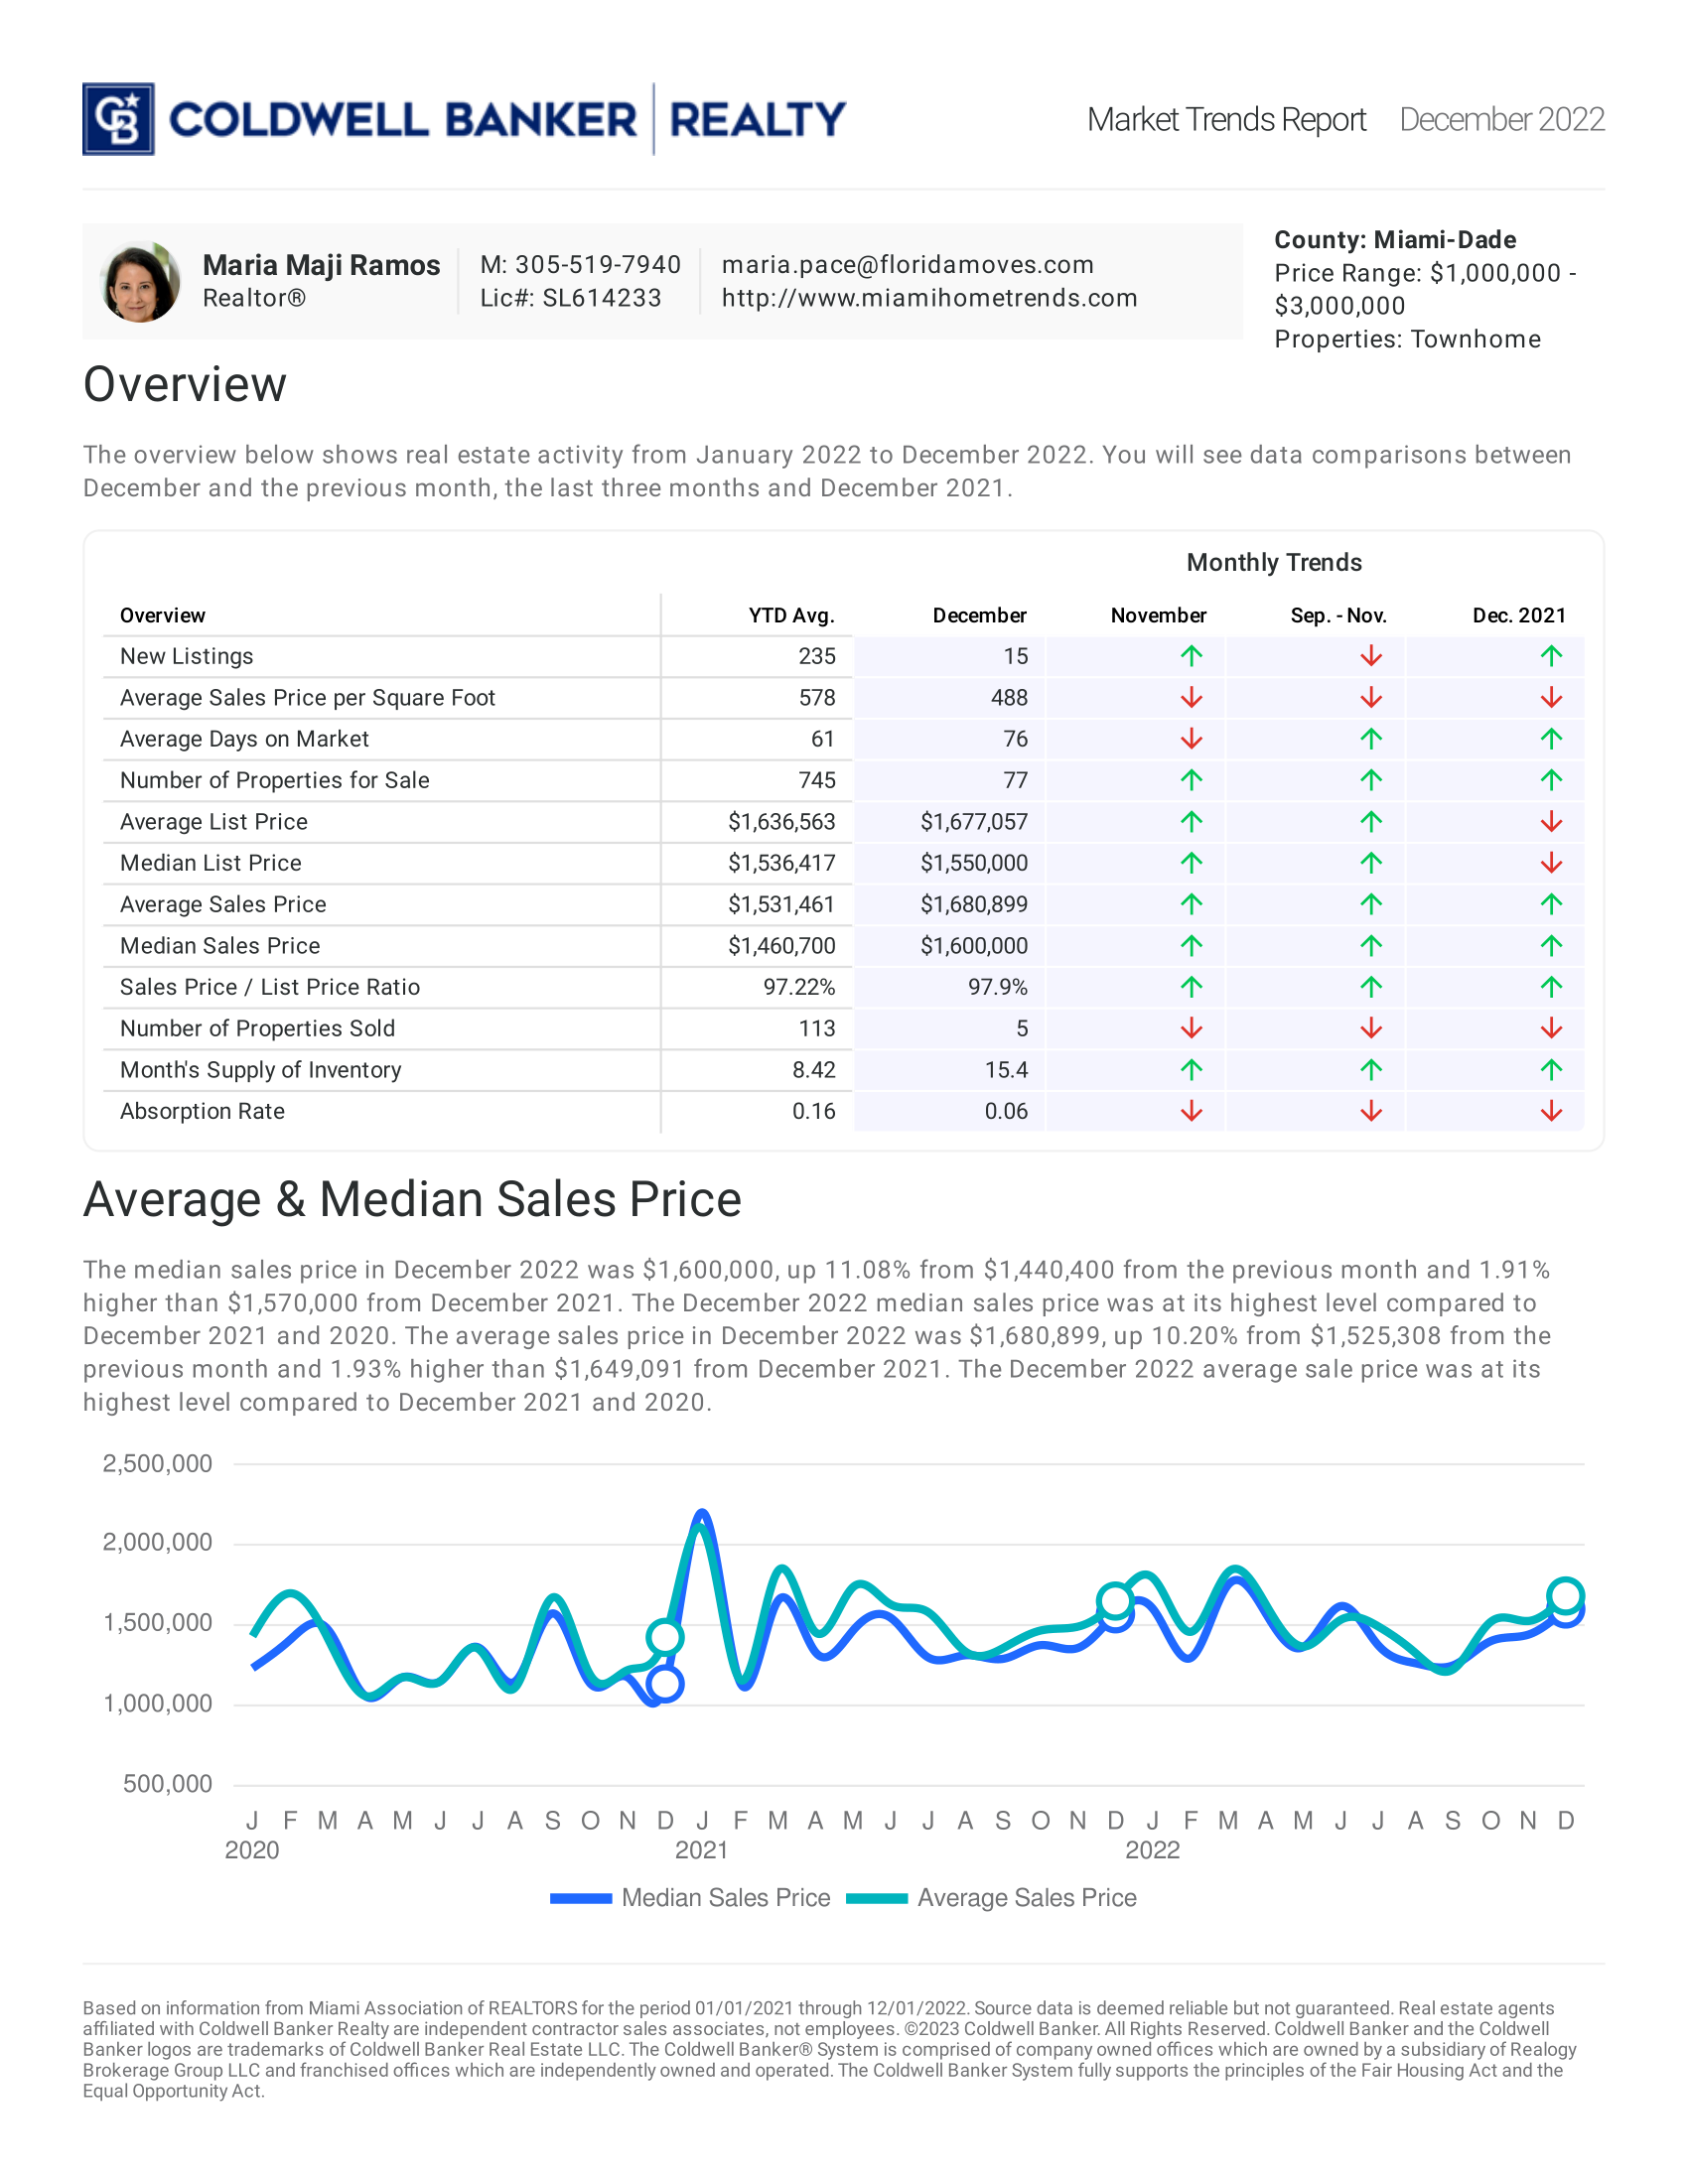
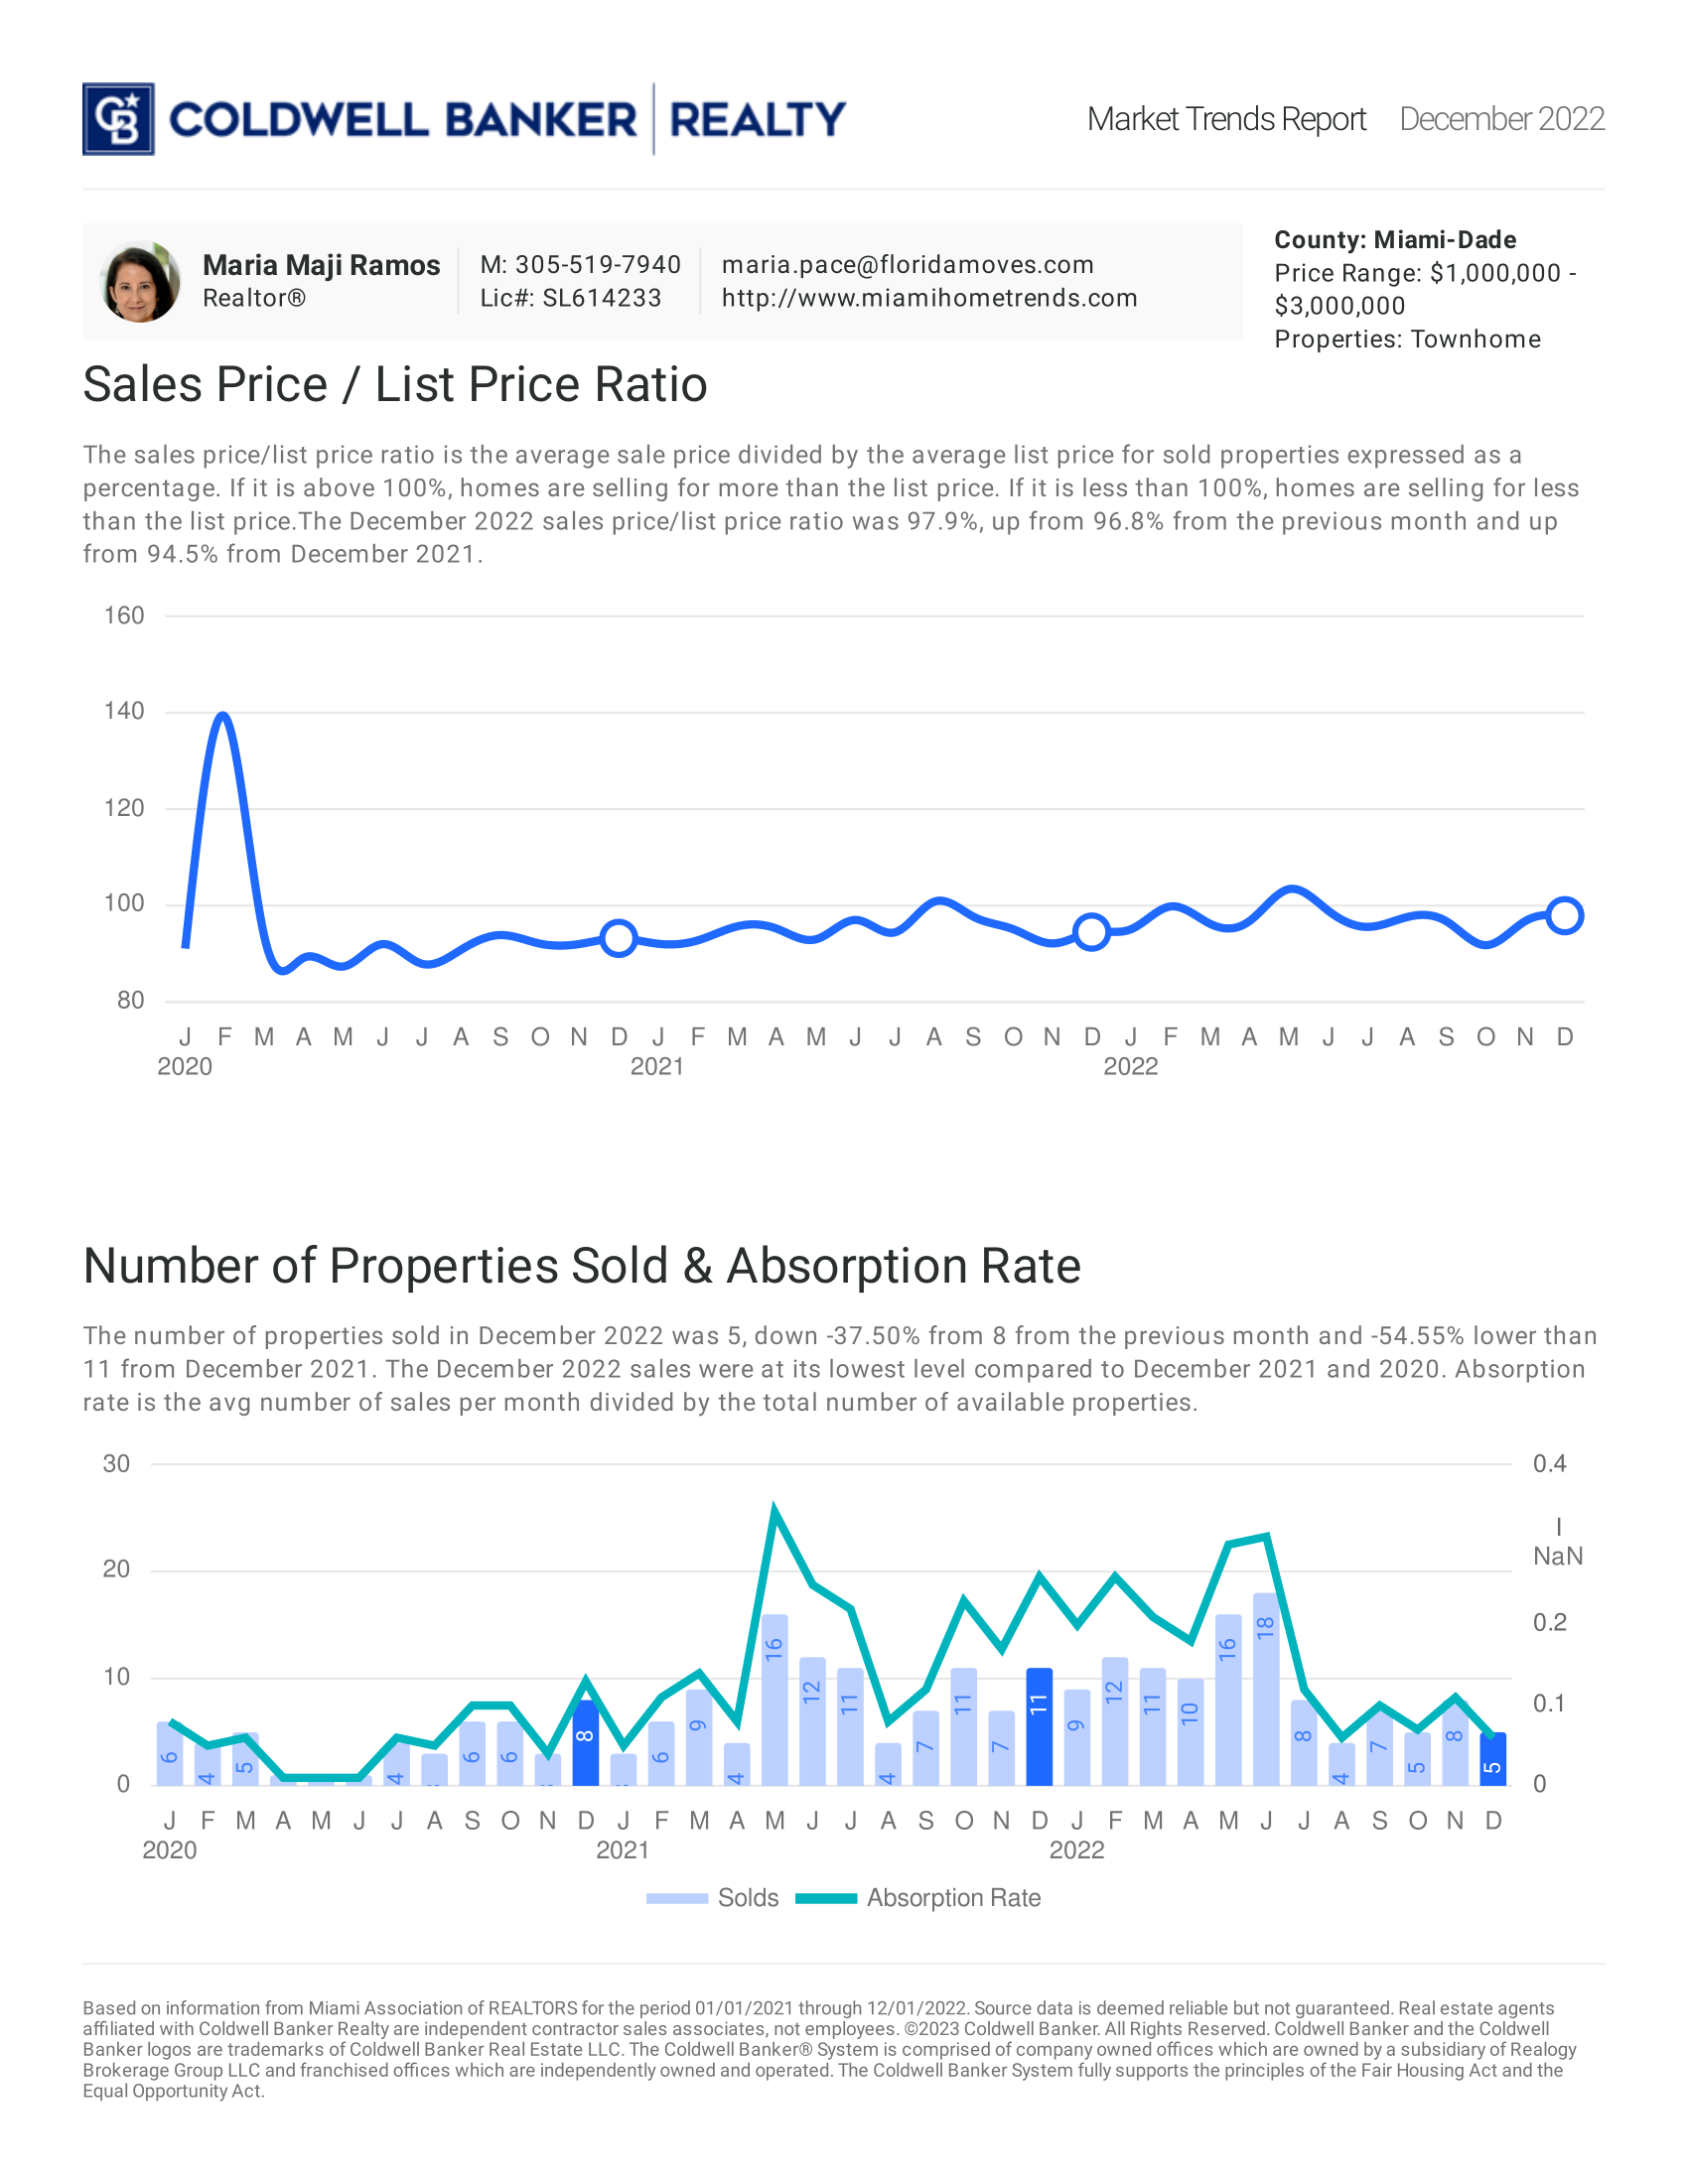
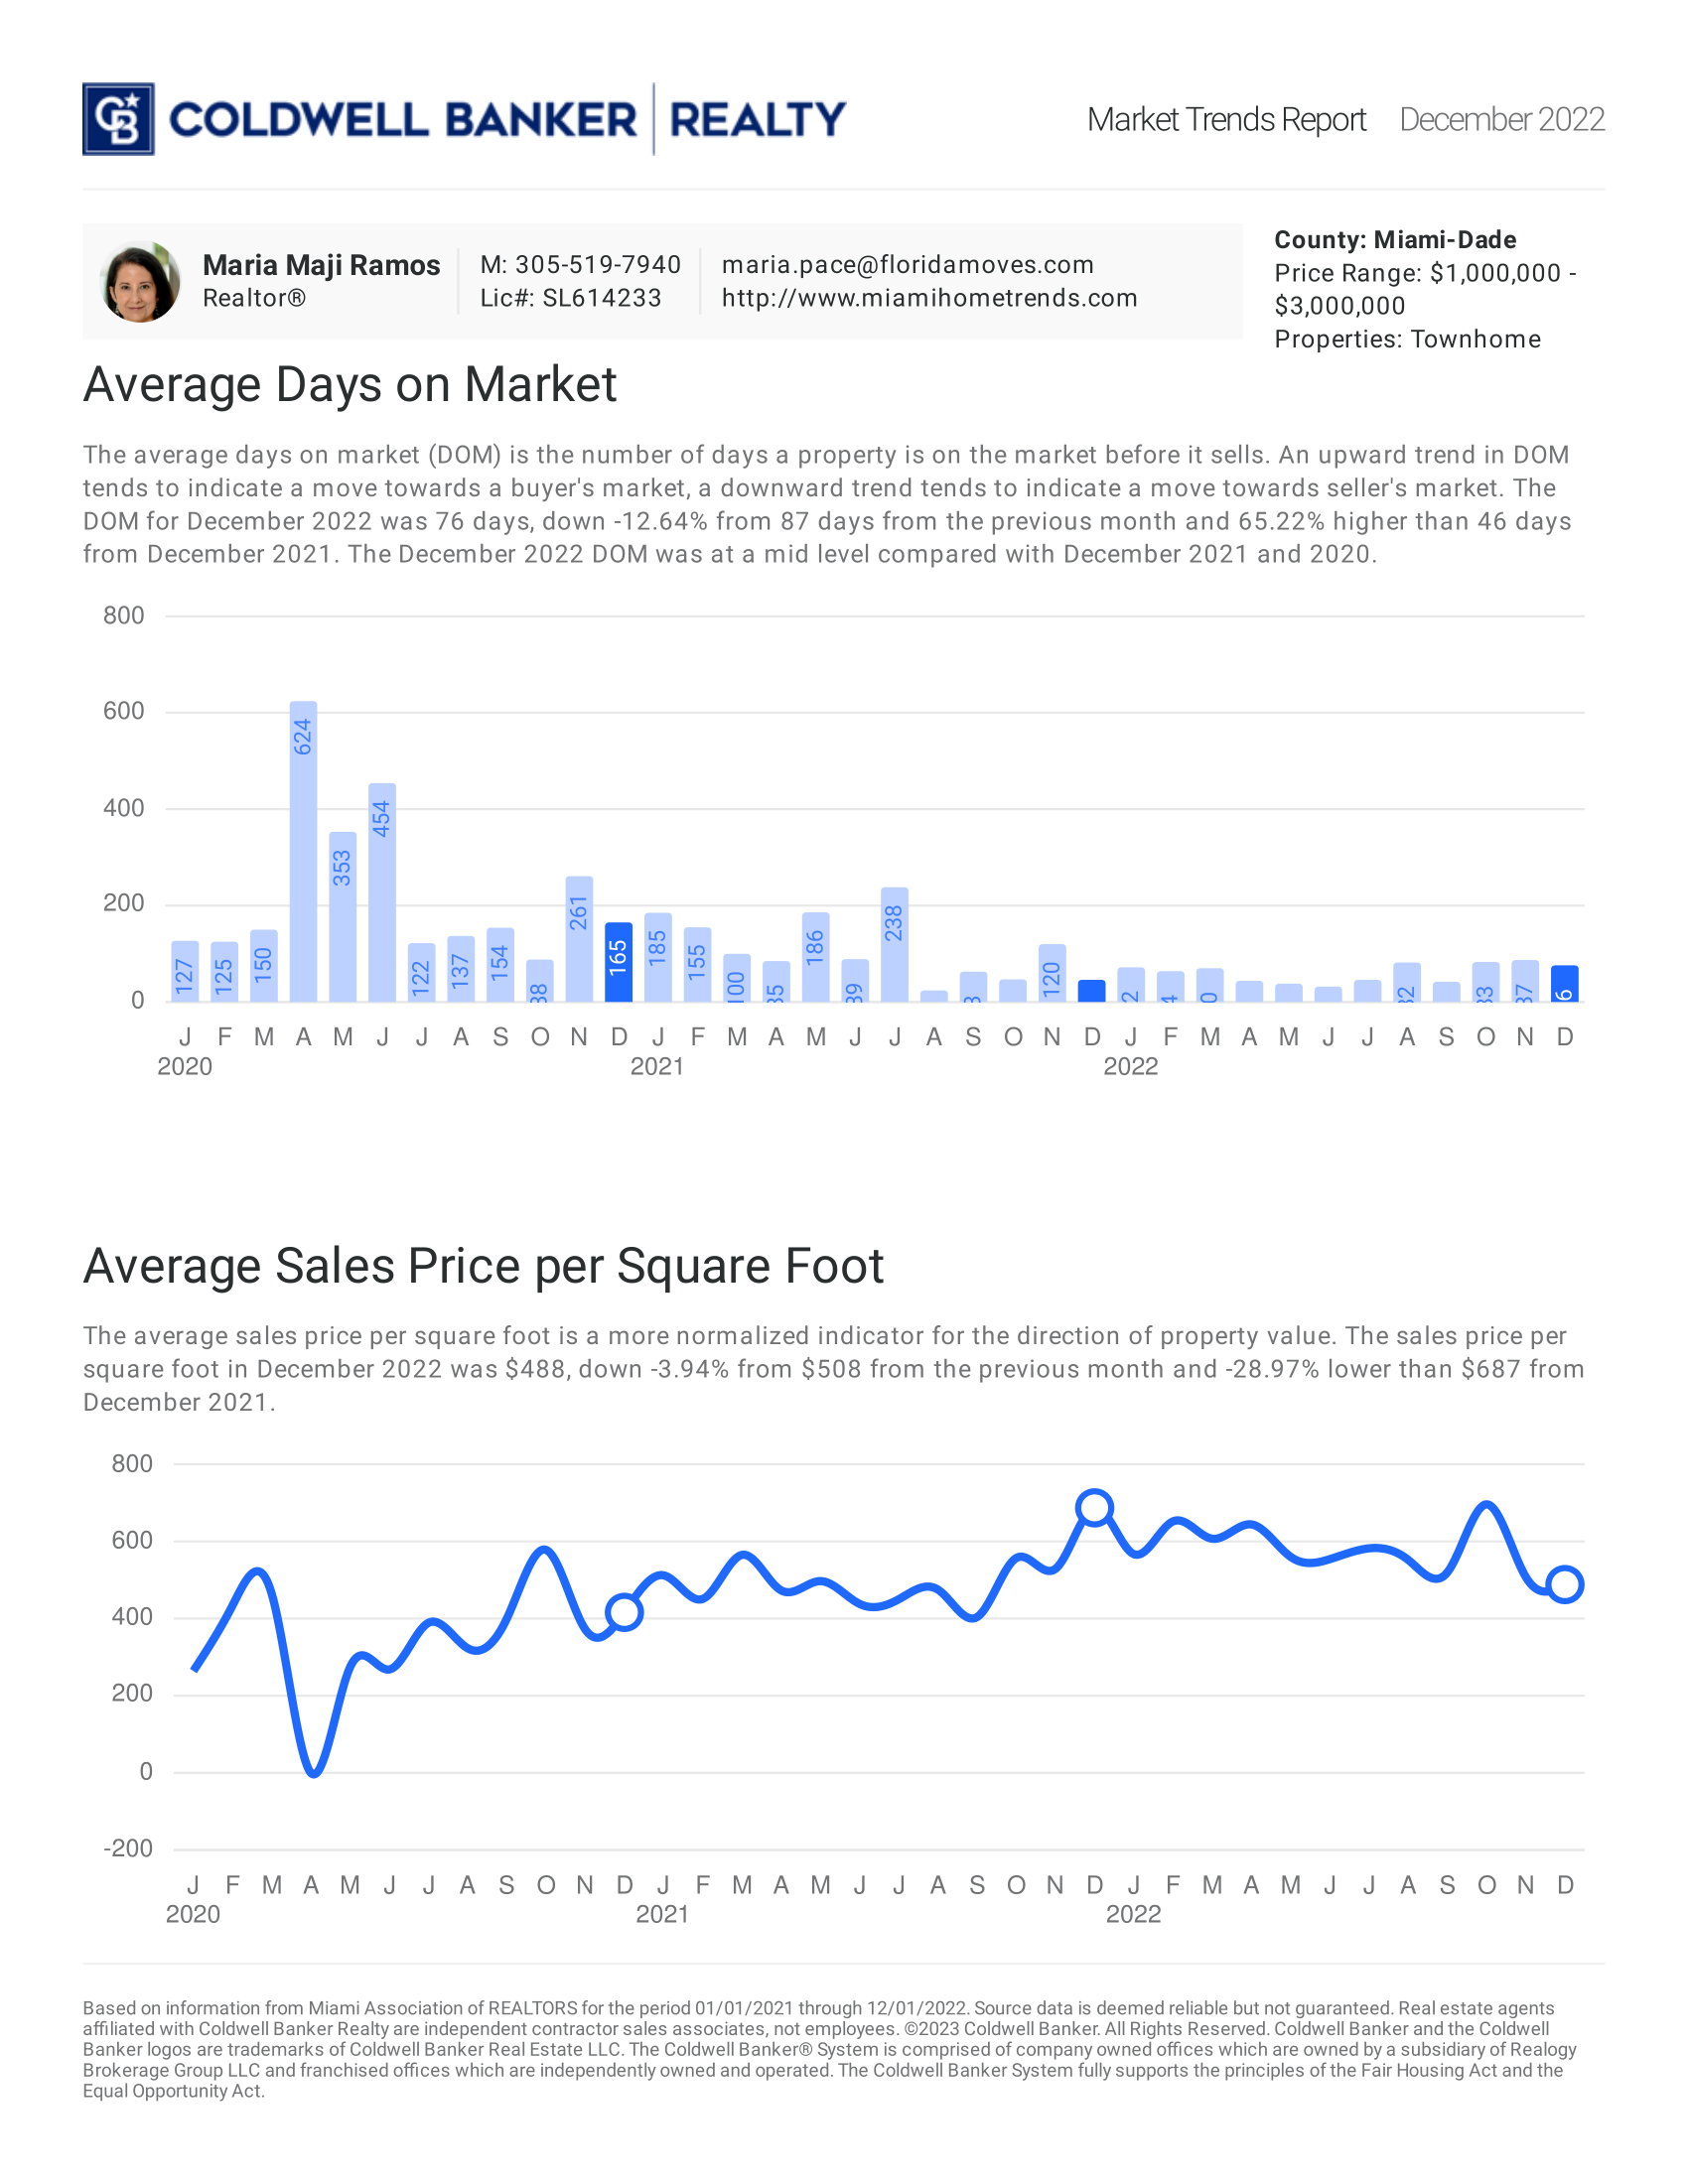
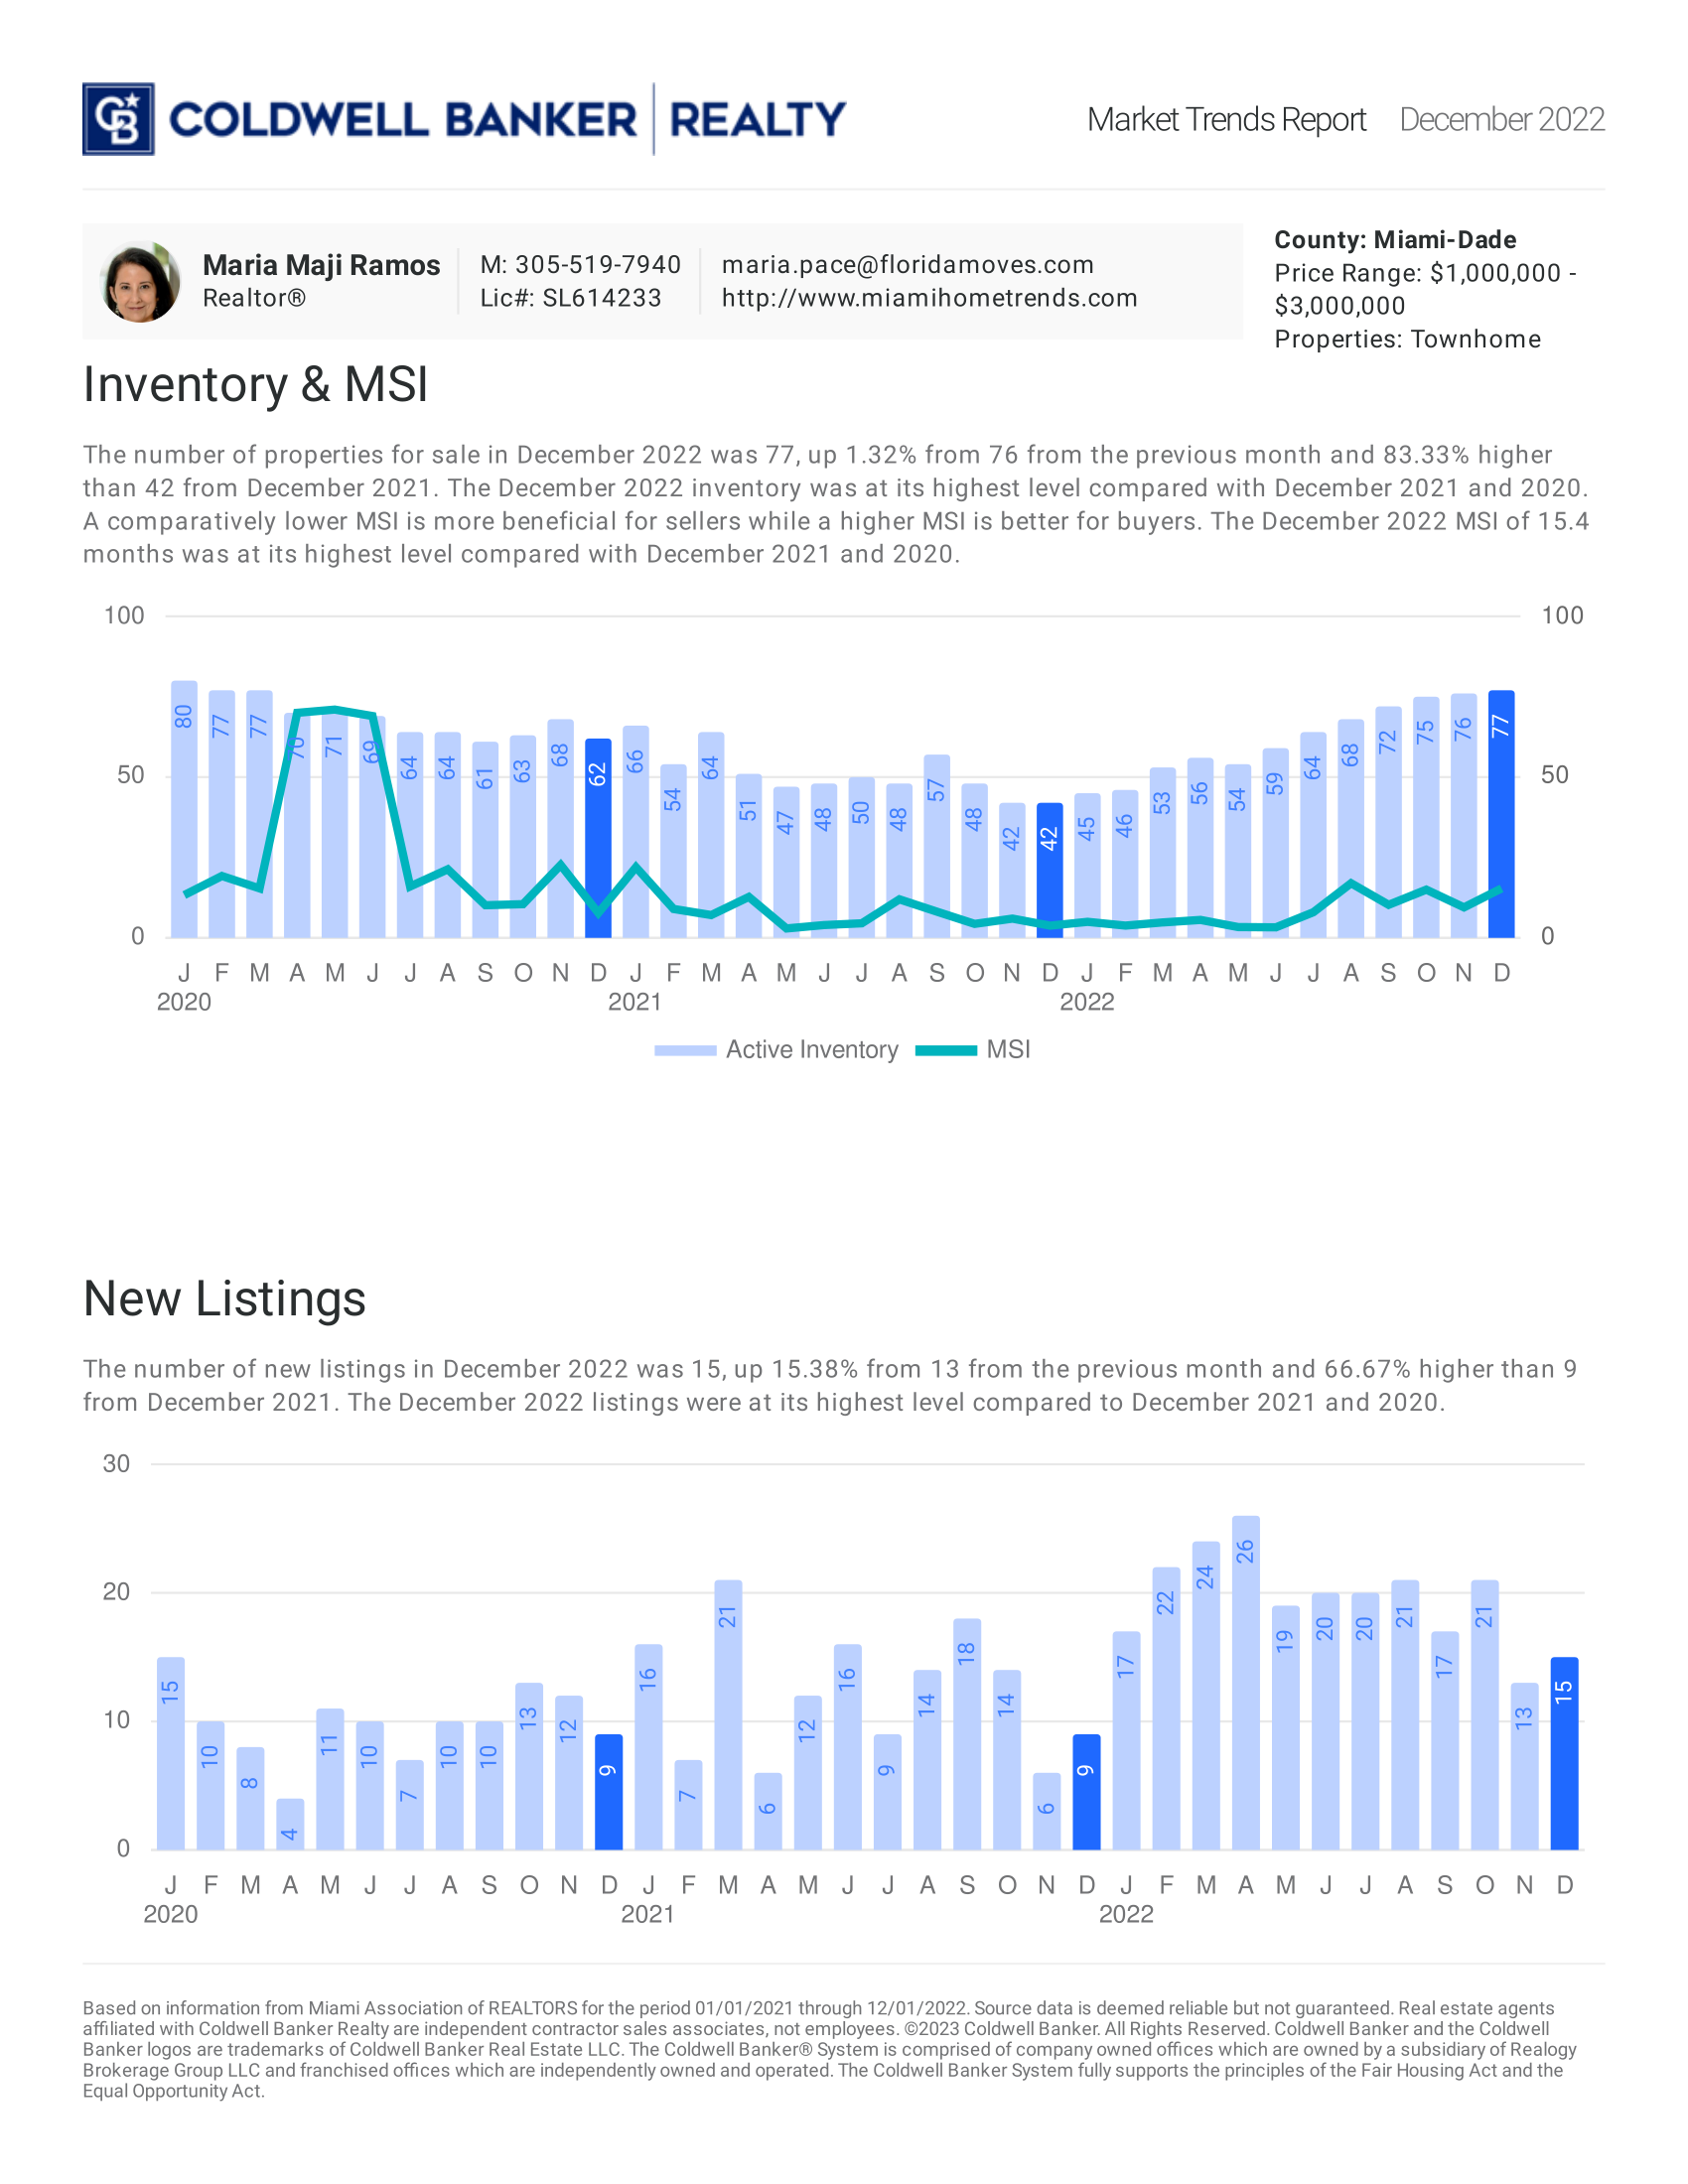
December 2022: Townhome

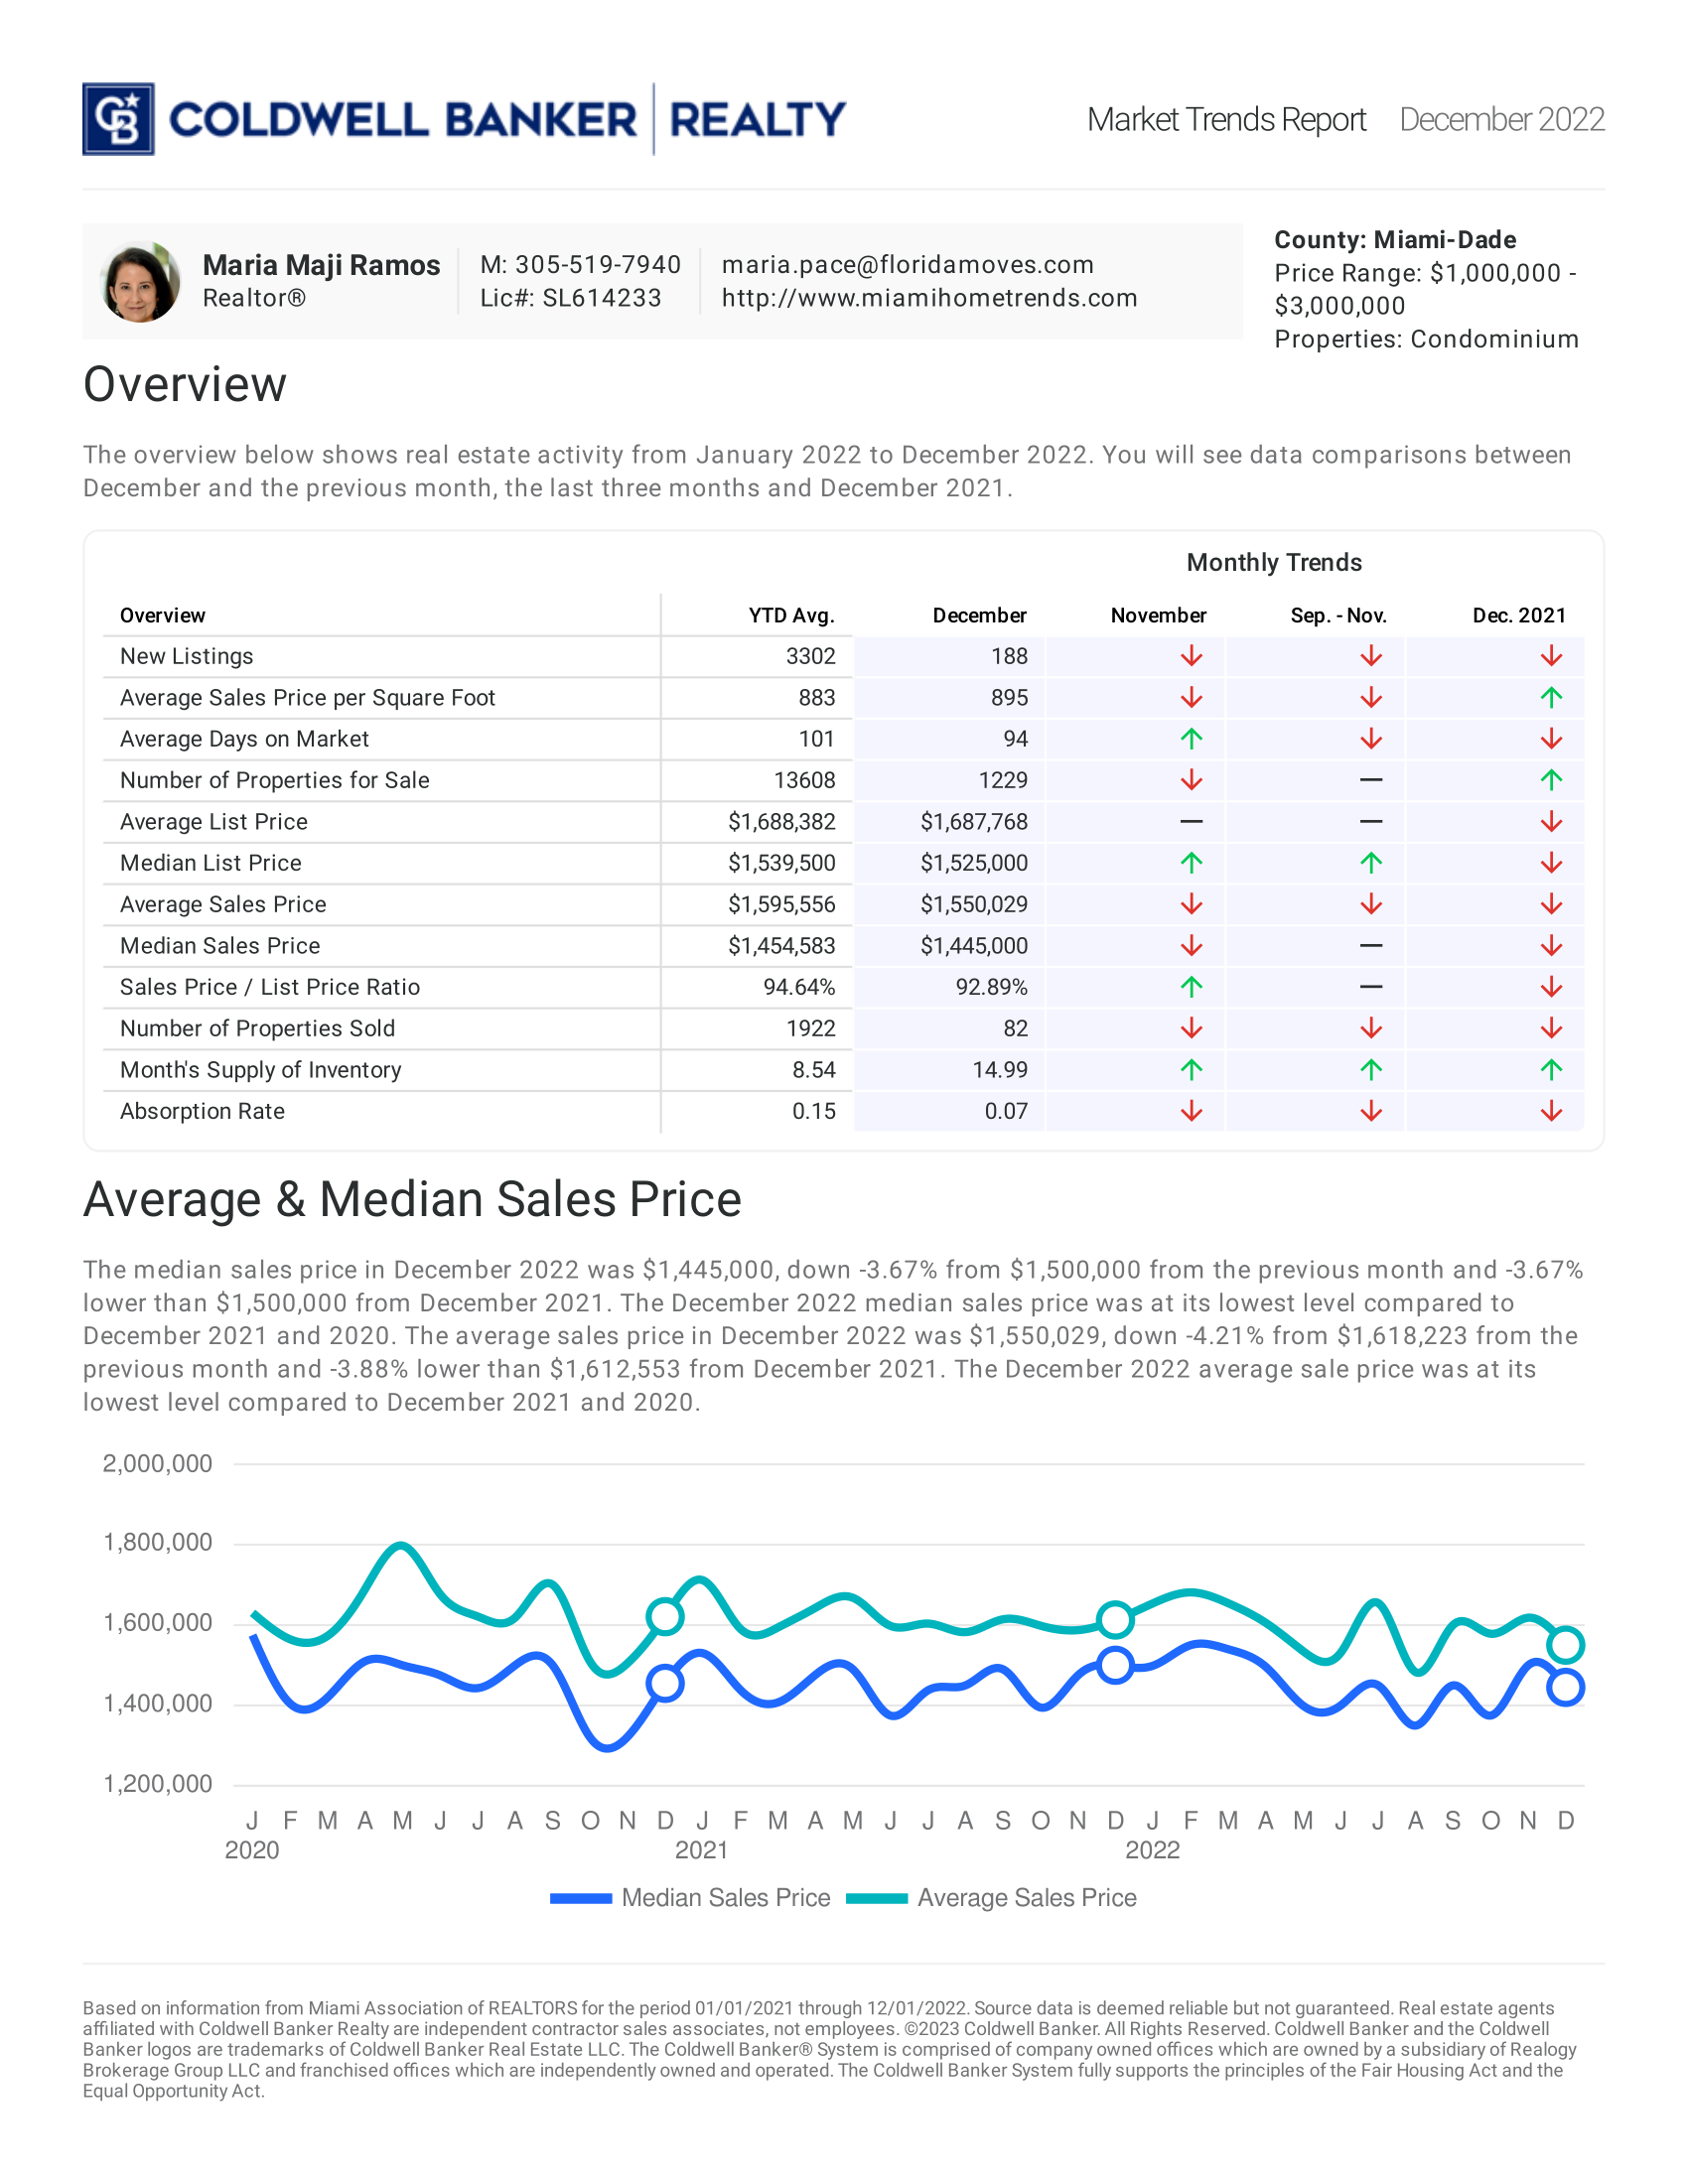
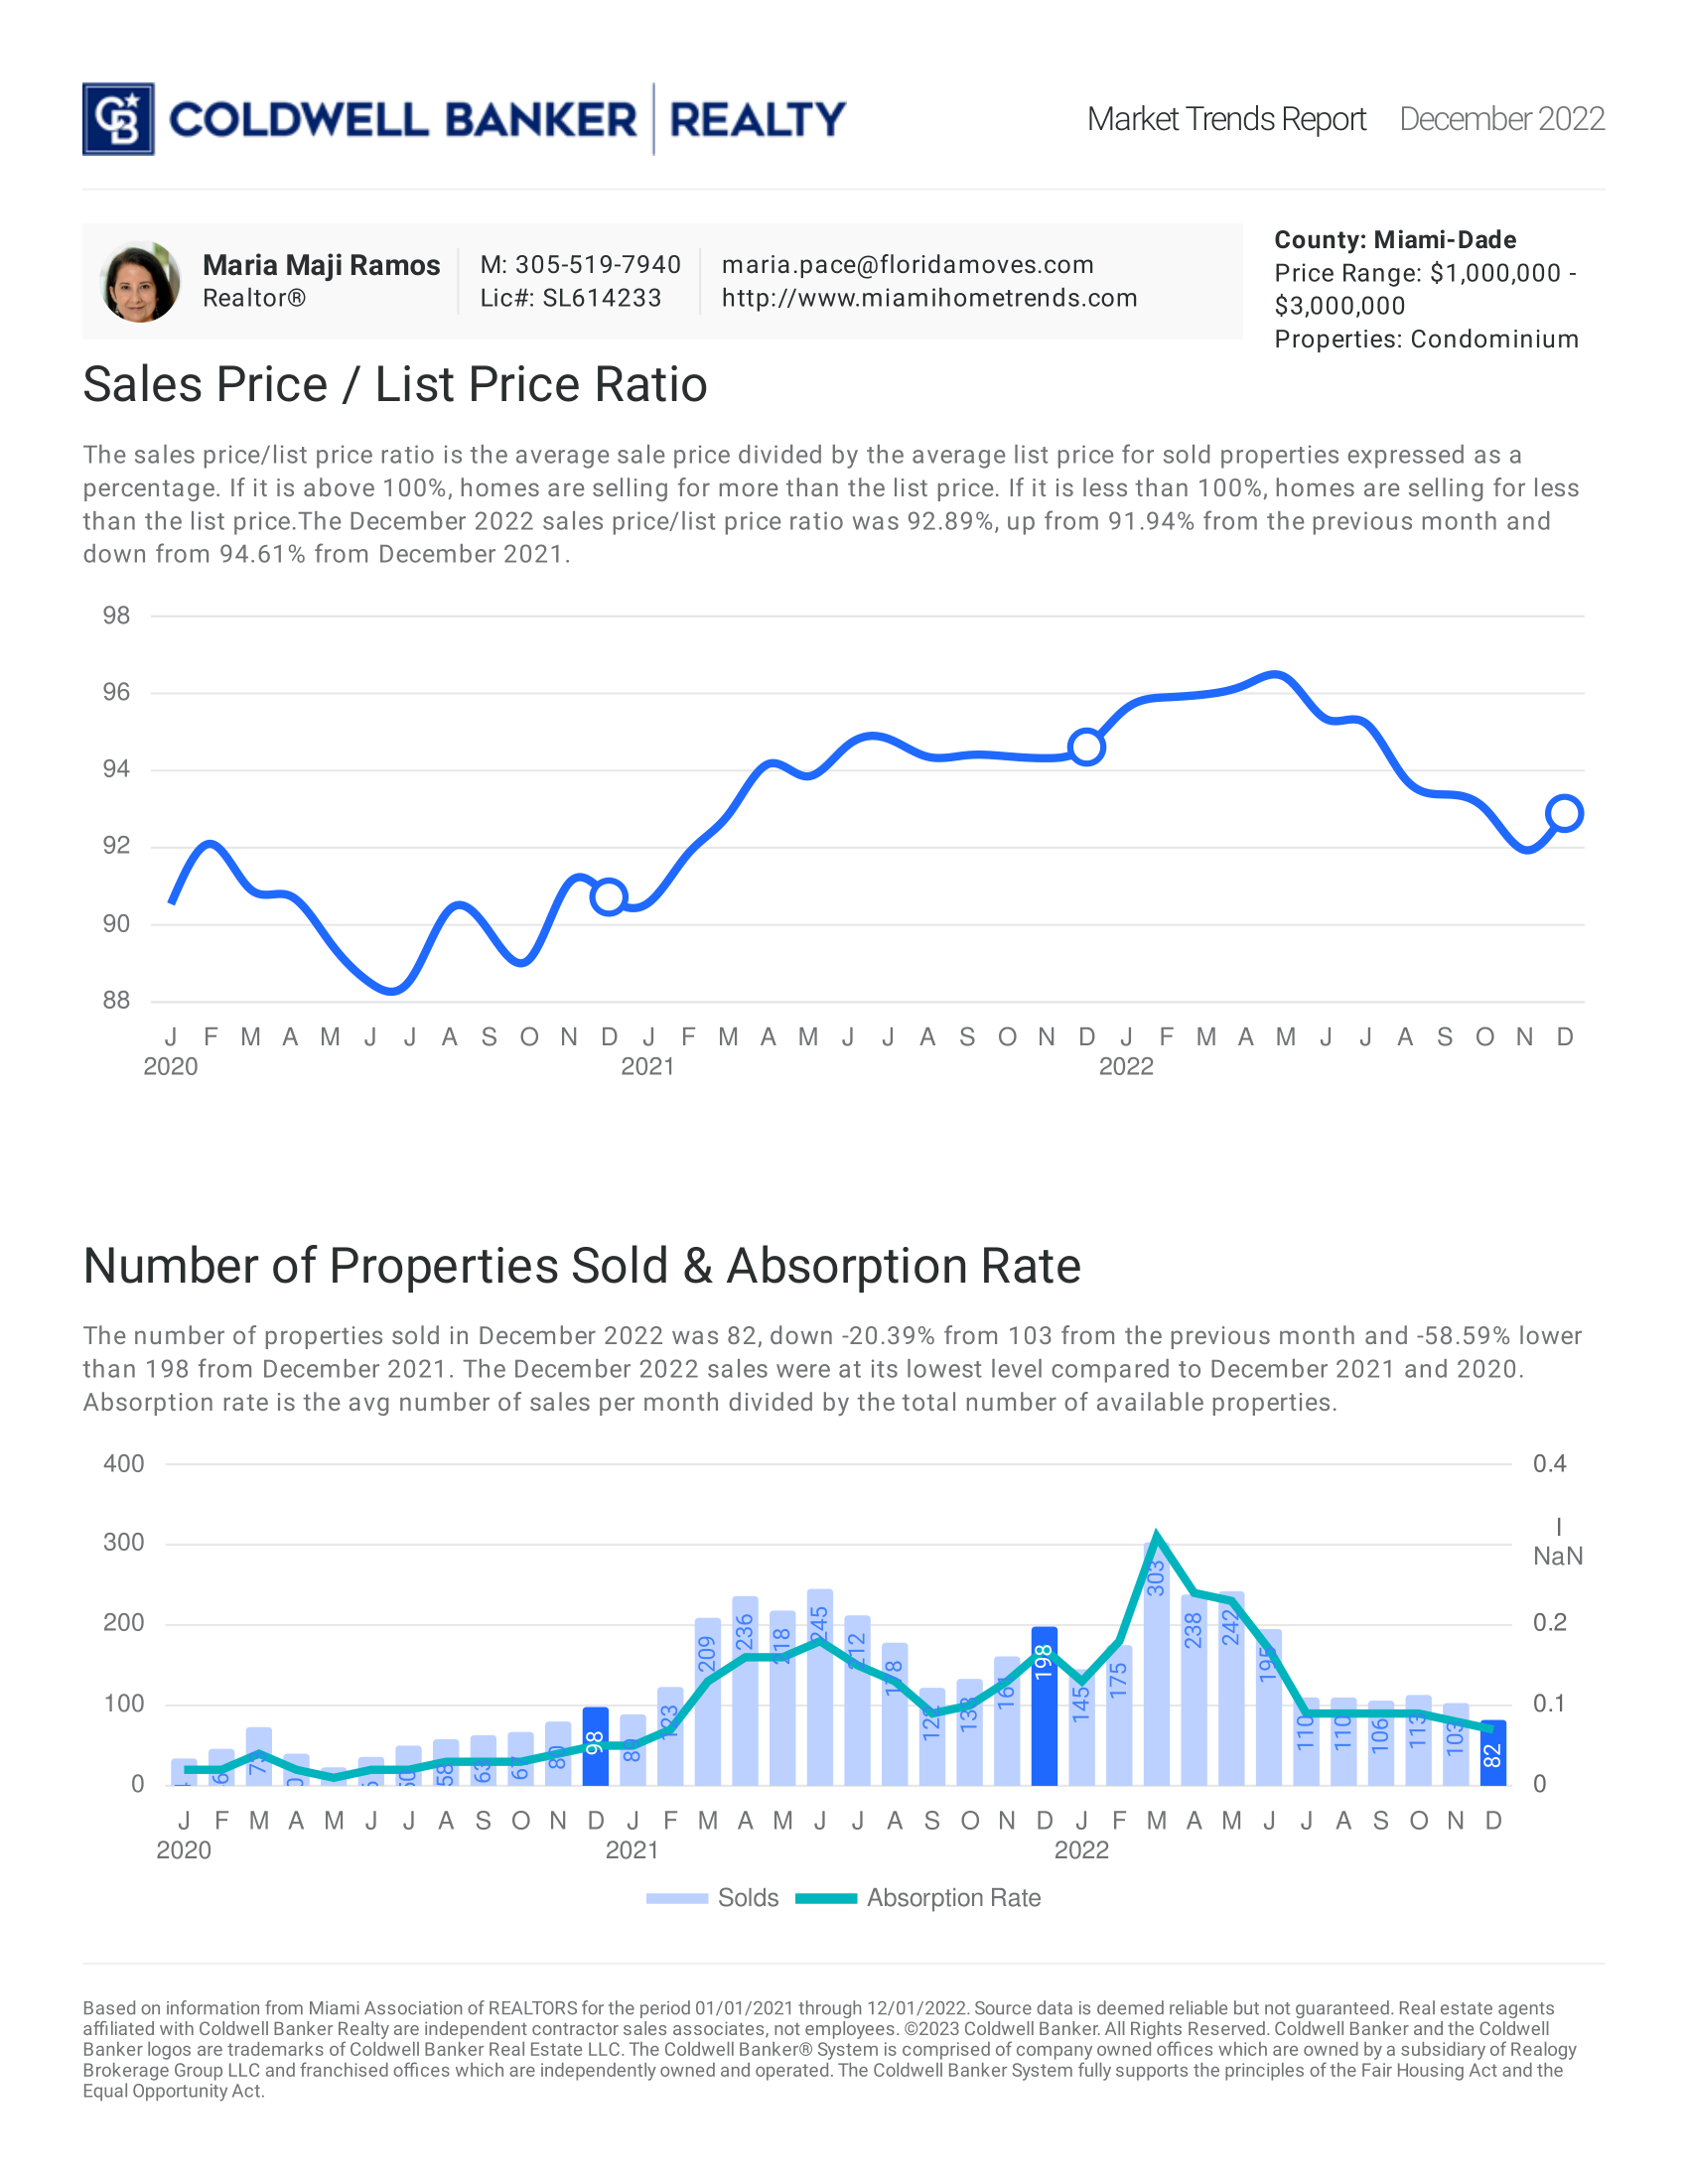
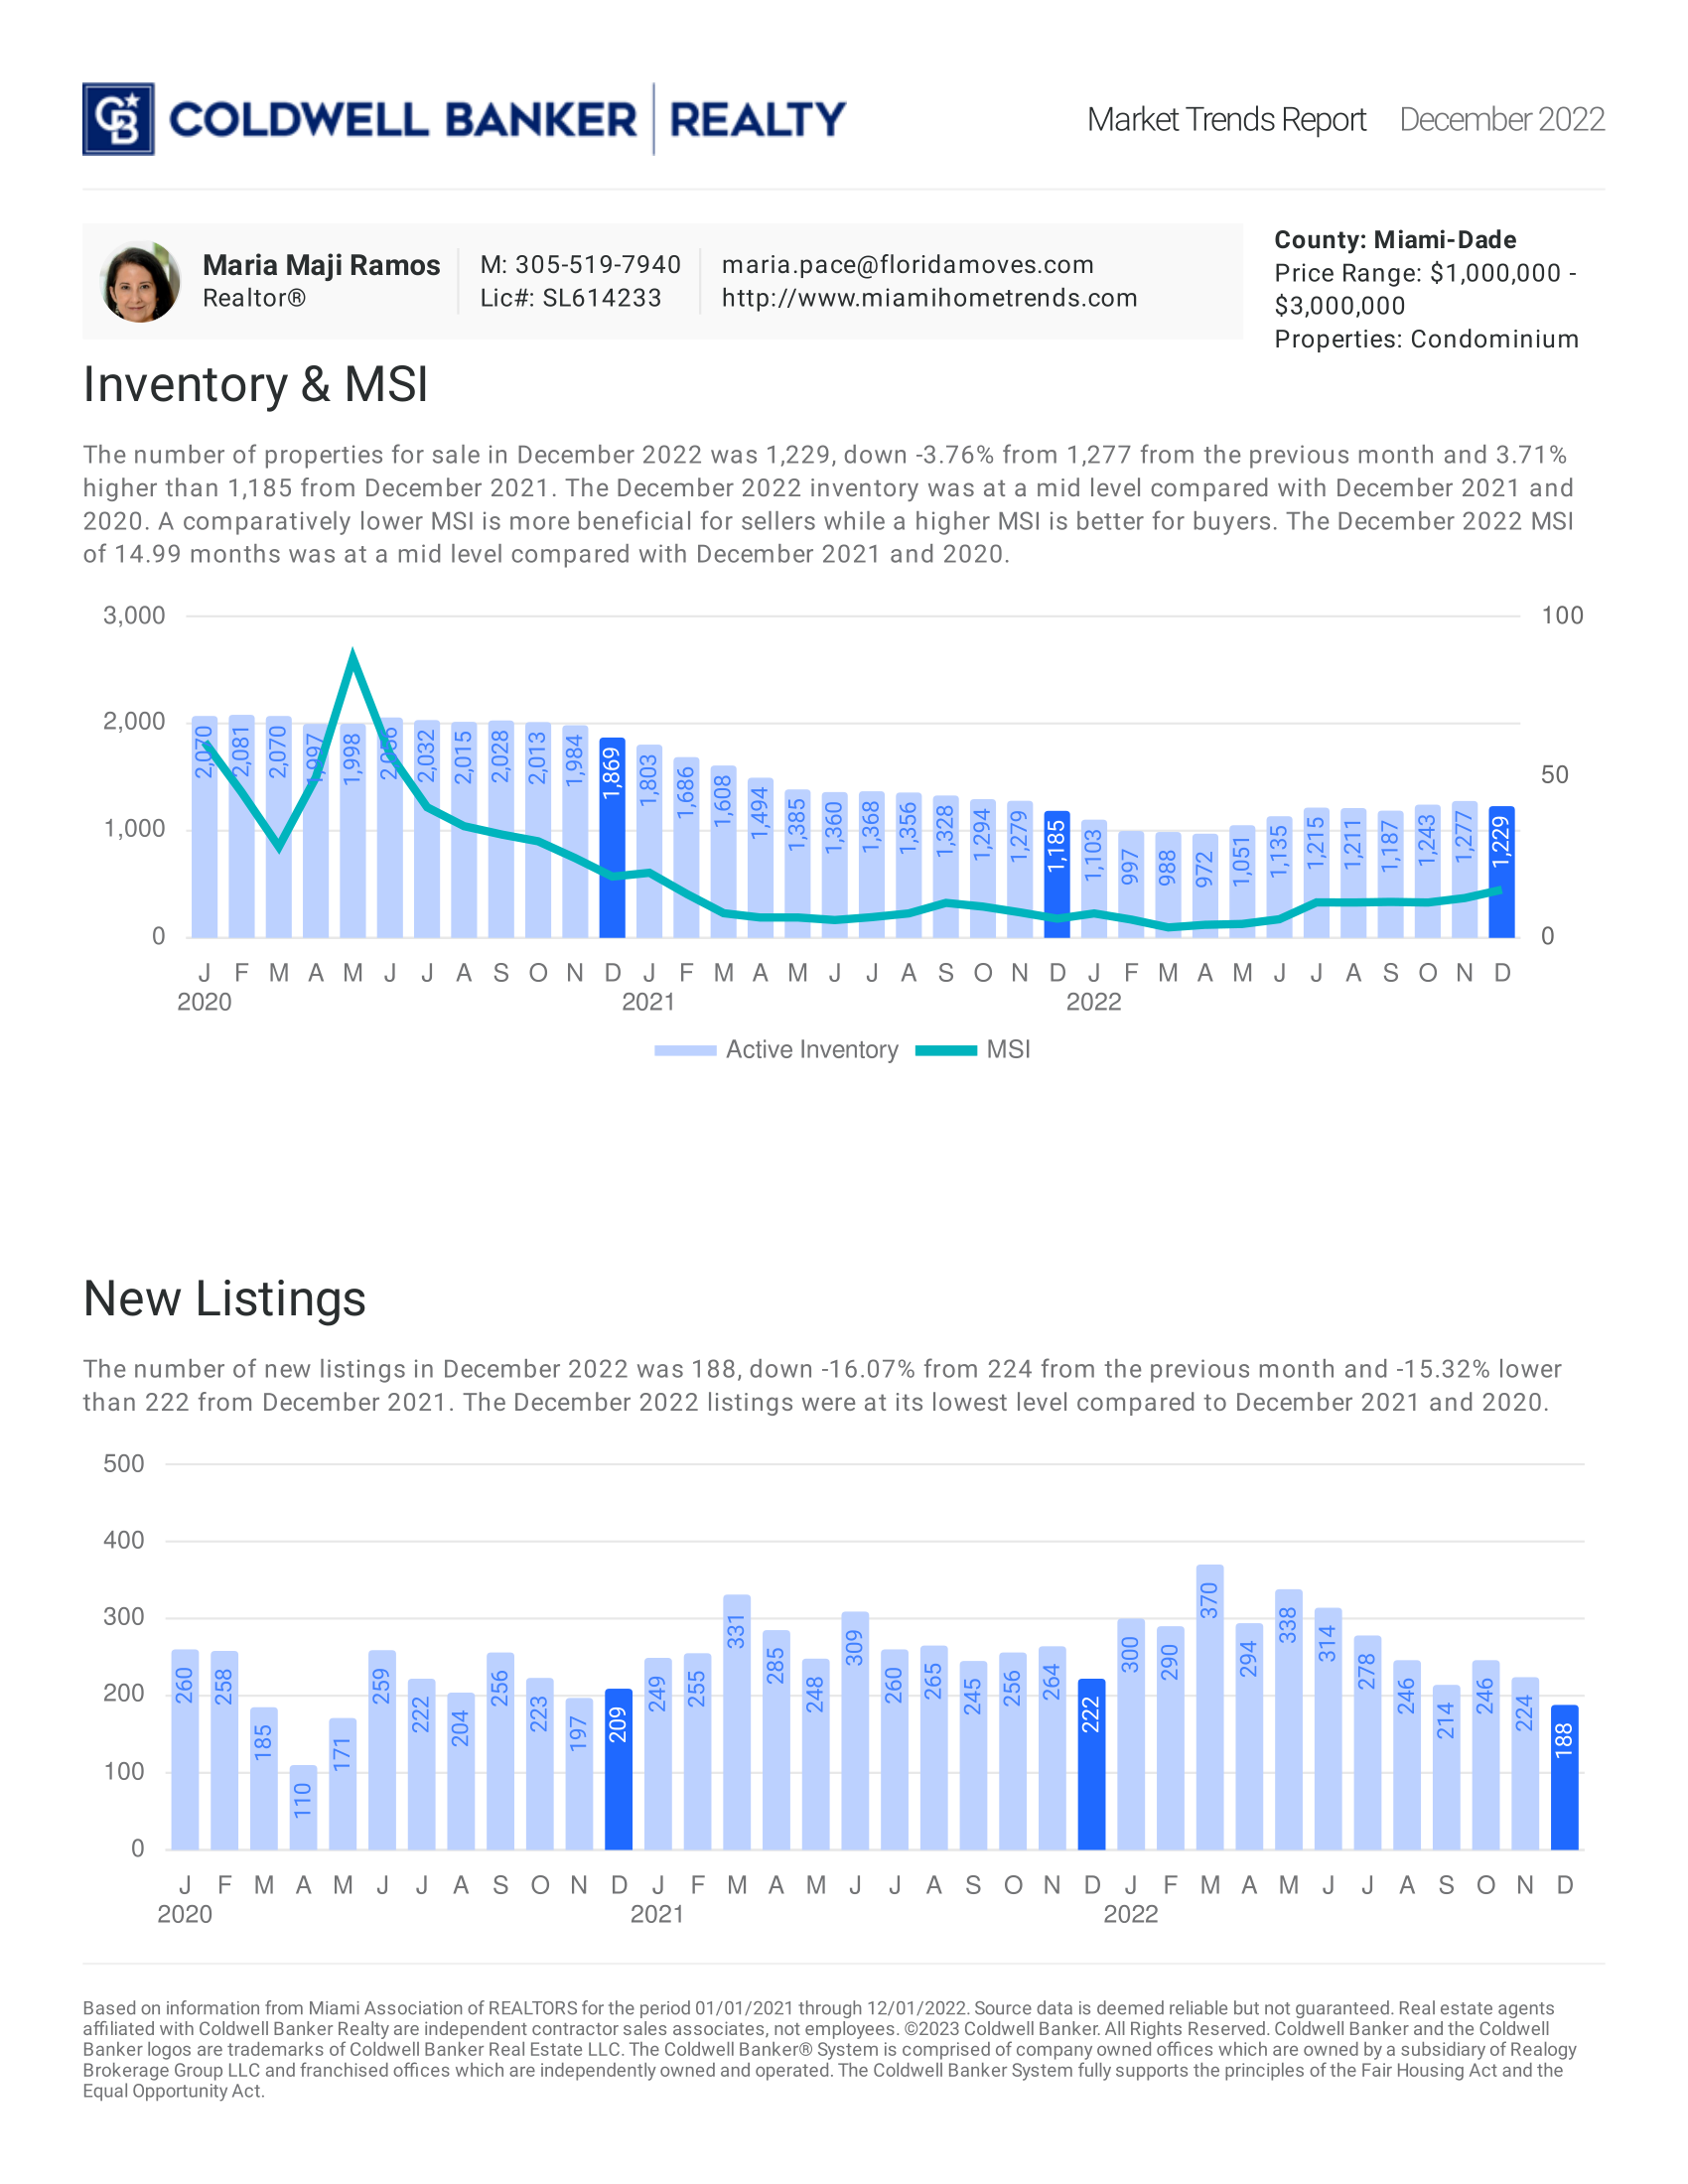
December 2022: Condo


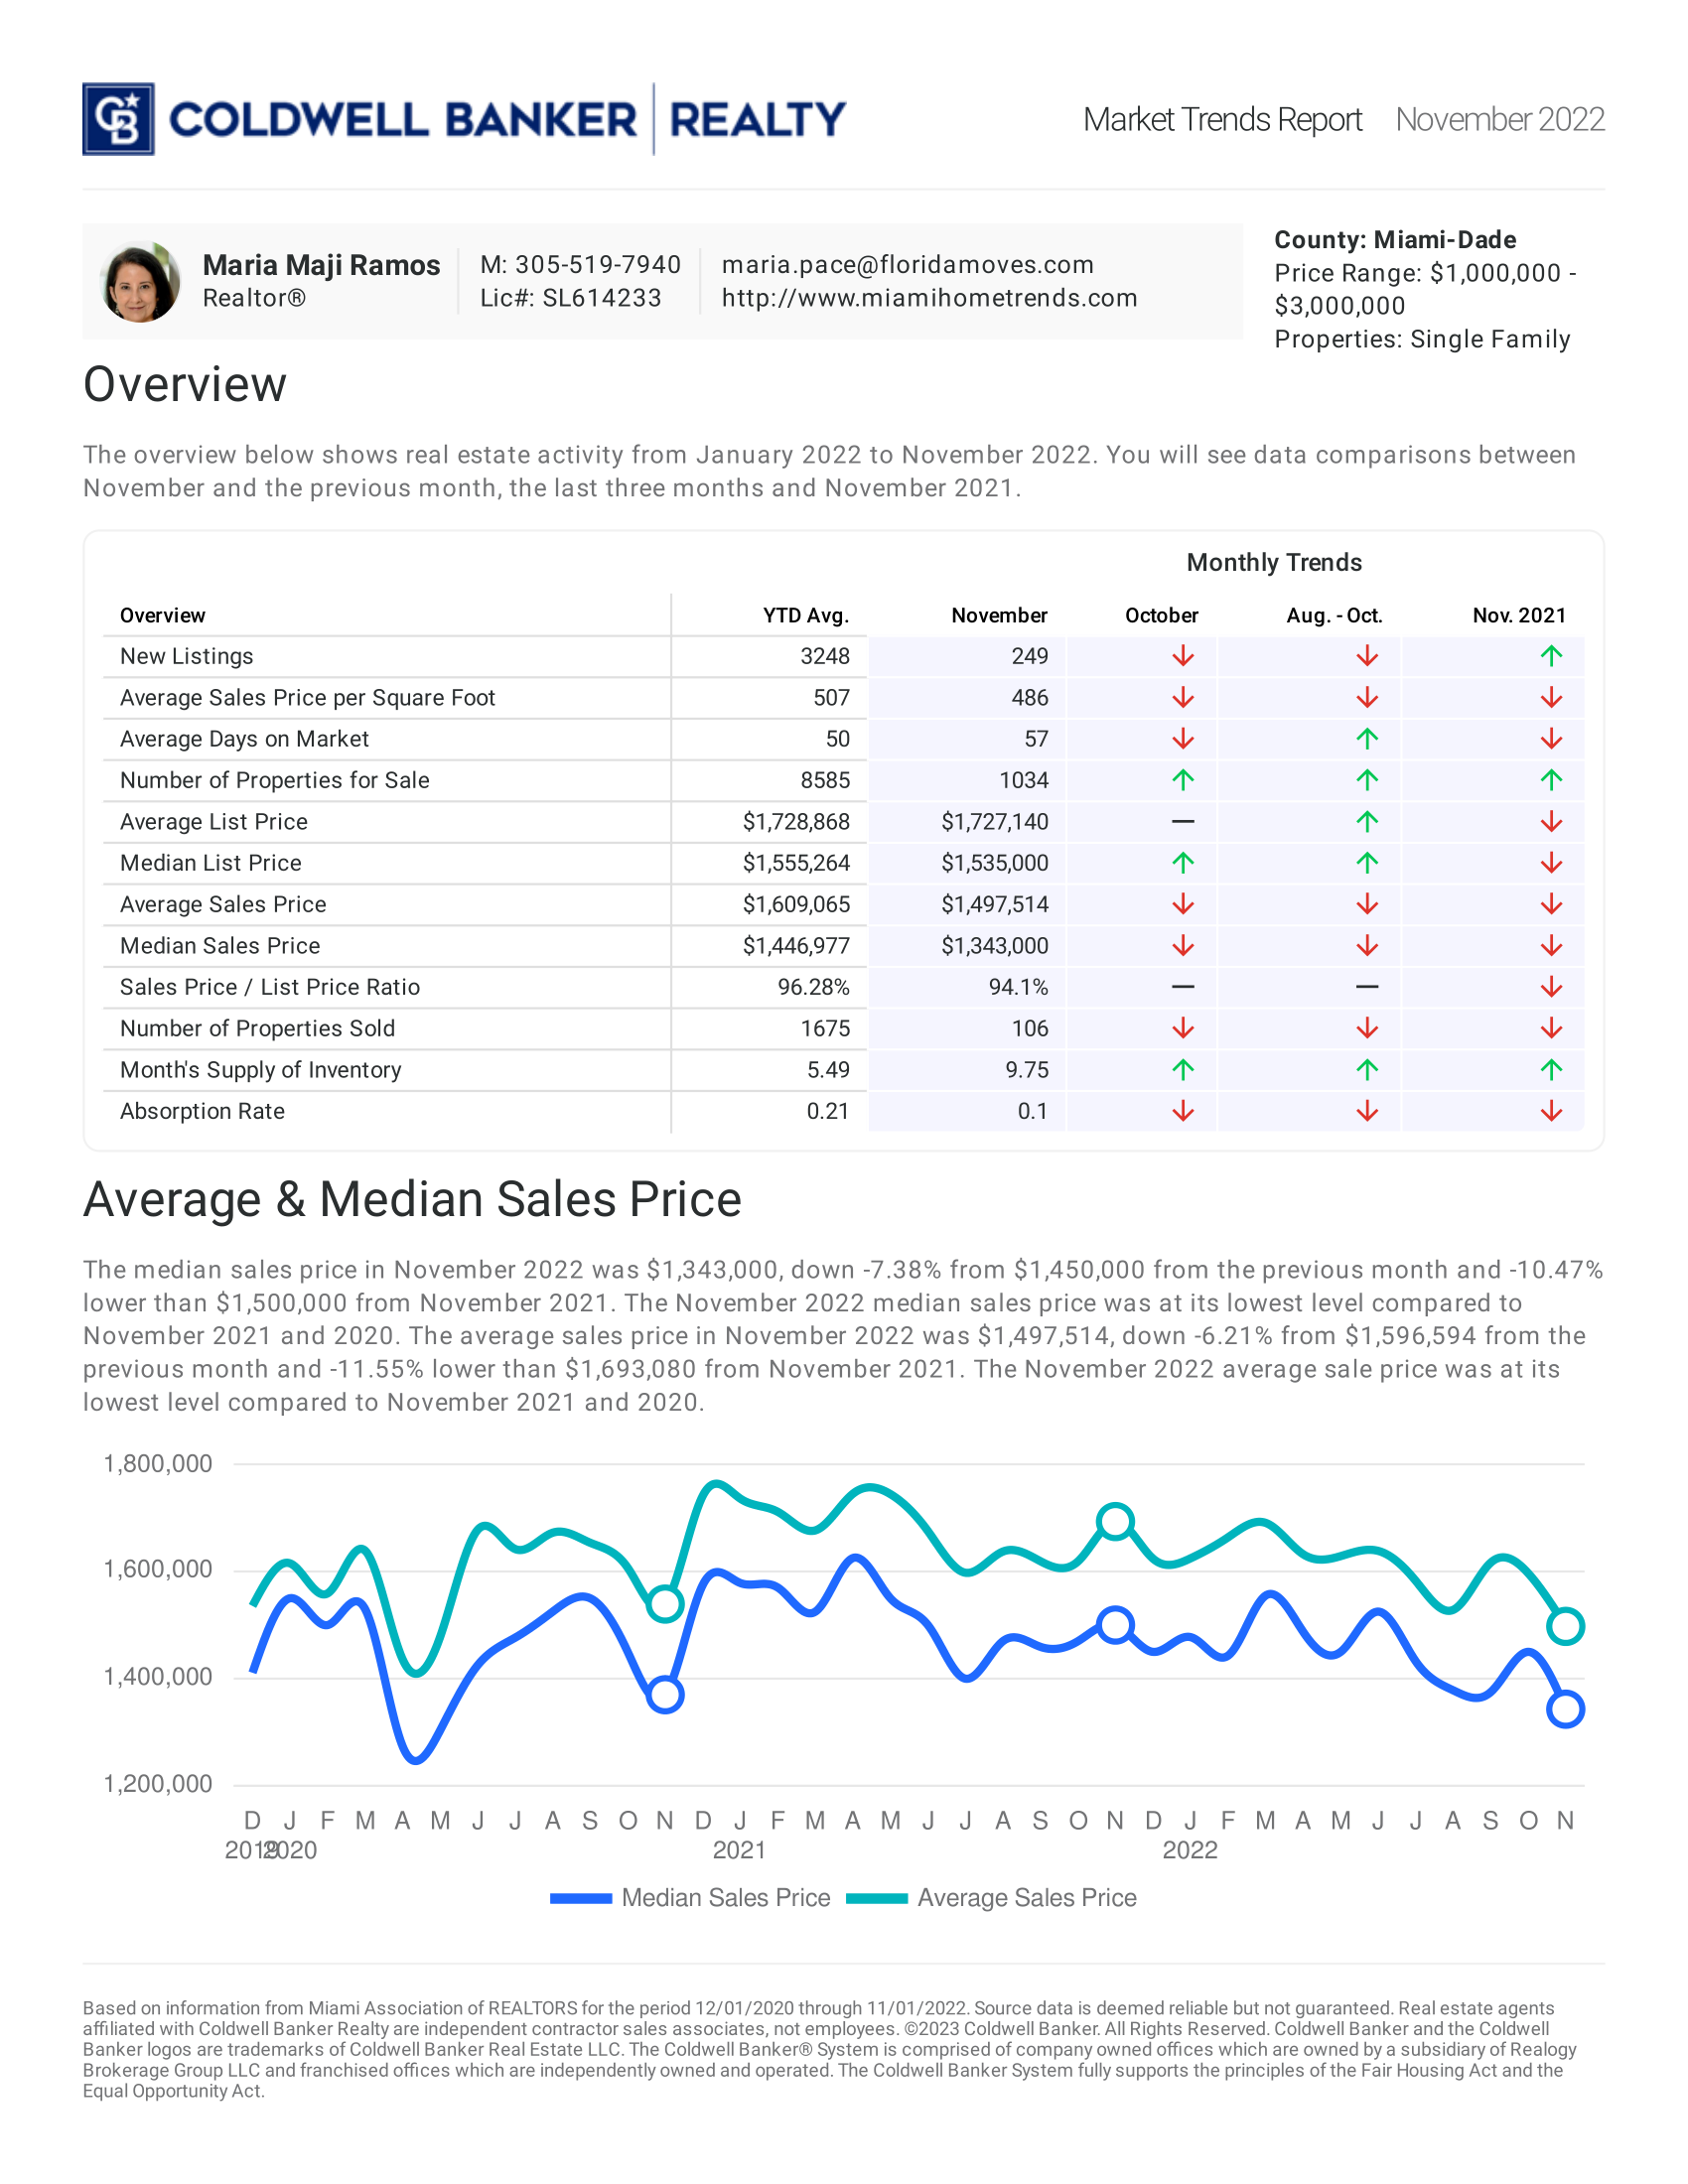
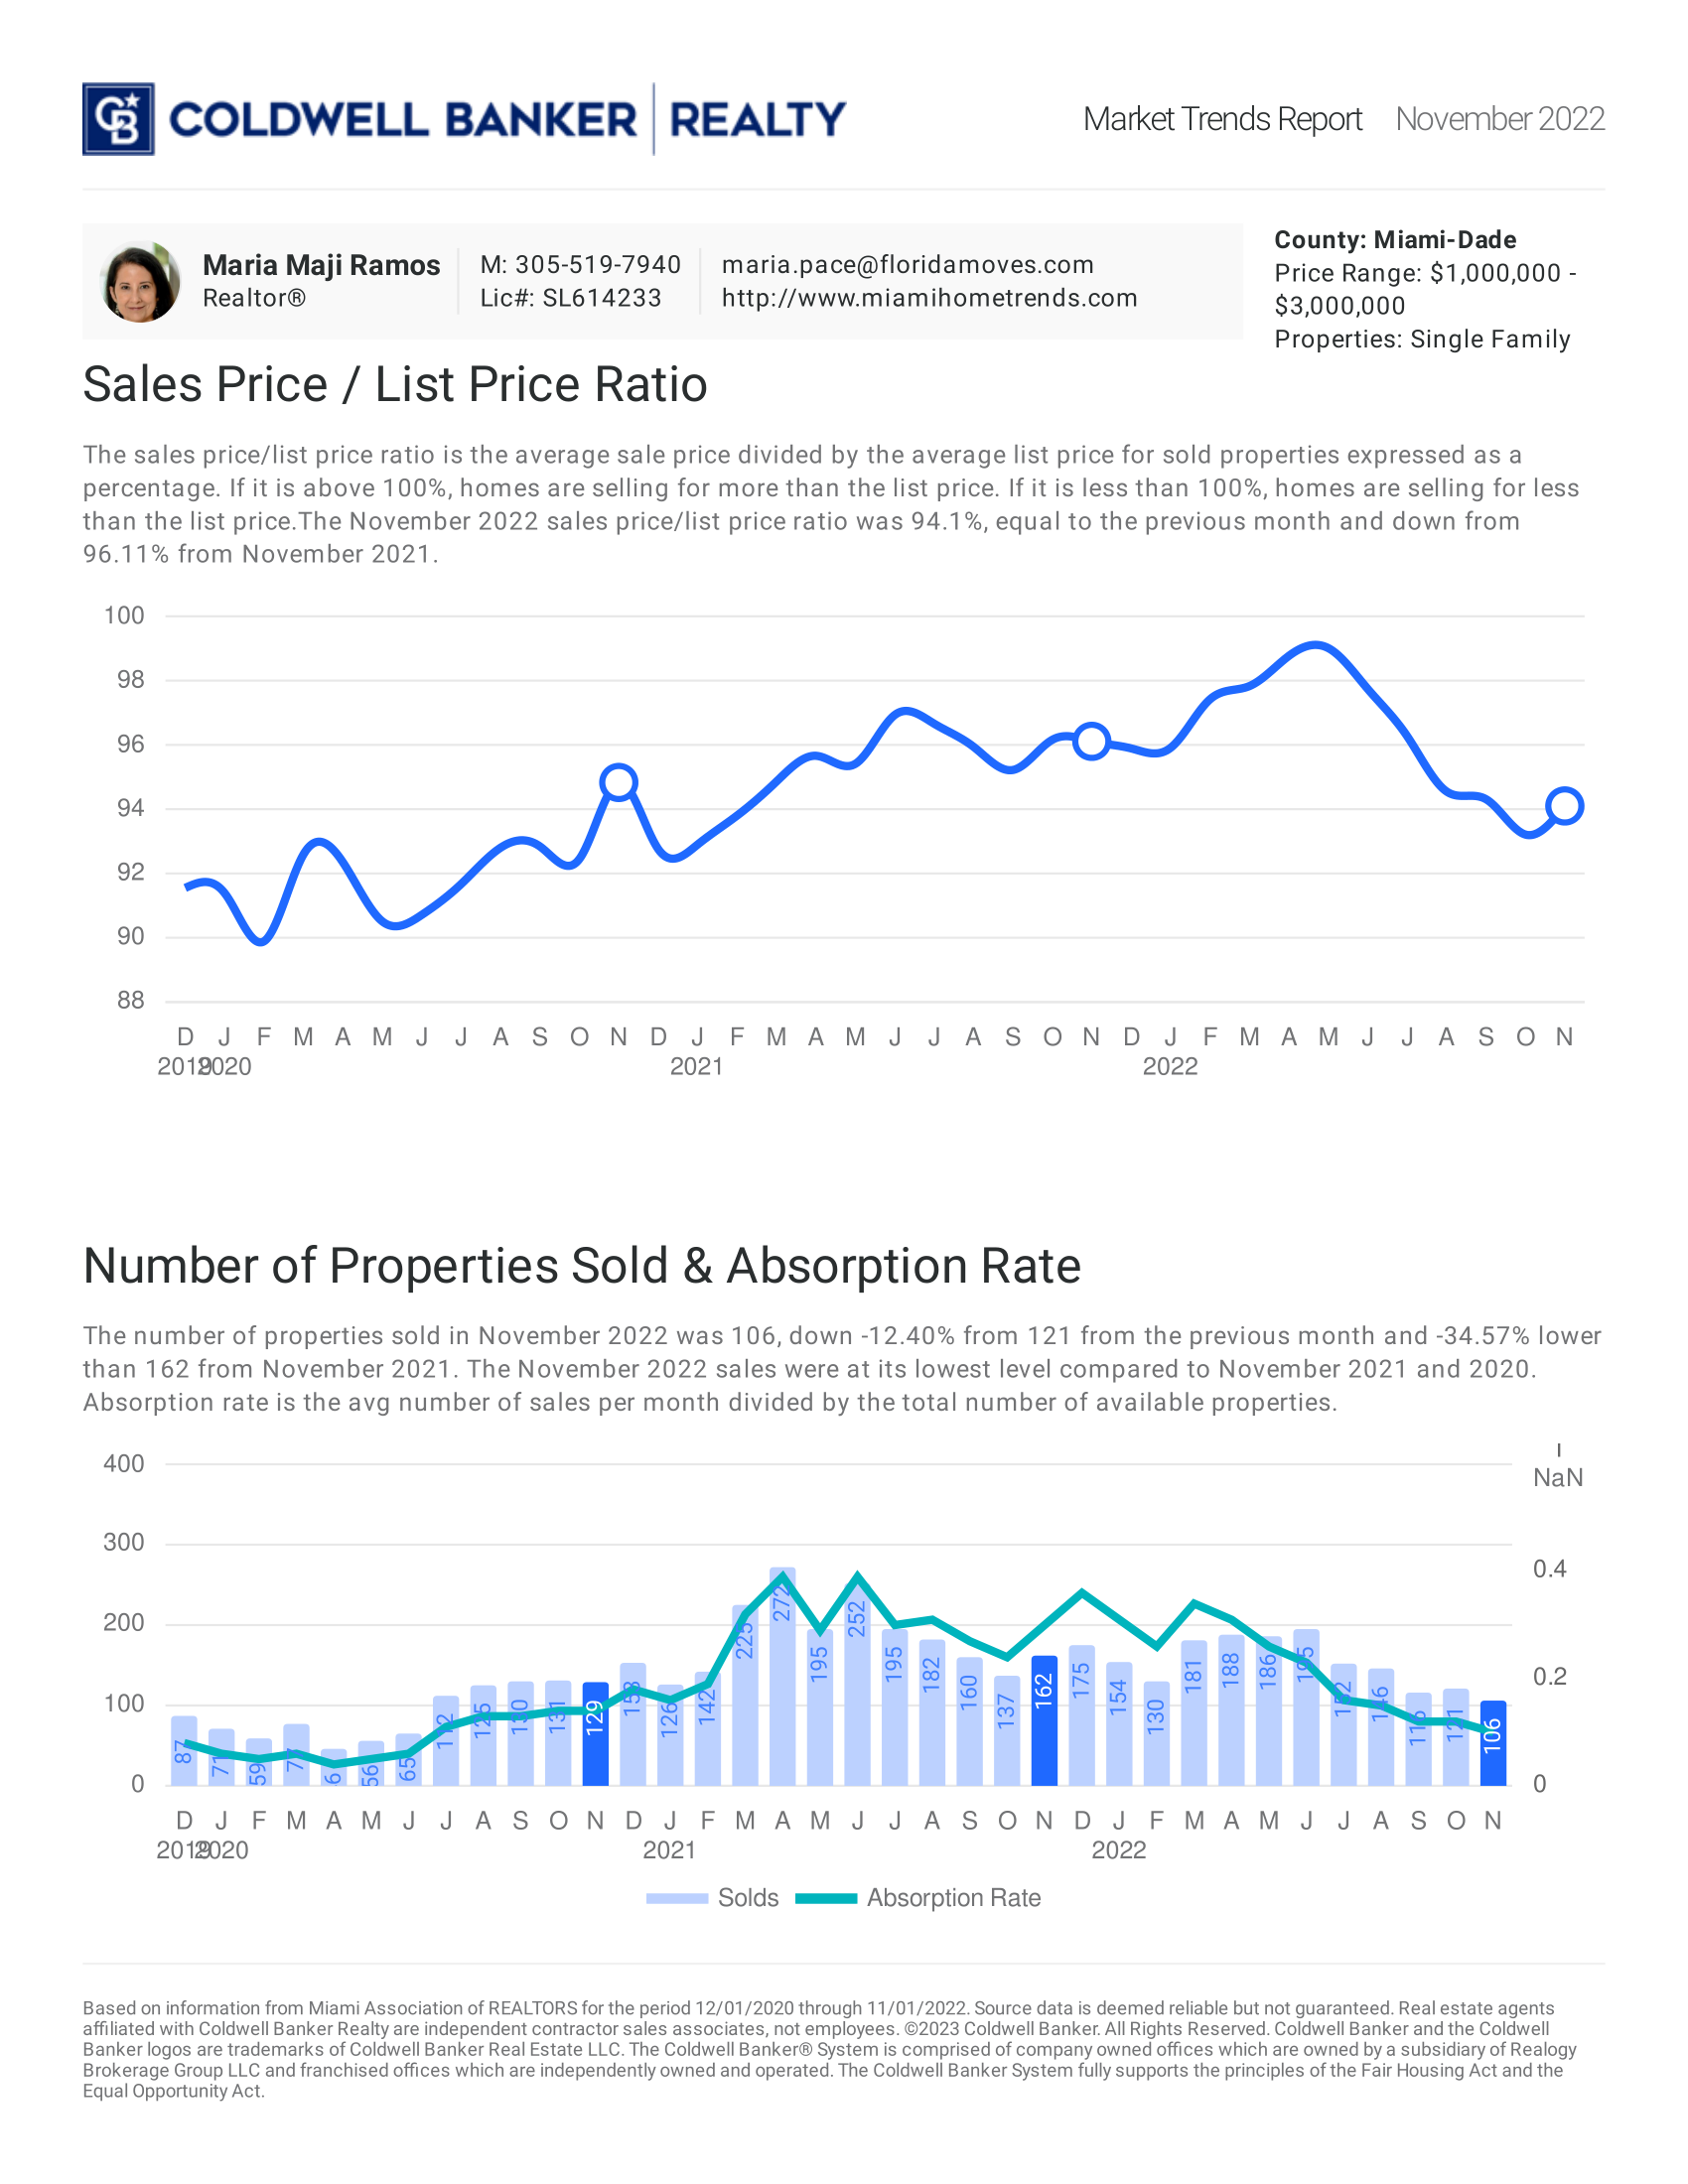
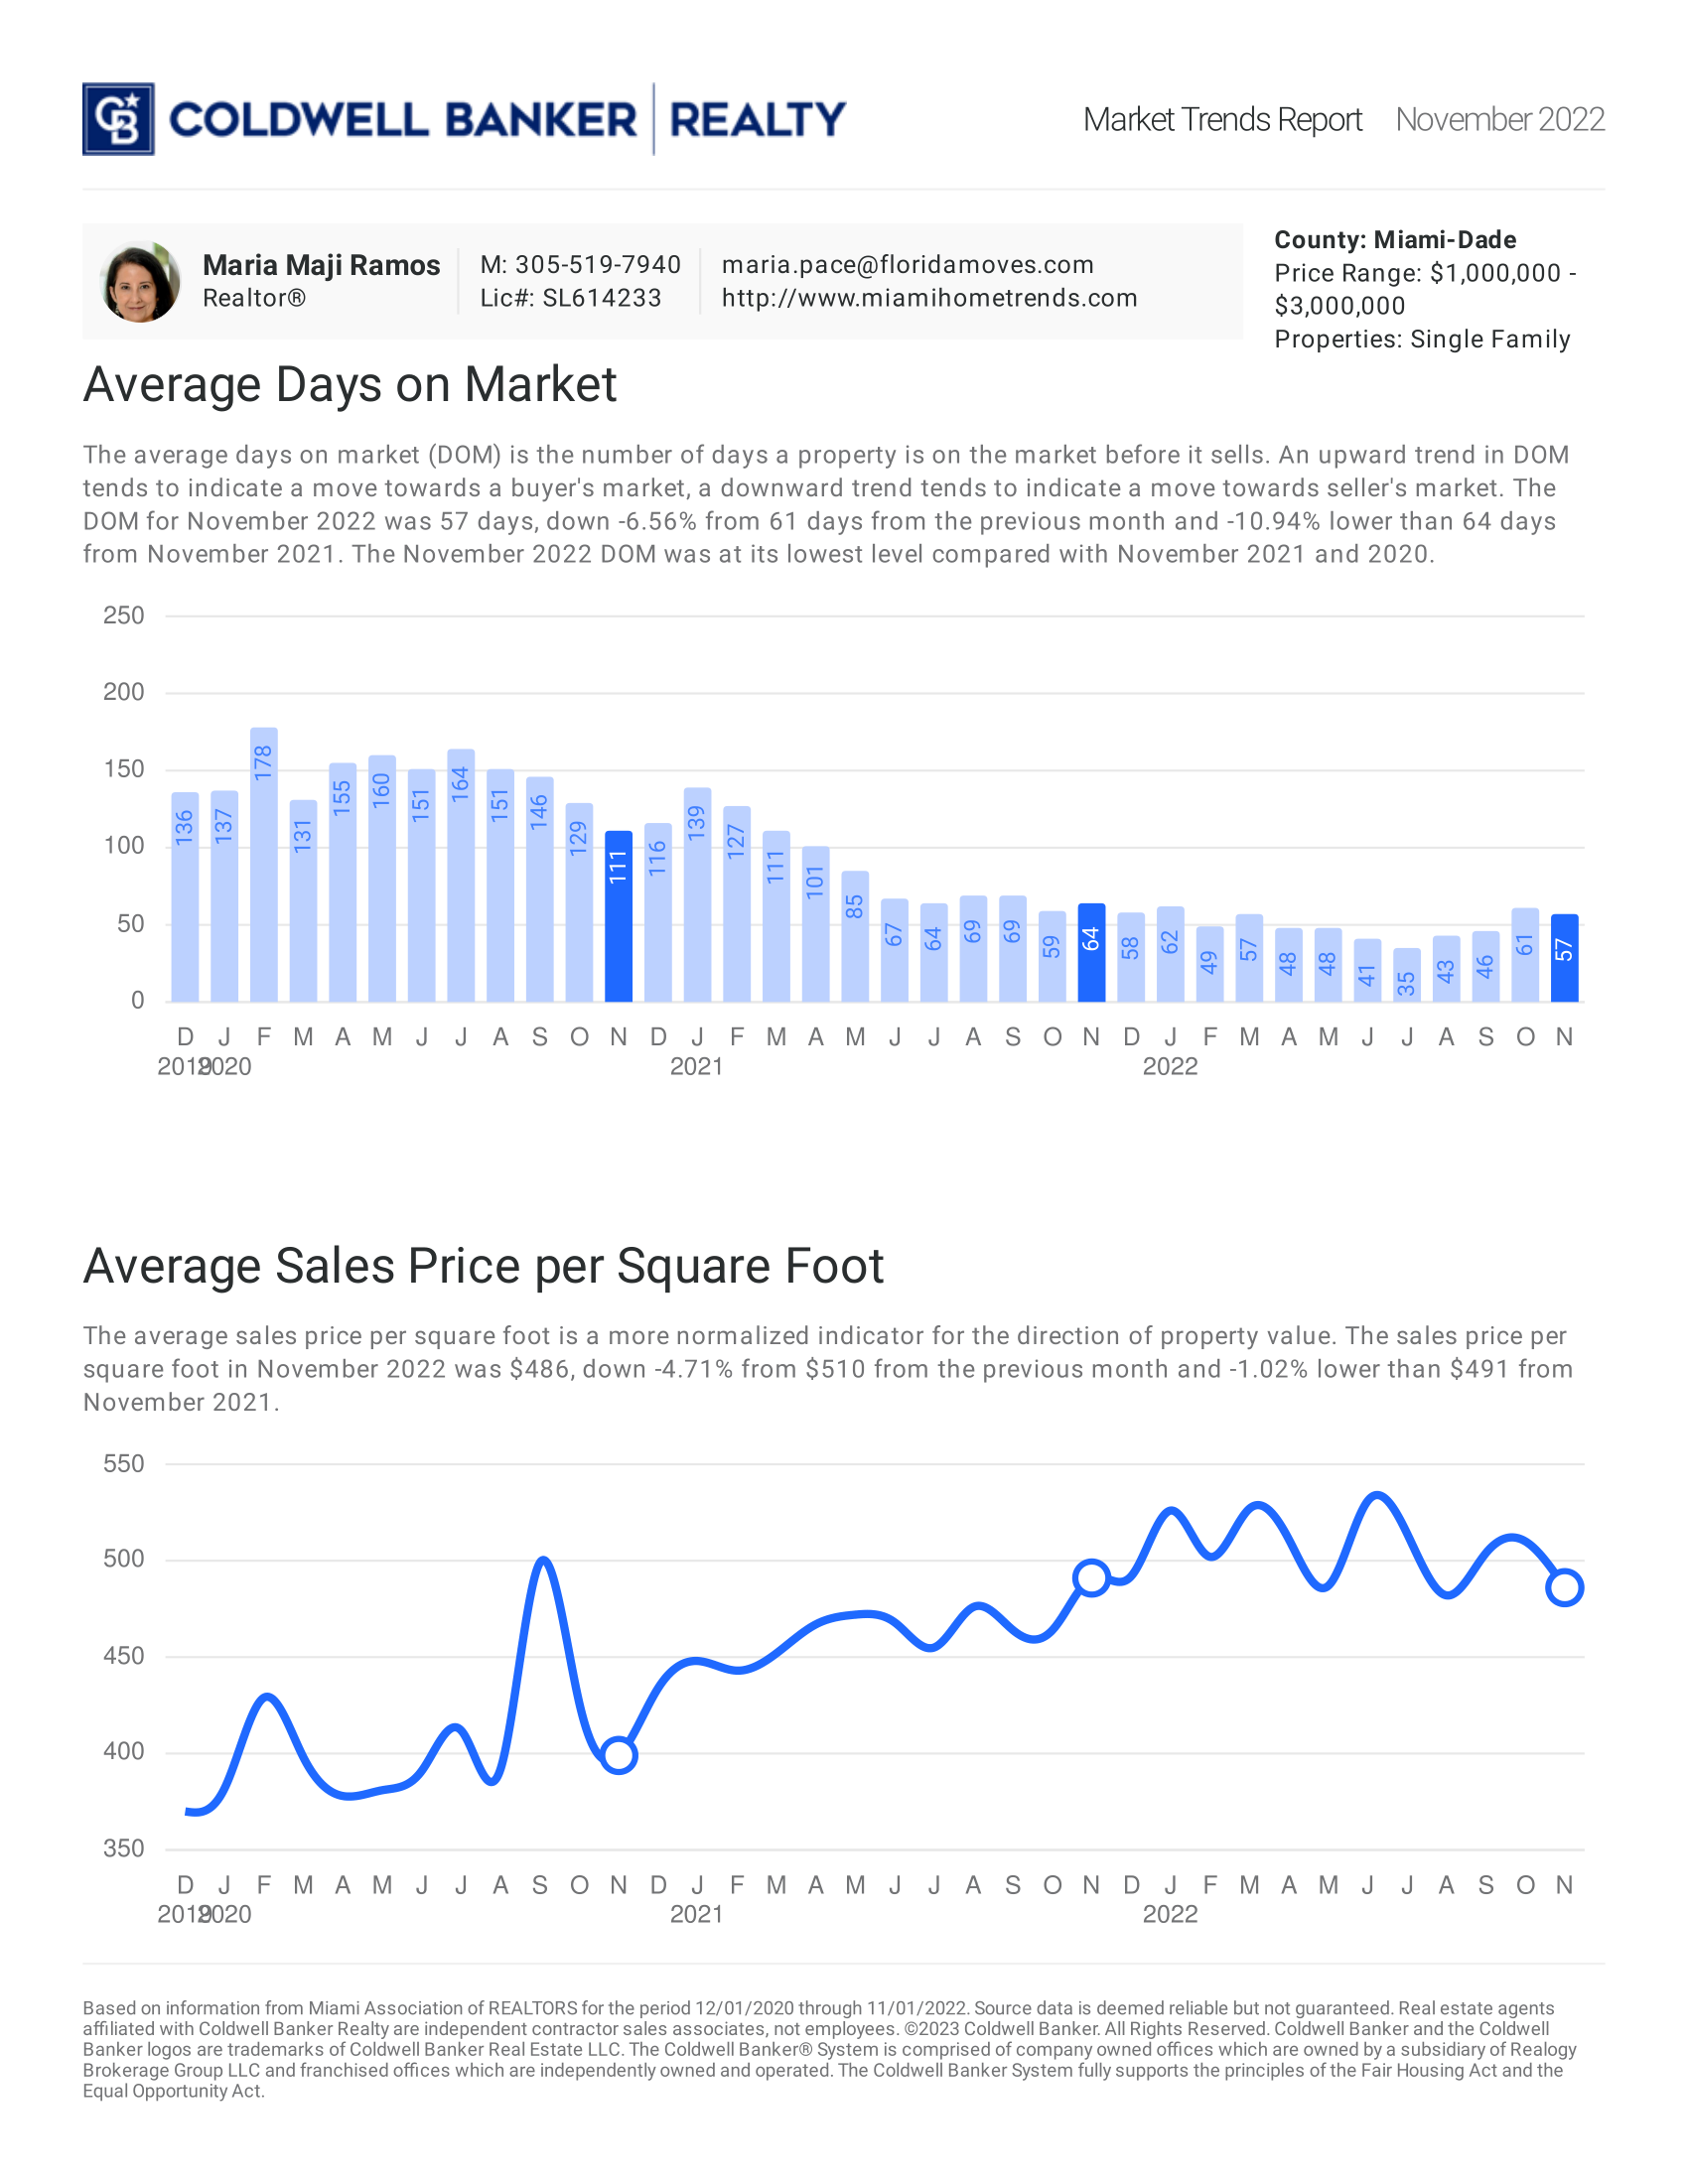
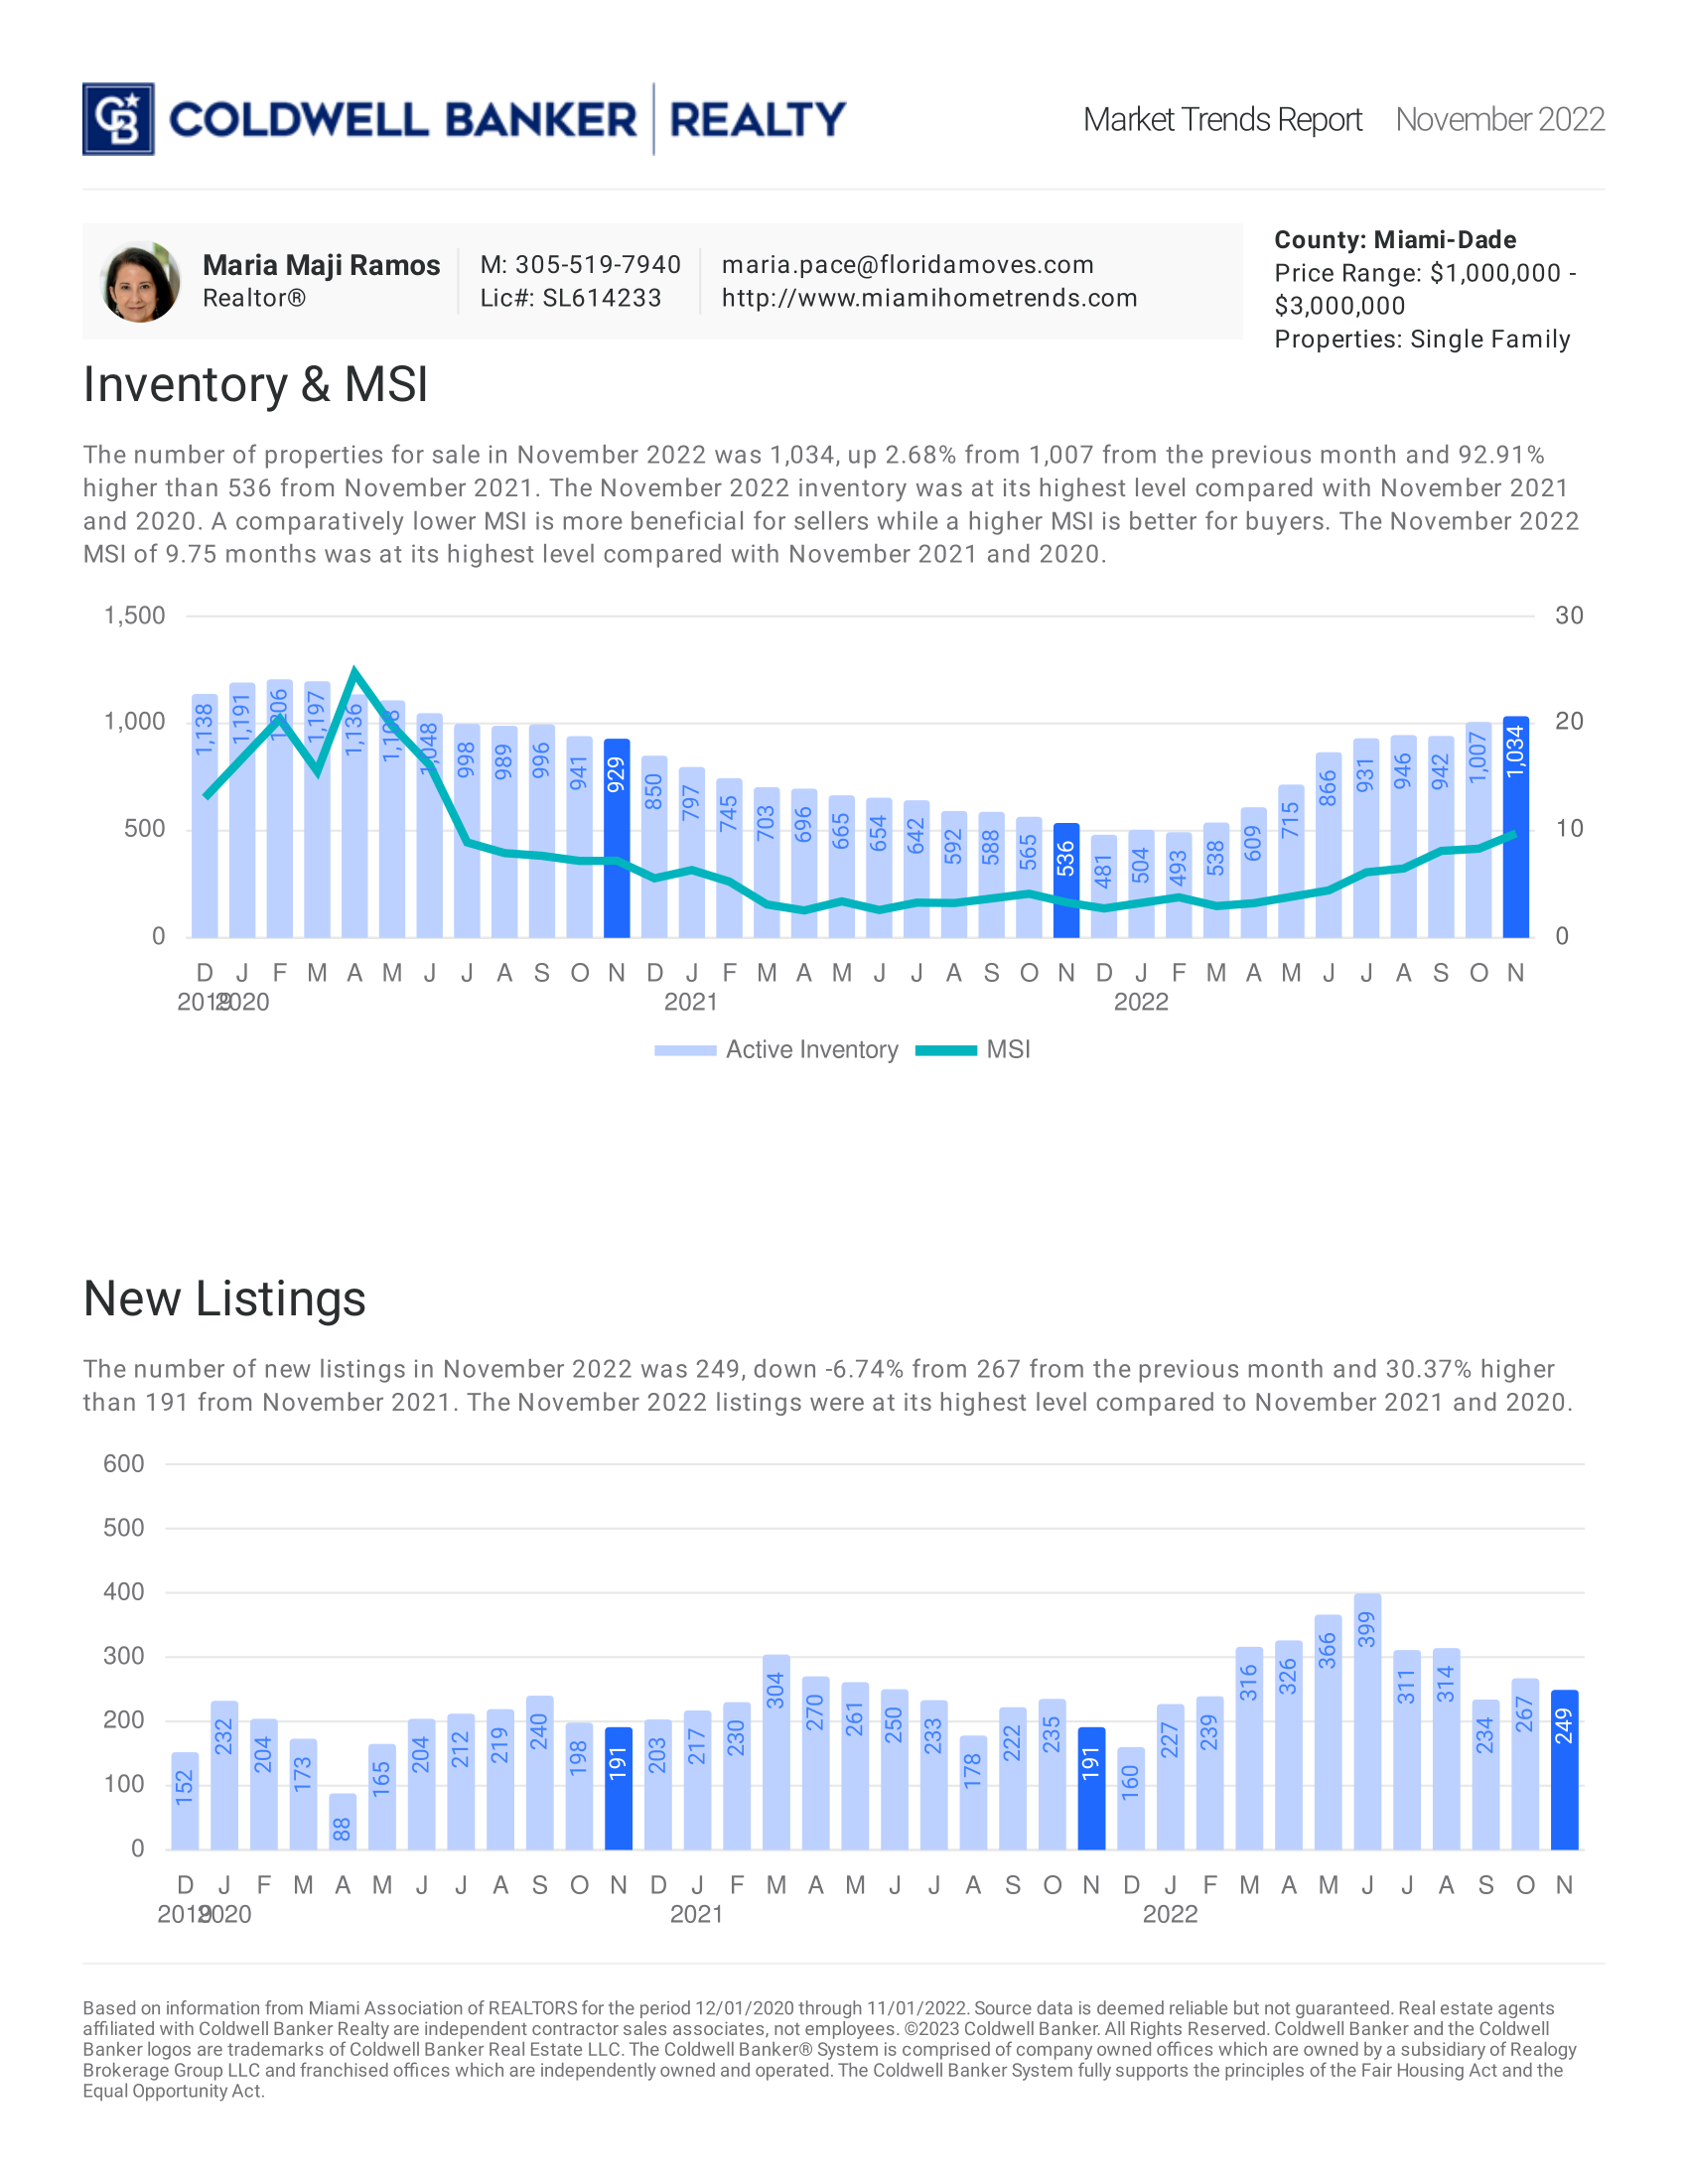
November 2022: Single Family

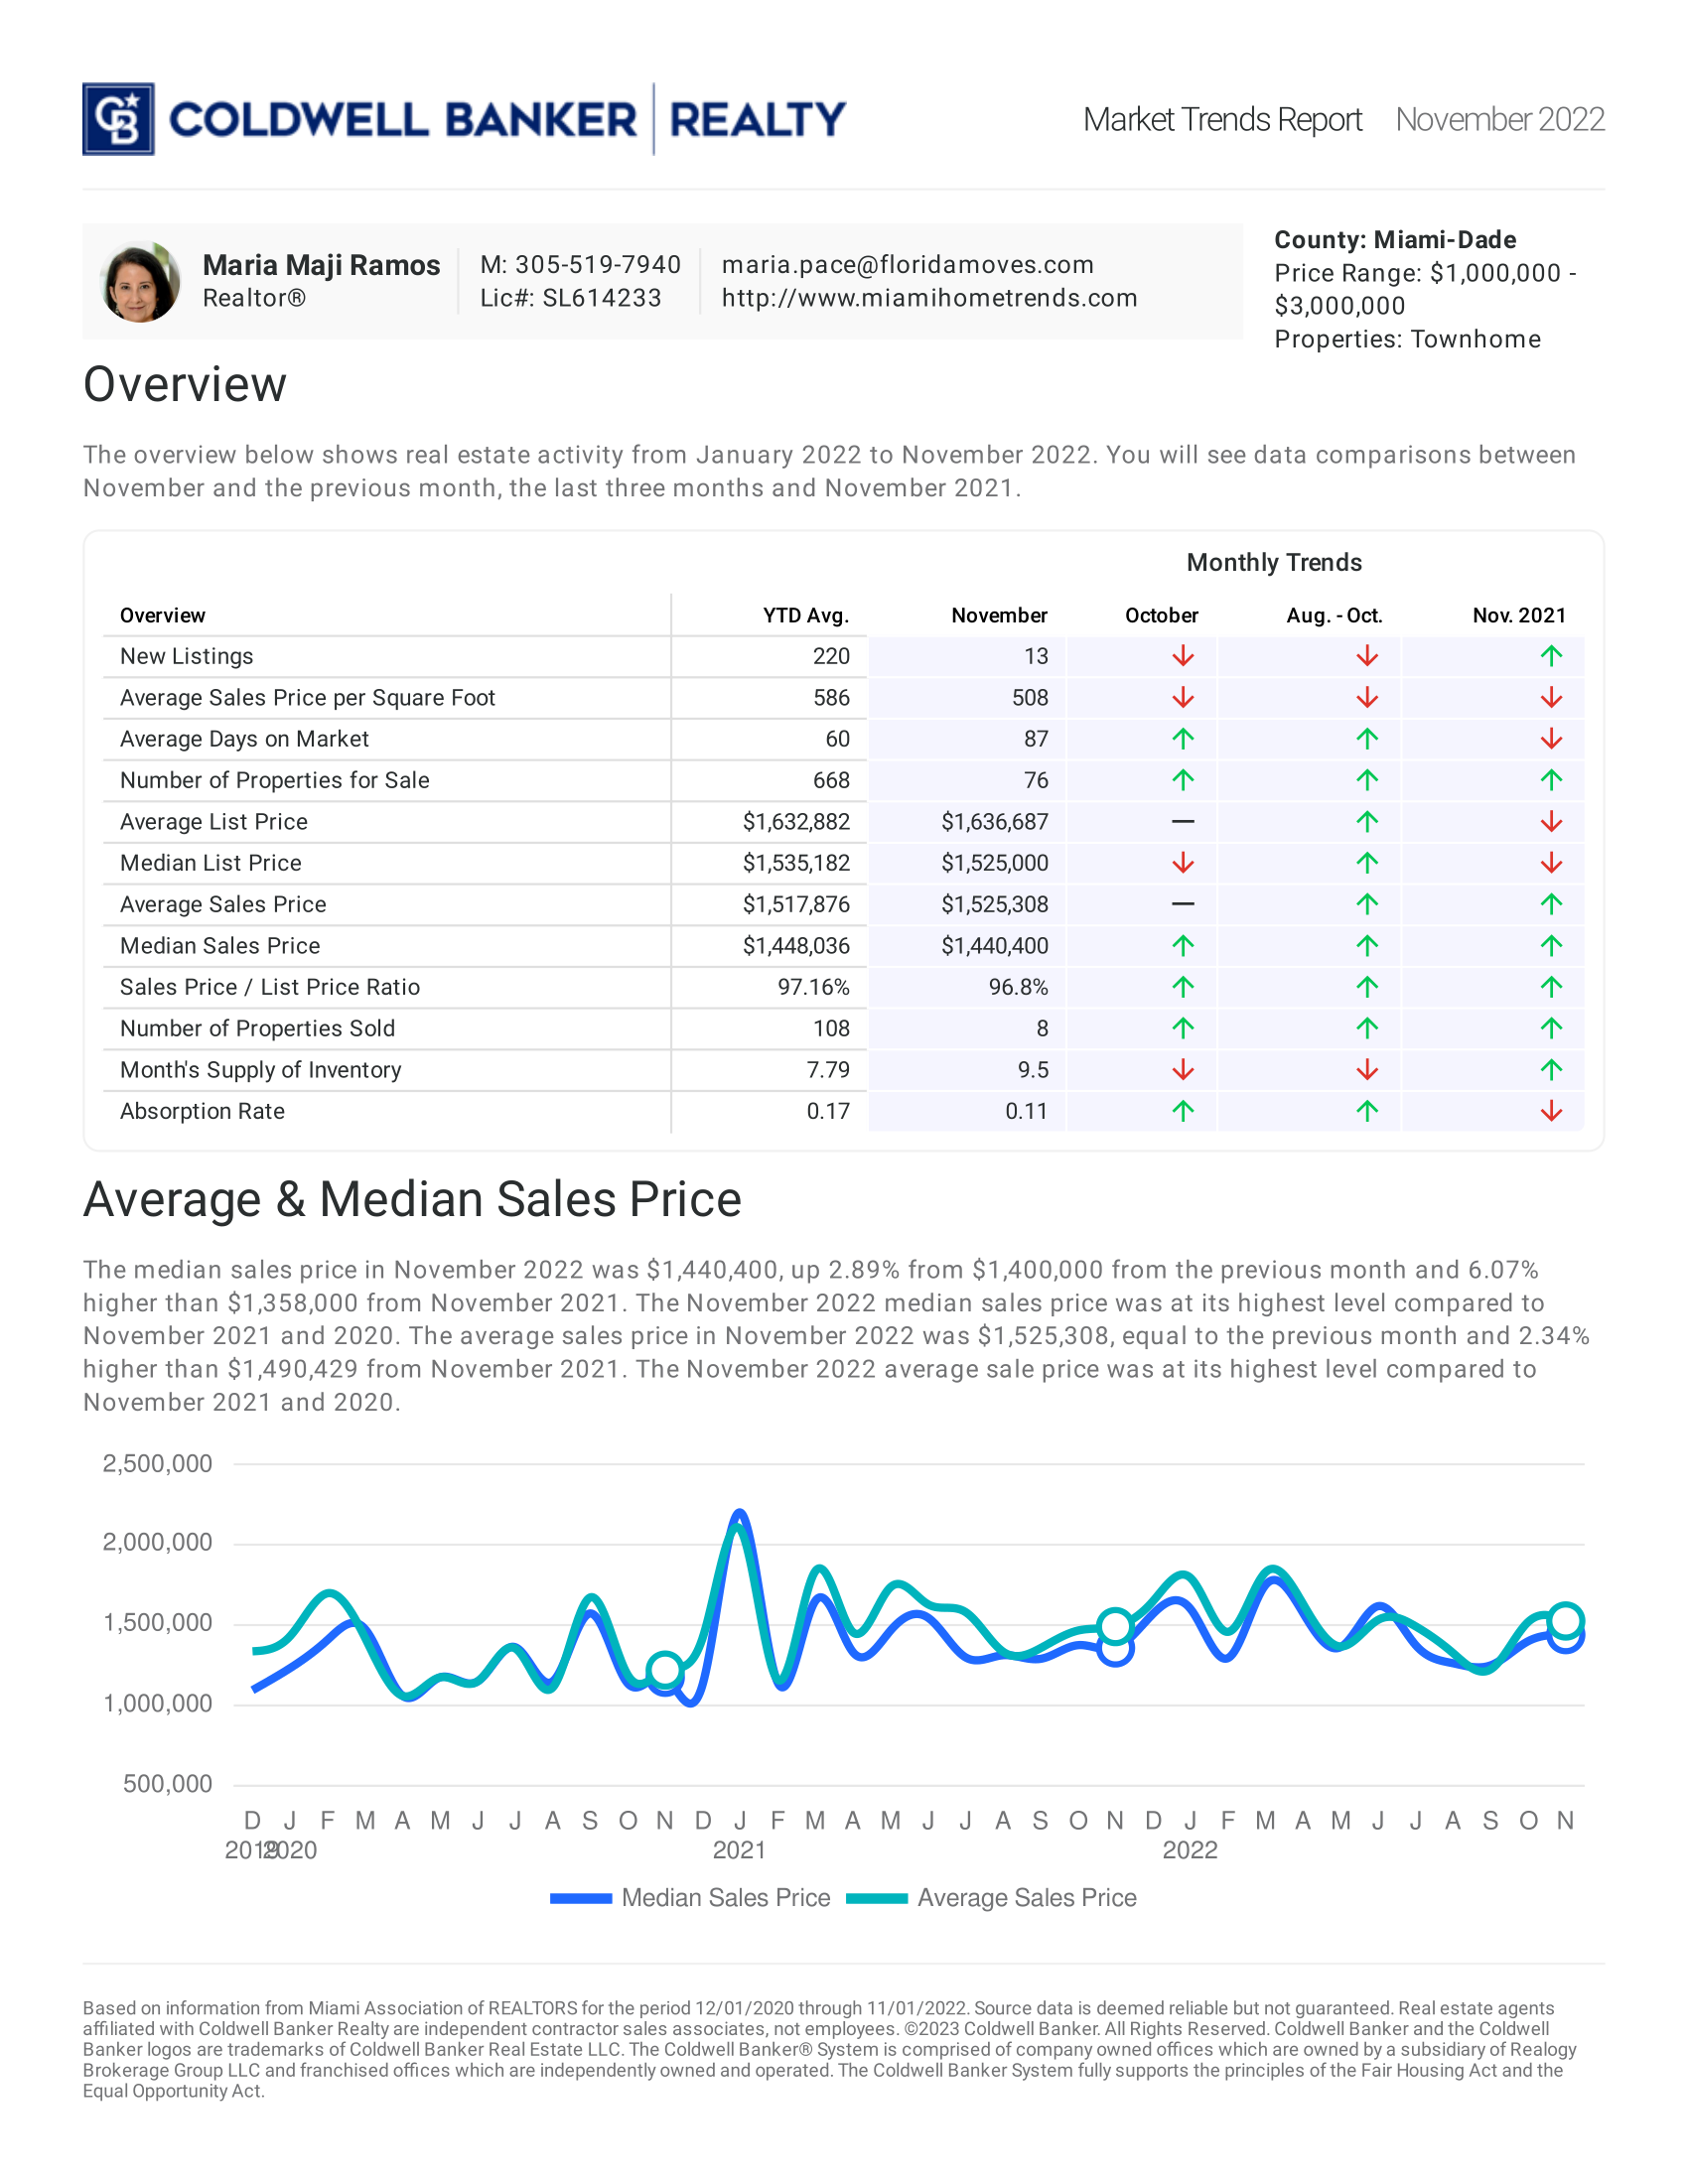
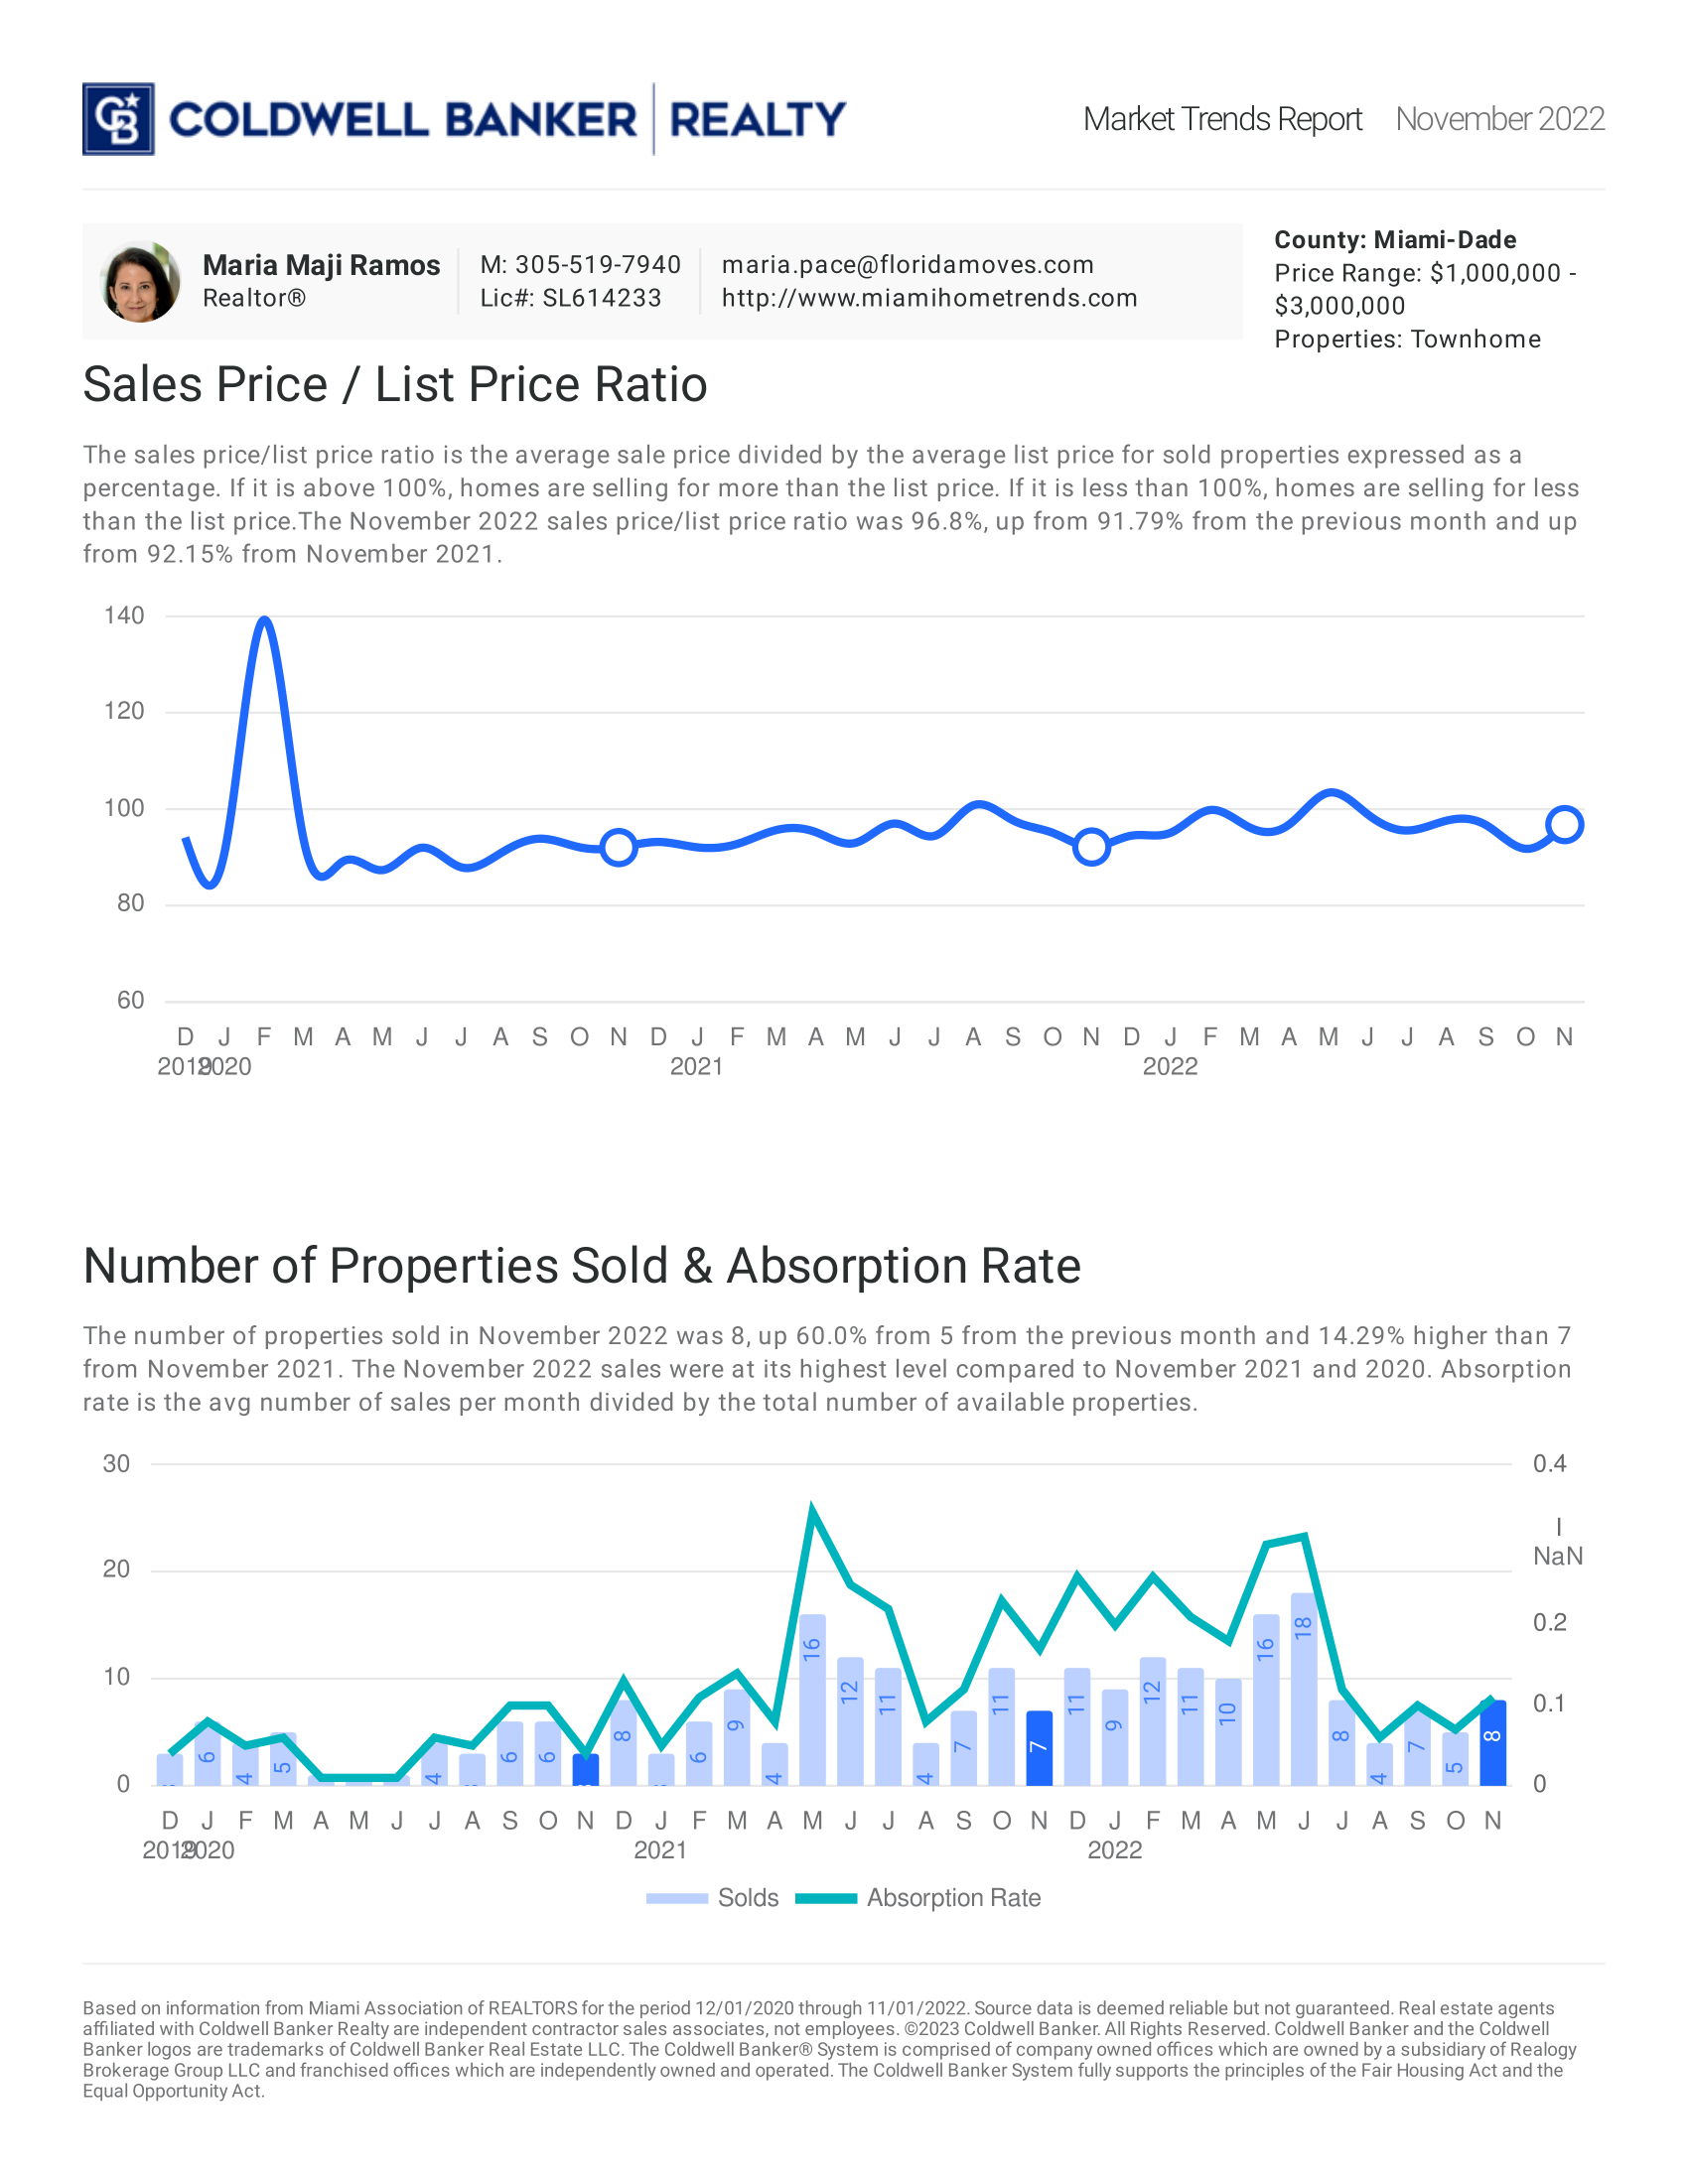
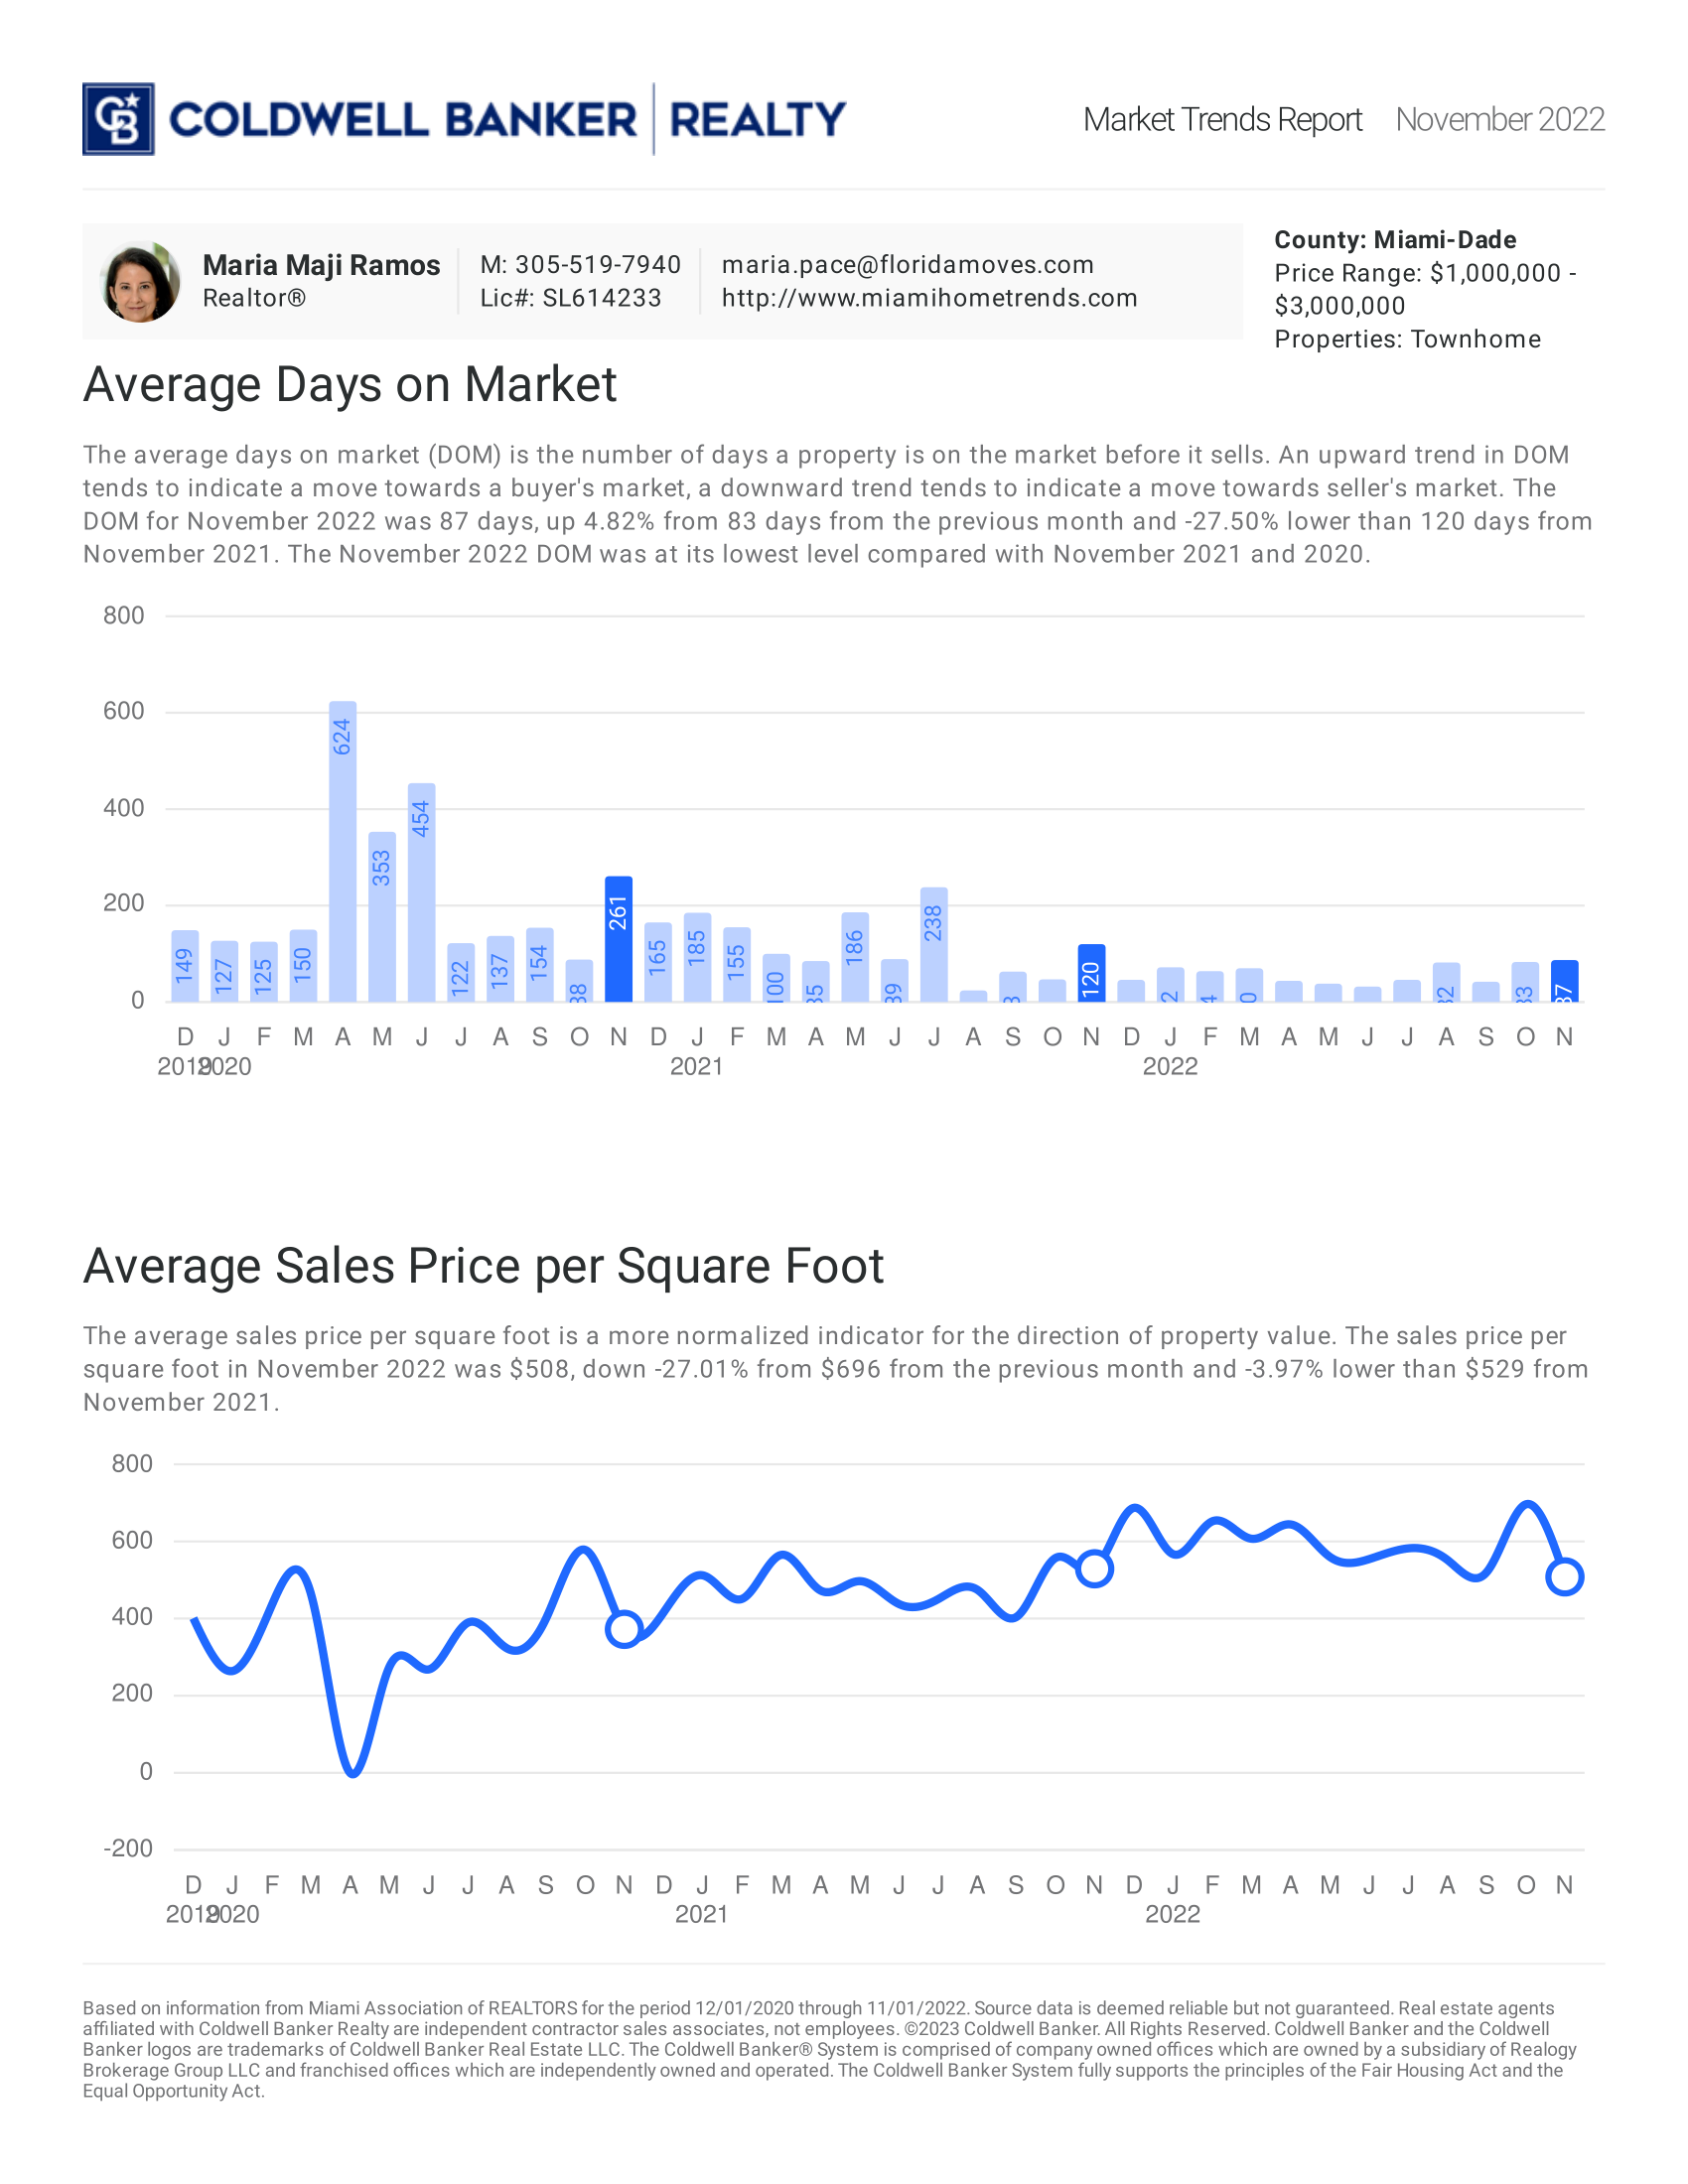
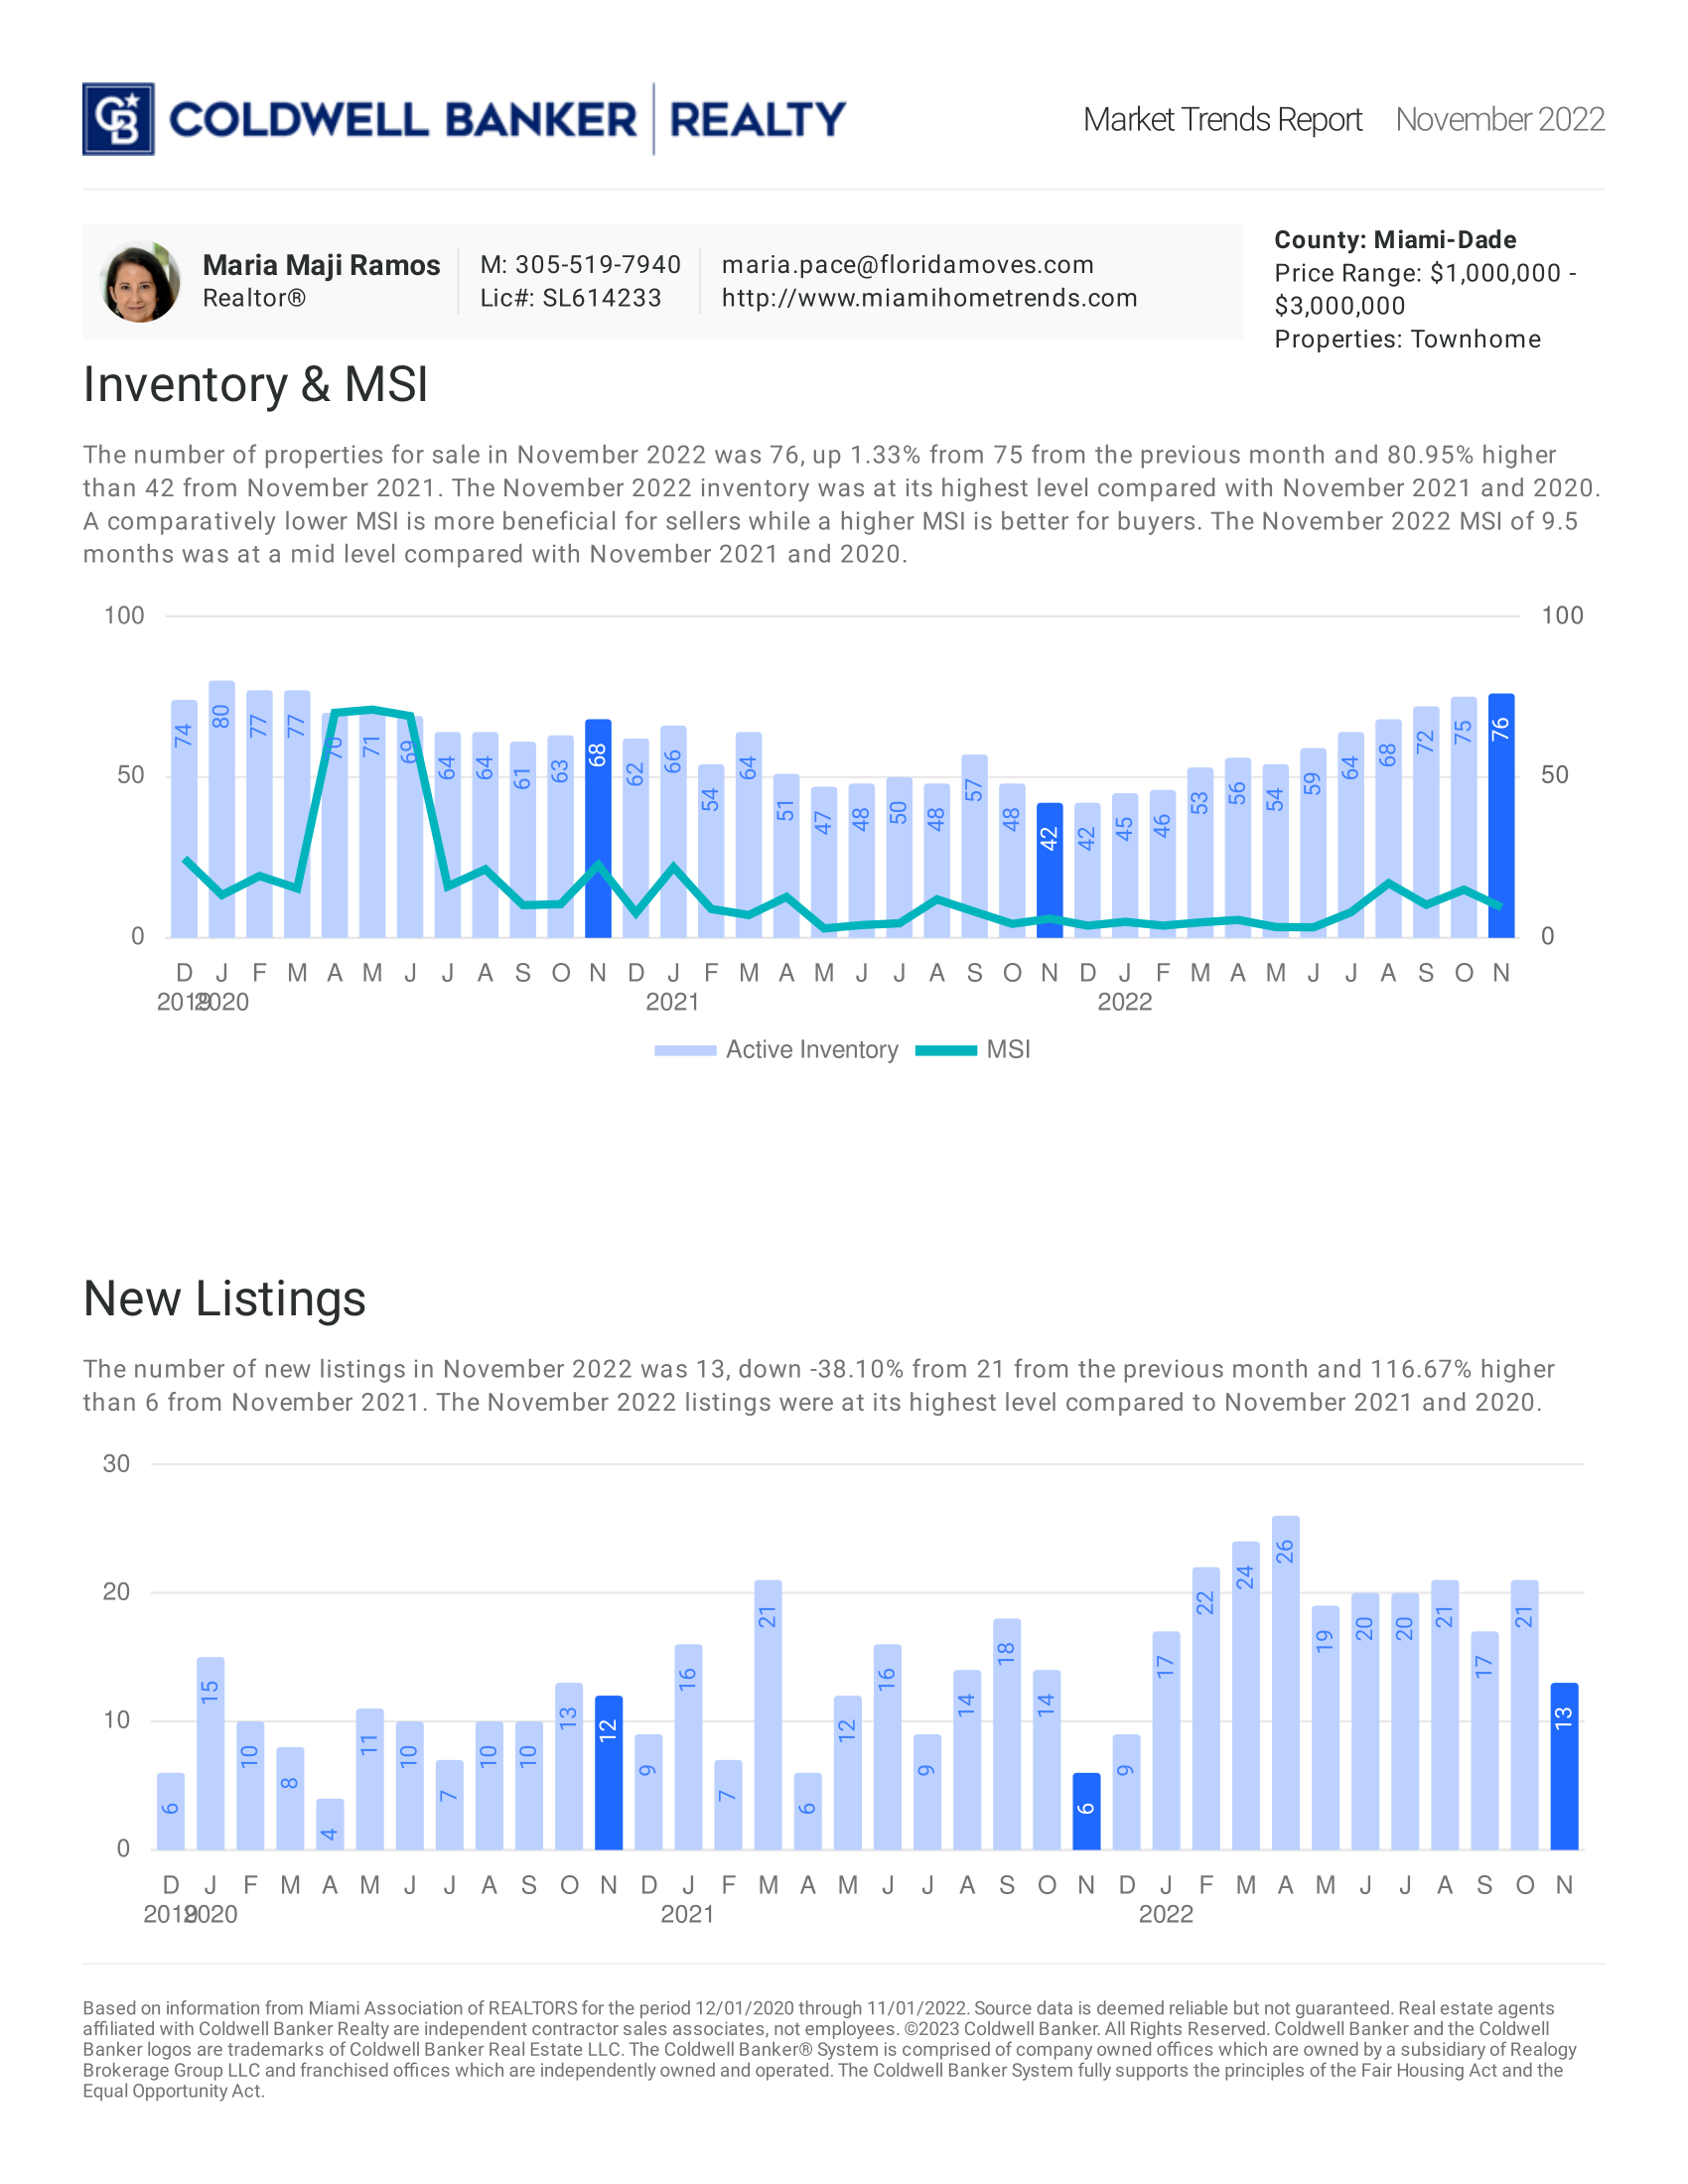
November 2022: Townhome

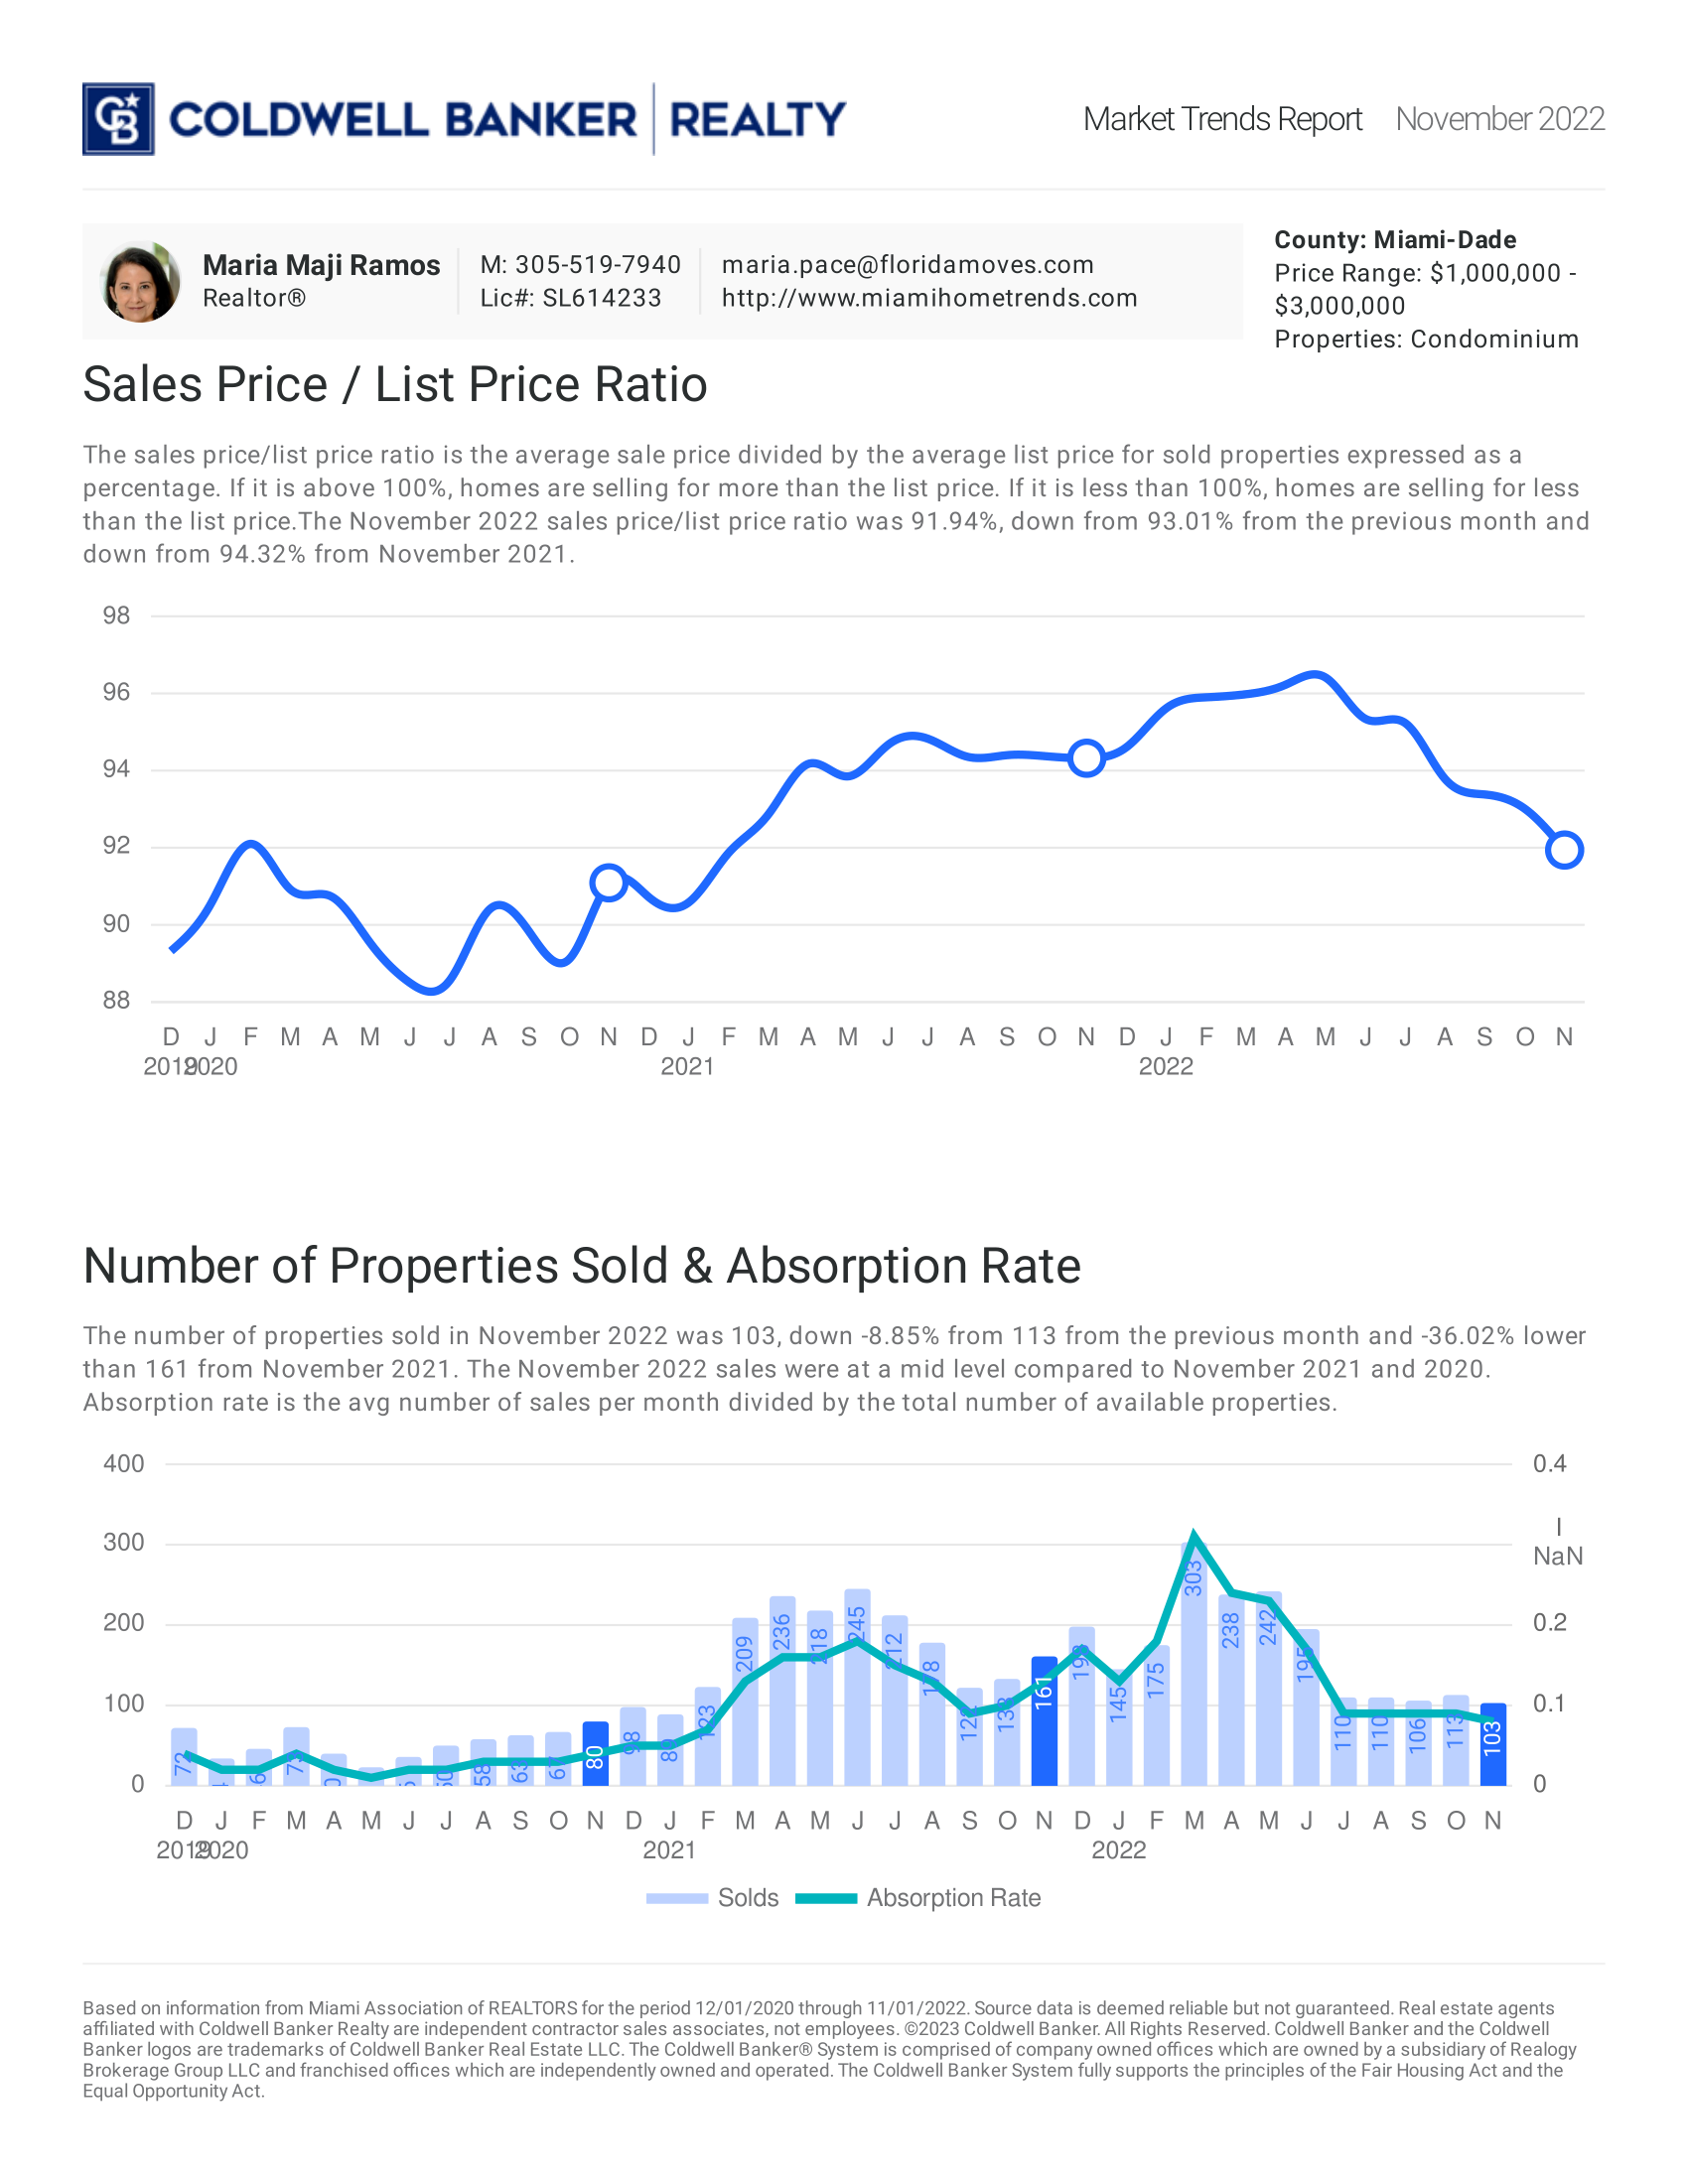
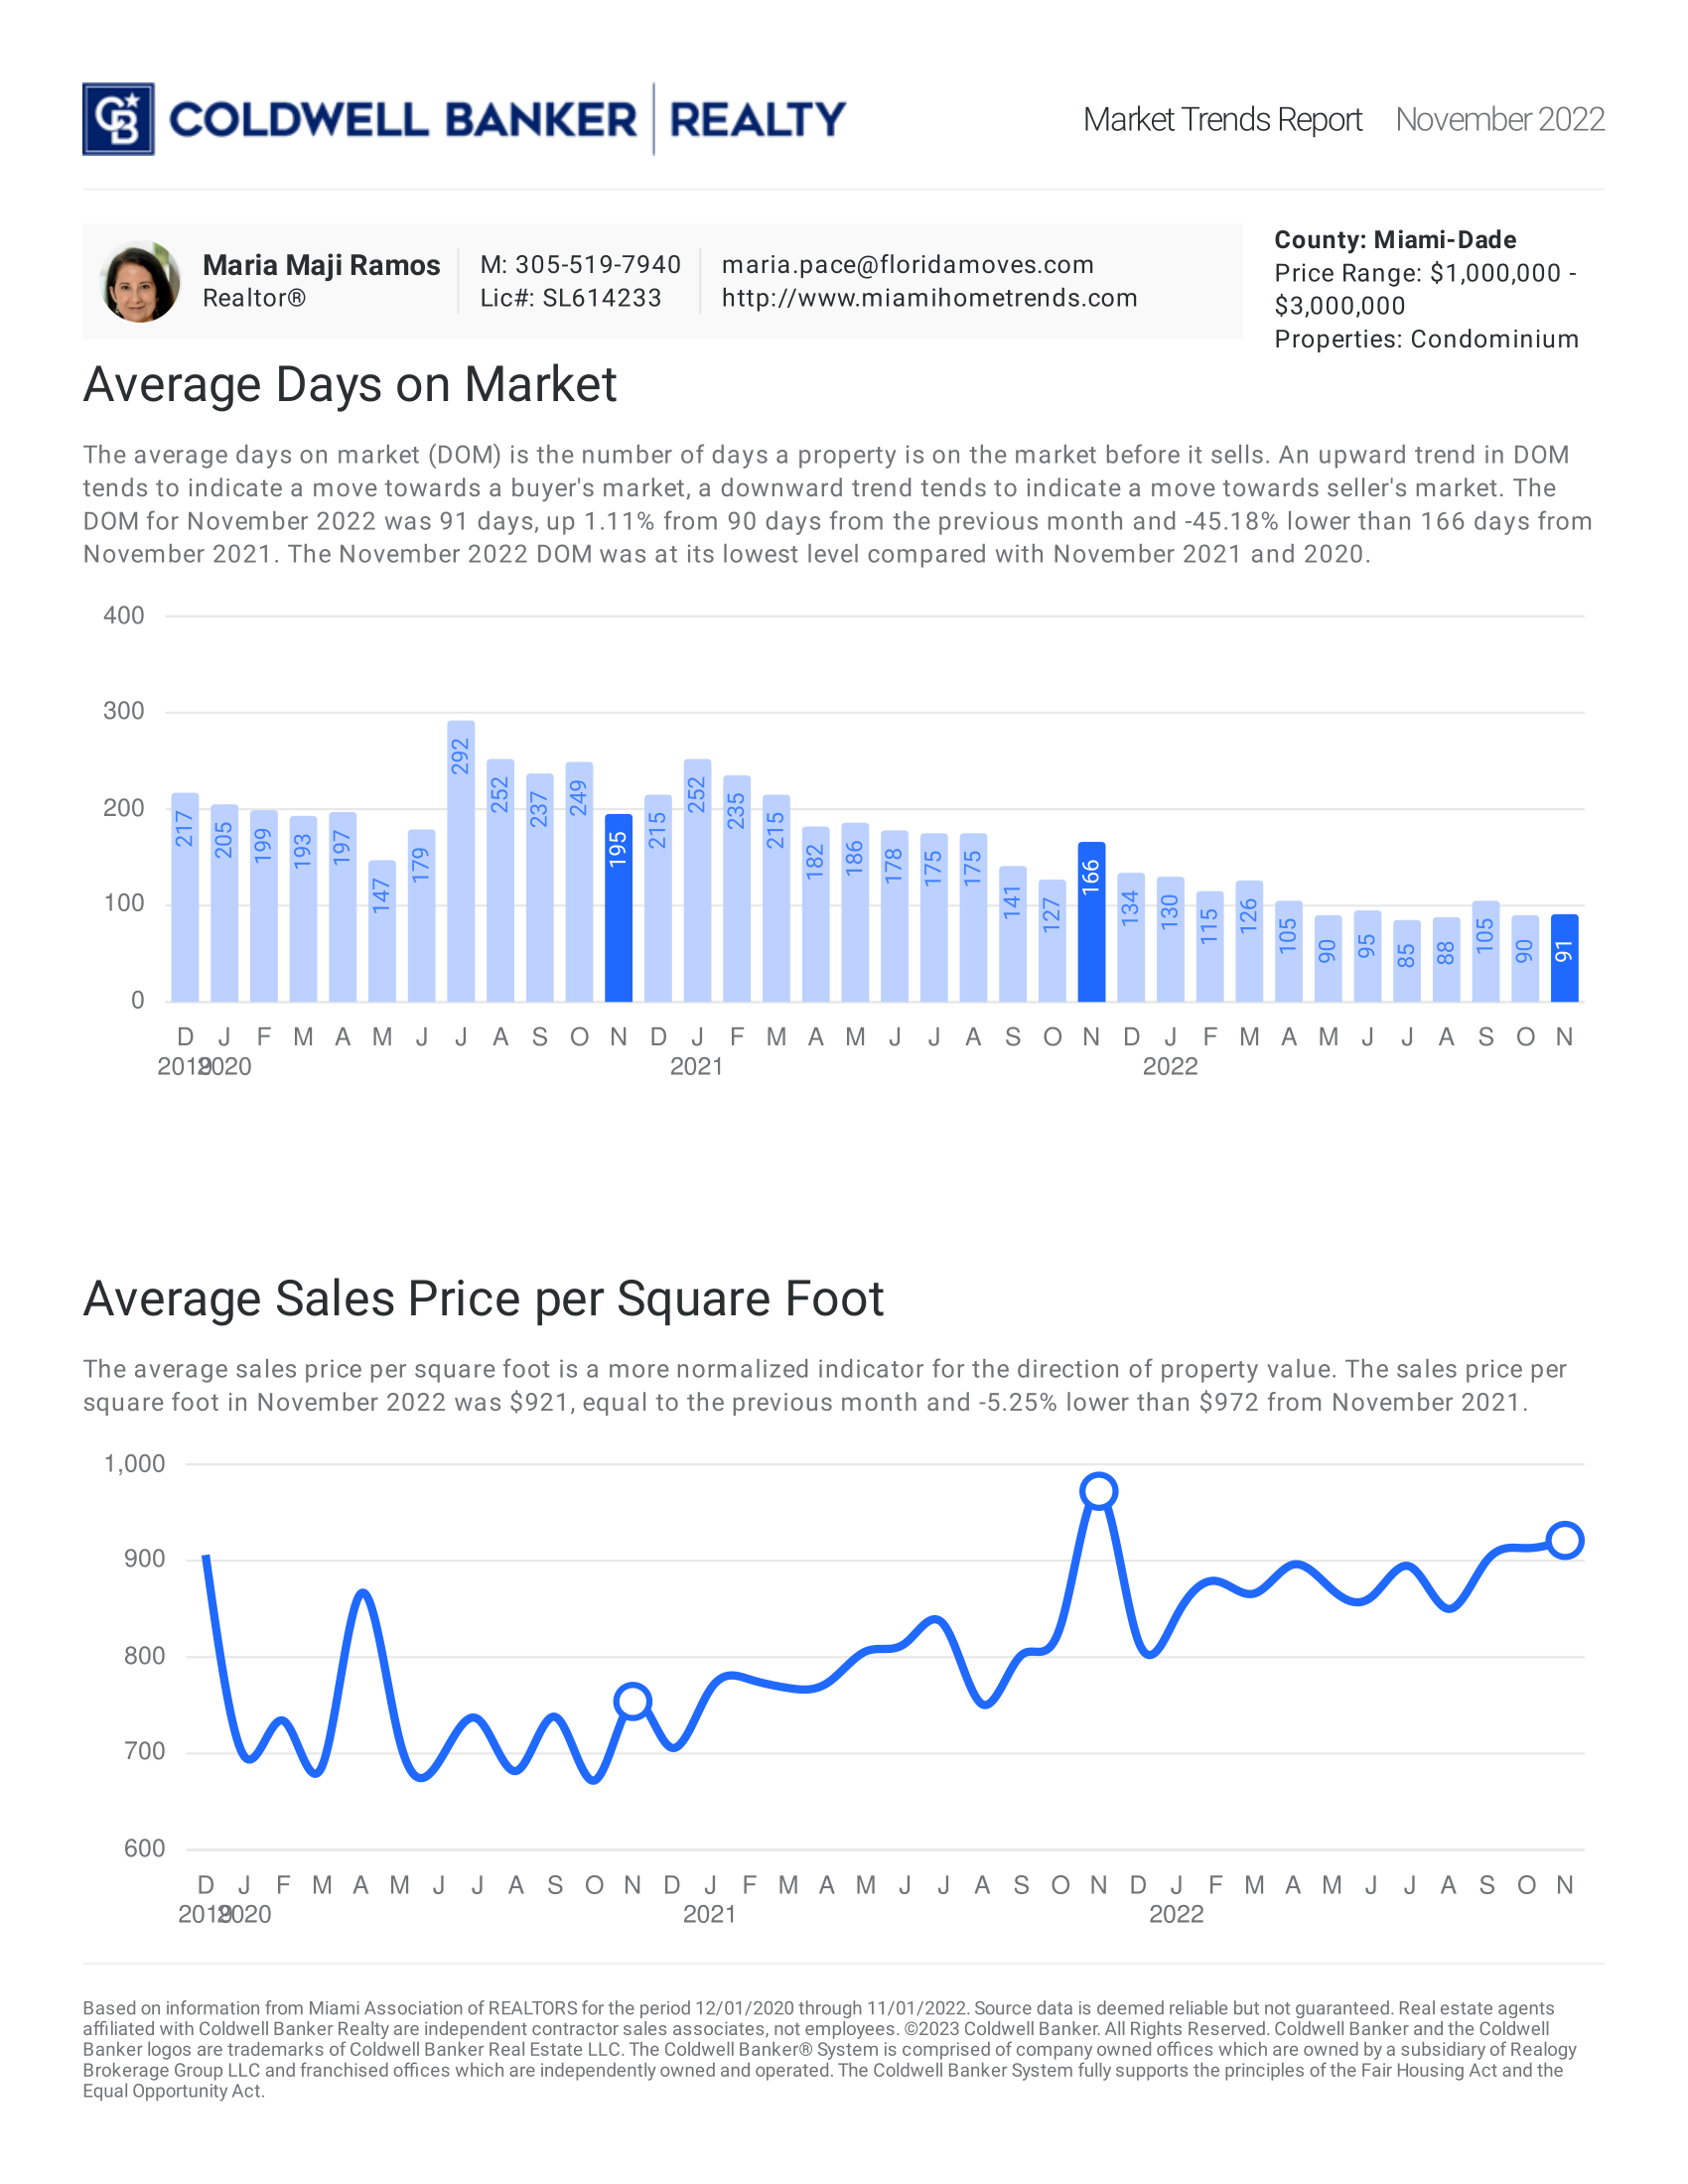
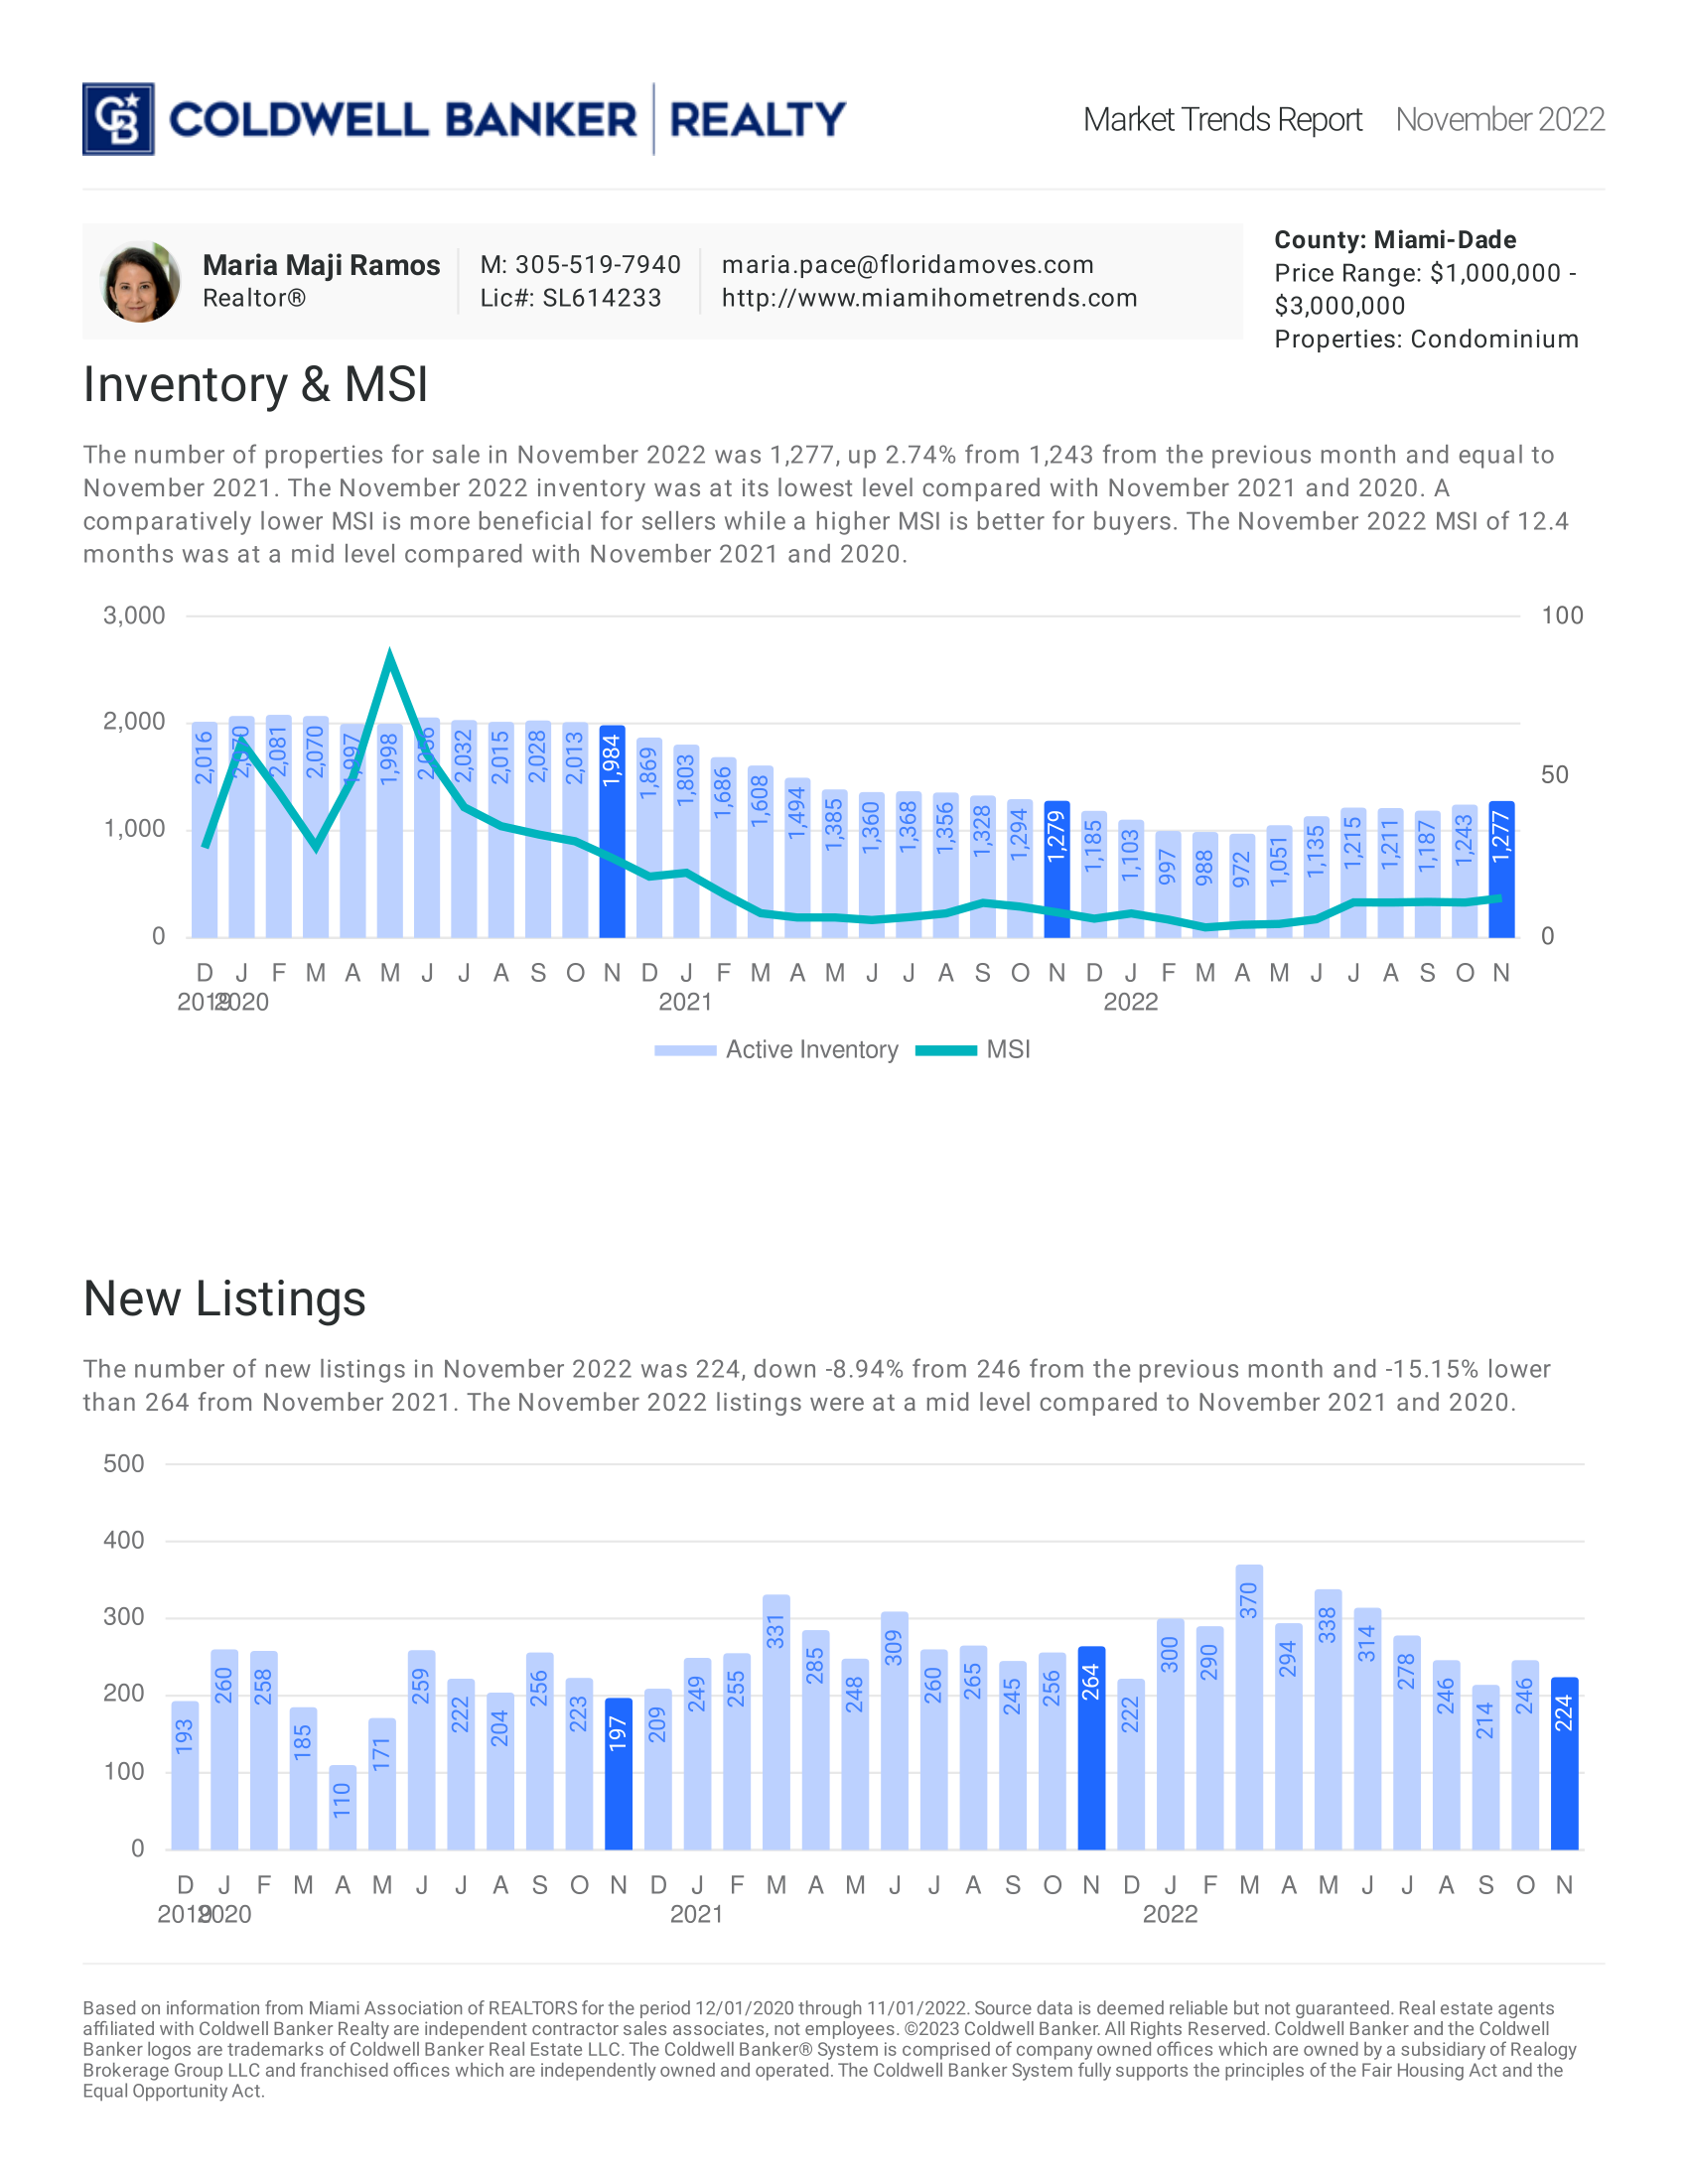
November 2022: Condo


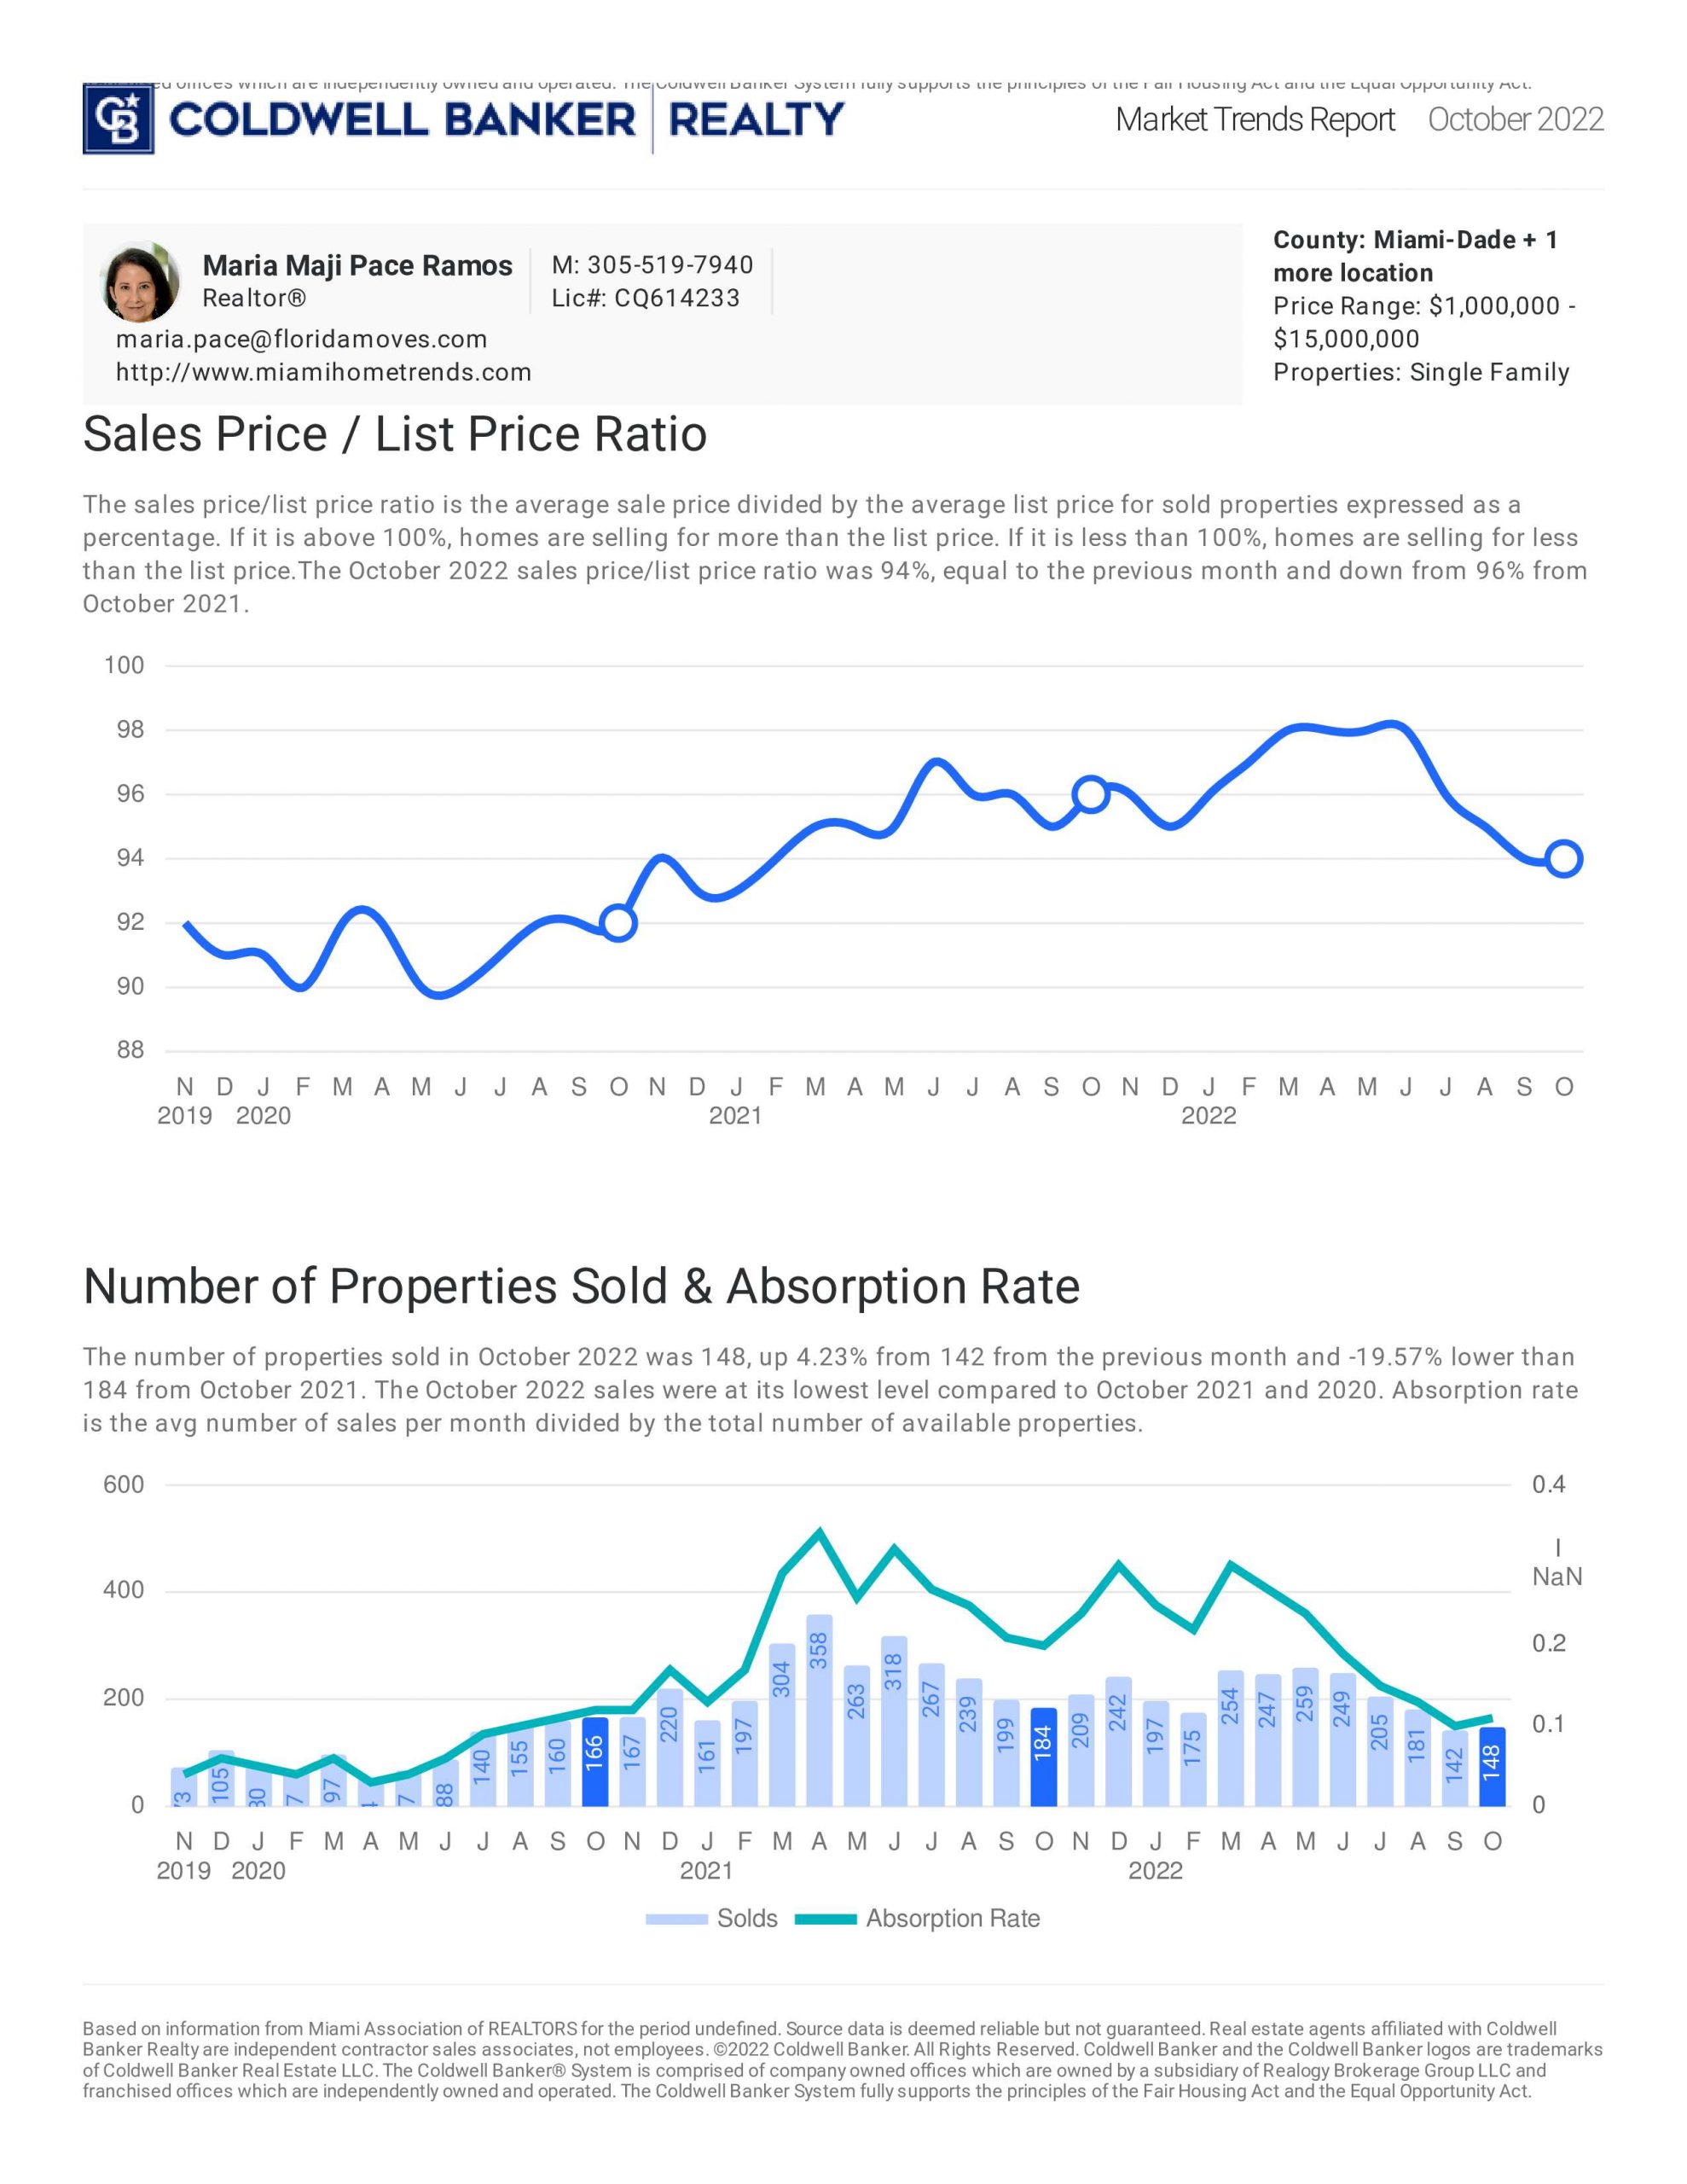
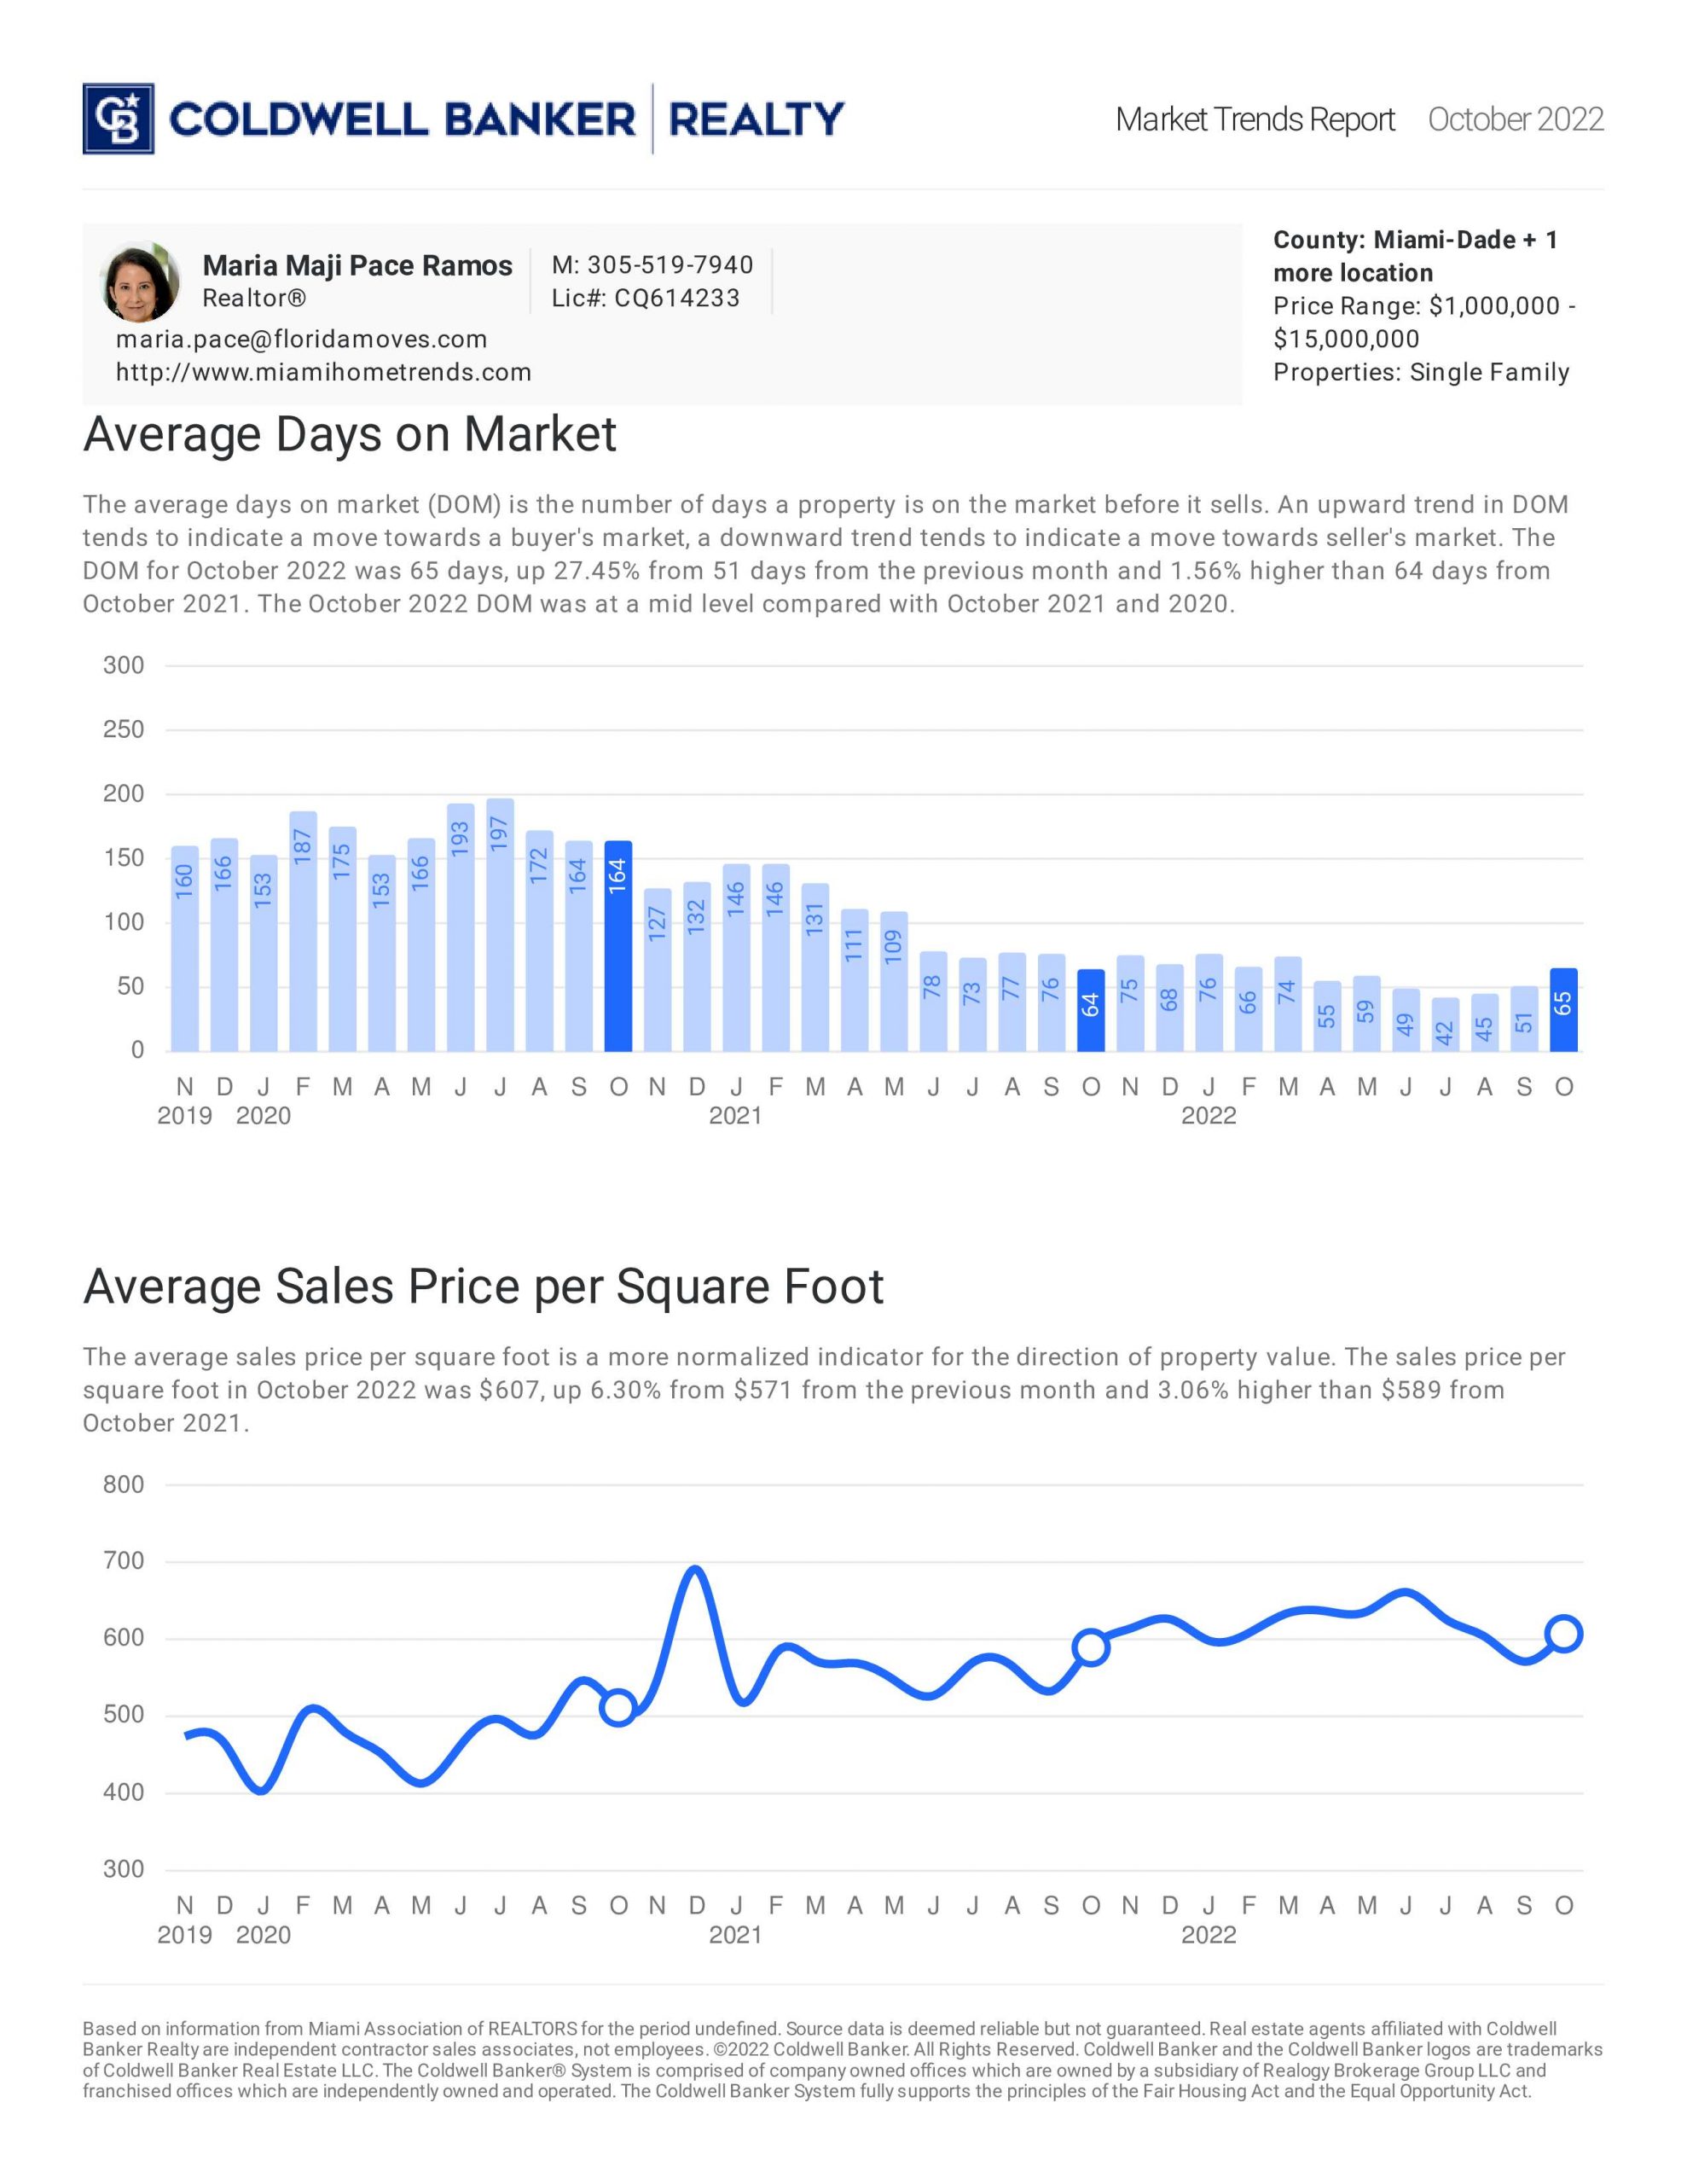
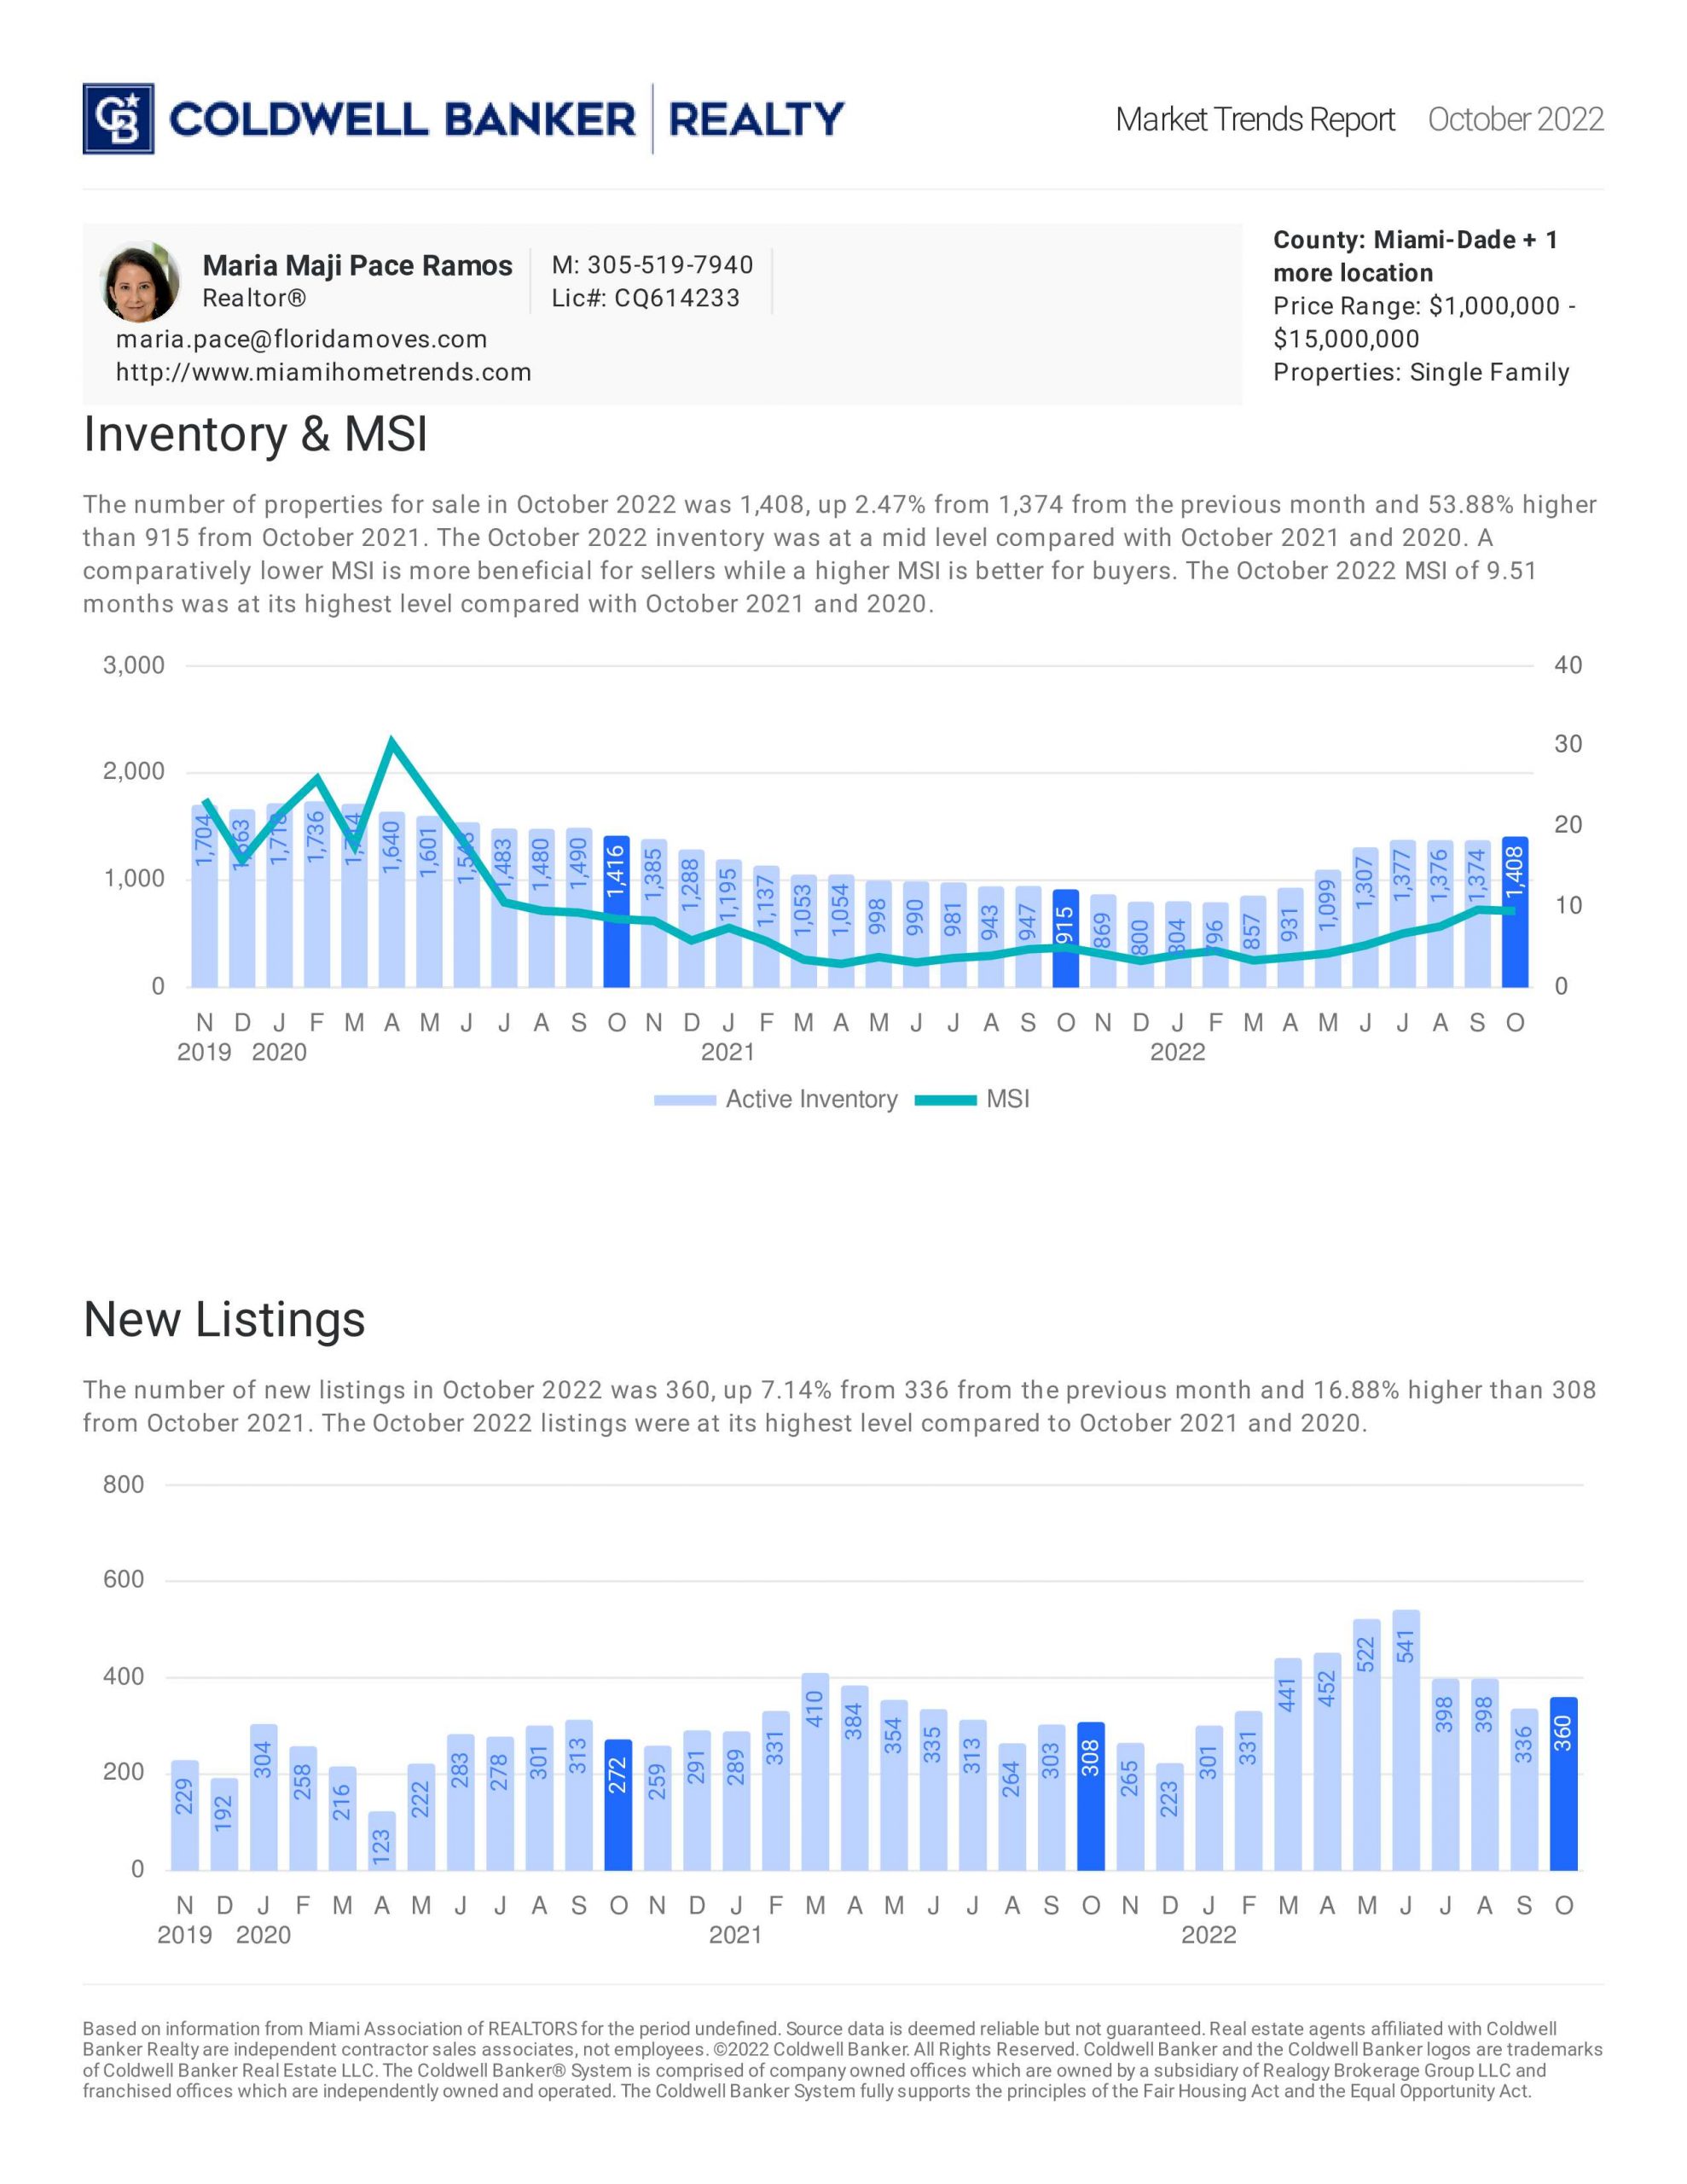
October 2022